DEC 01, 2022
www.angelone.in
Technical & Derivatives Report
xOOOOOOOO
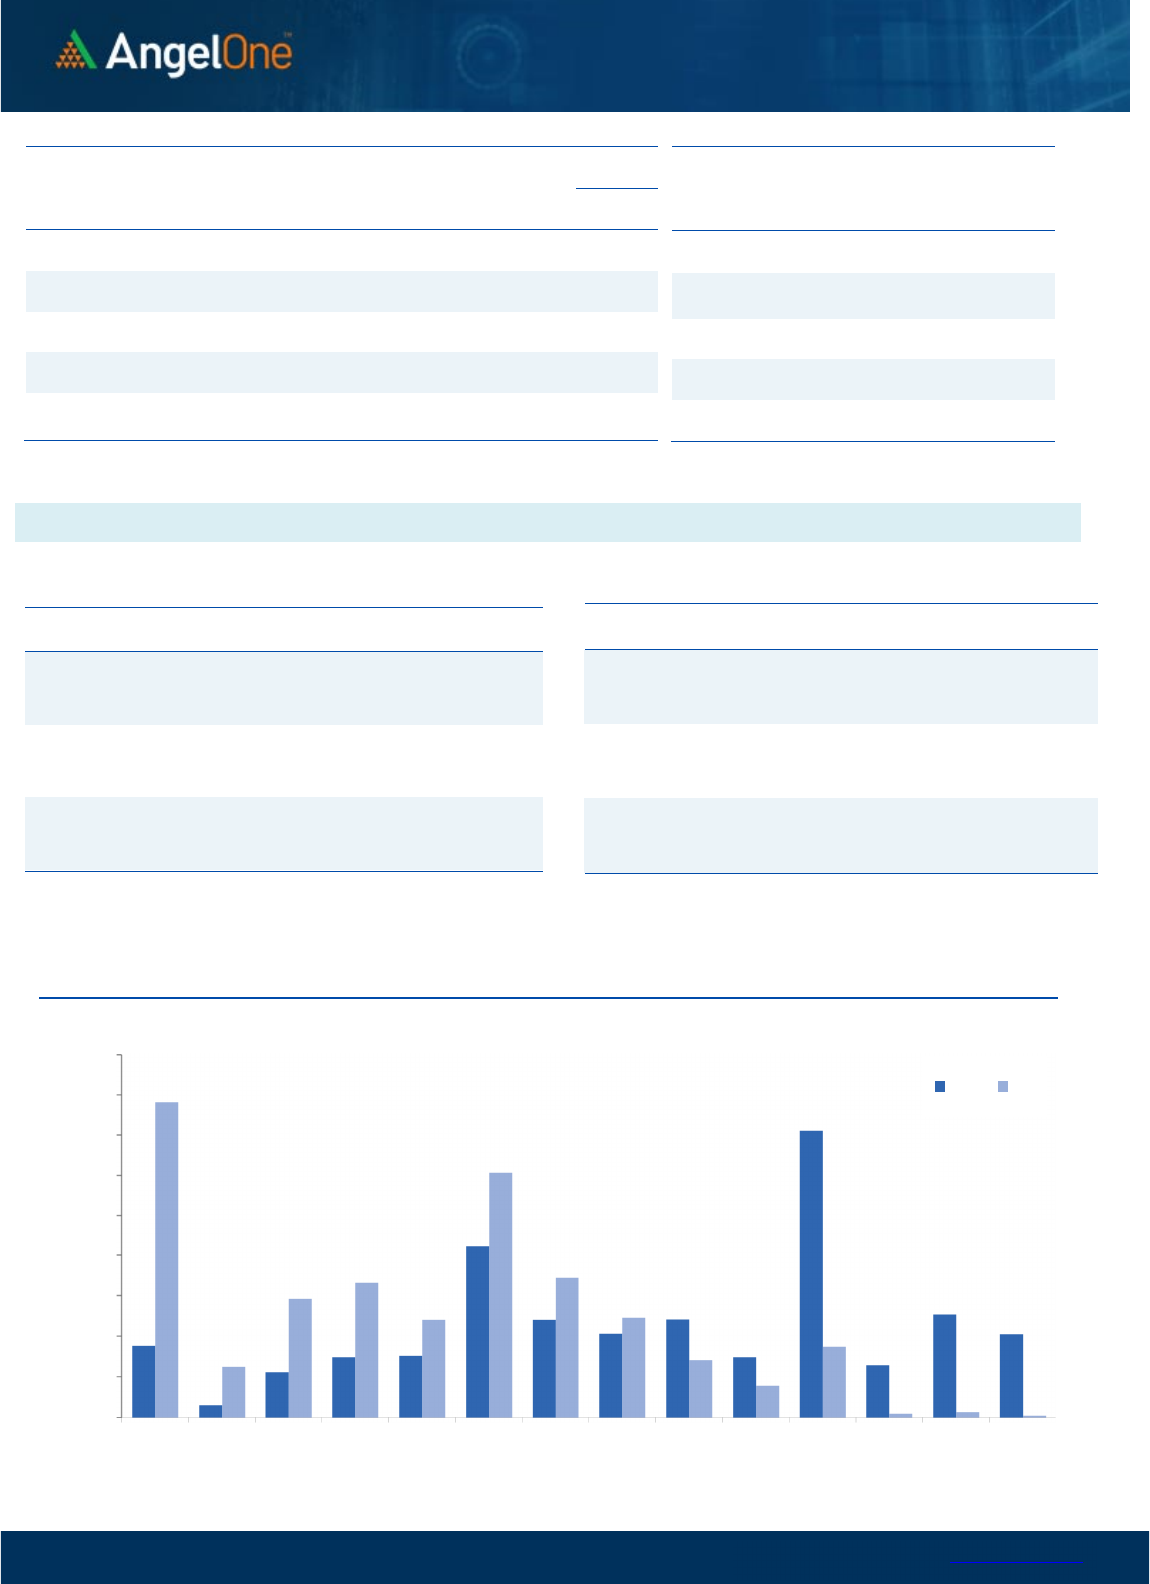
Nifty Bank Outlook (43231)
Bank Nifty started on a positive note however as the day
progressed it slipped lower not only to erase morning gains but to
move beyond the previous day's low. The undertone being bullish
this dip got bought into in a furious way during the second half to
eventually end with gains of 0.41% at 43231.
On the daily chart, it may seem prices remain within the
consolidation zone of the last four sessions however this is now the
highest closing and on the intraday charts, we are witnessing a
range breakout. Considering the fag end positive momentum, we
expect the prices to extend up move during the weekly expiry and
hence in case of any minor dip it should be used as a buying
opportunity. The levels to watch out for would be 43040 and 42880
on the downside whereas on the higher side 43500 - 43650 seems
to be an immediate target.
Key Levels
Support 1 – 43040 Resistance 1 – 43500
Support 2 – 42880 Resistance 2 – 43650
Exhibit 1: Nifty
Daily
Chart
Exhibit 2: Nifty Bank
Daily
Chart
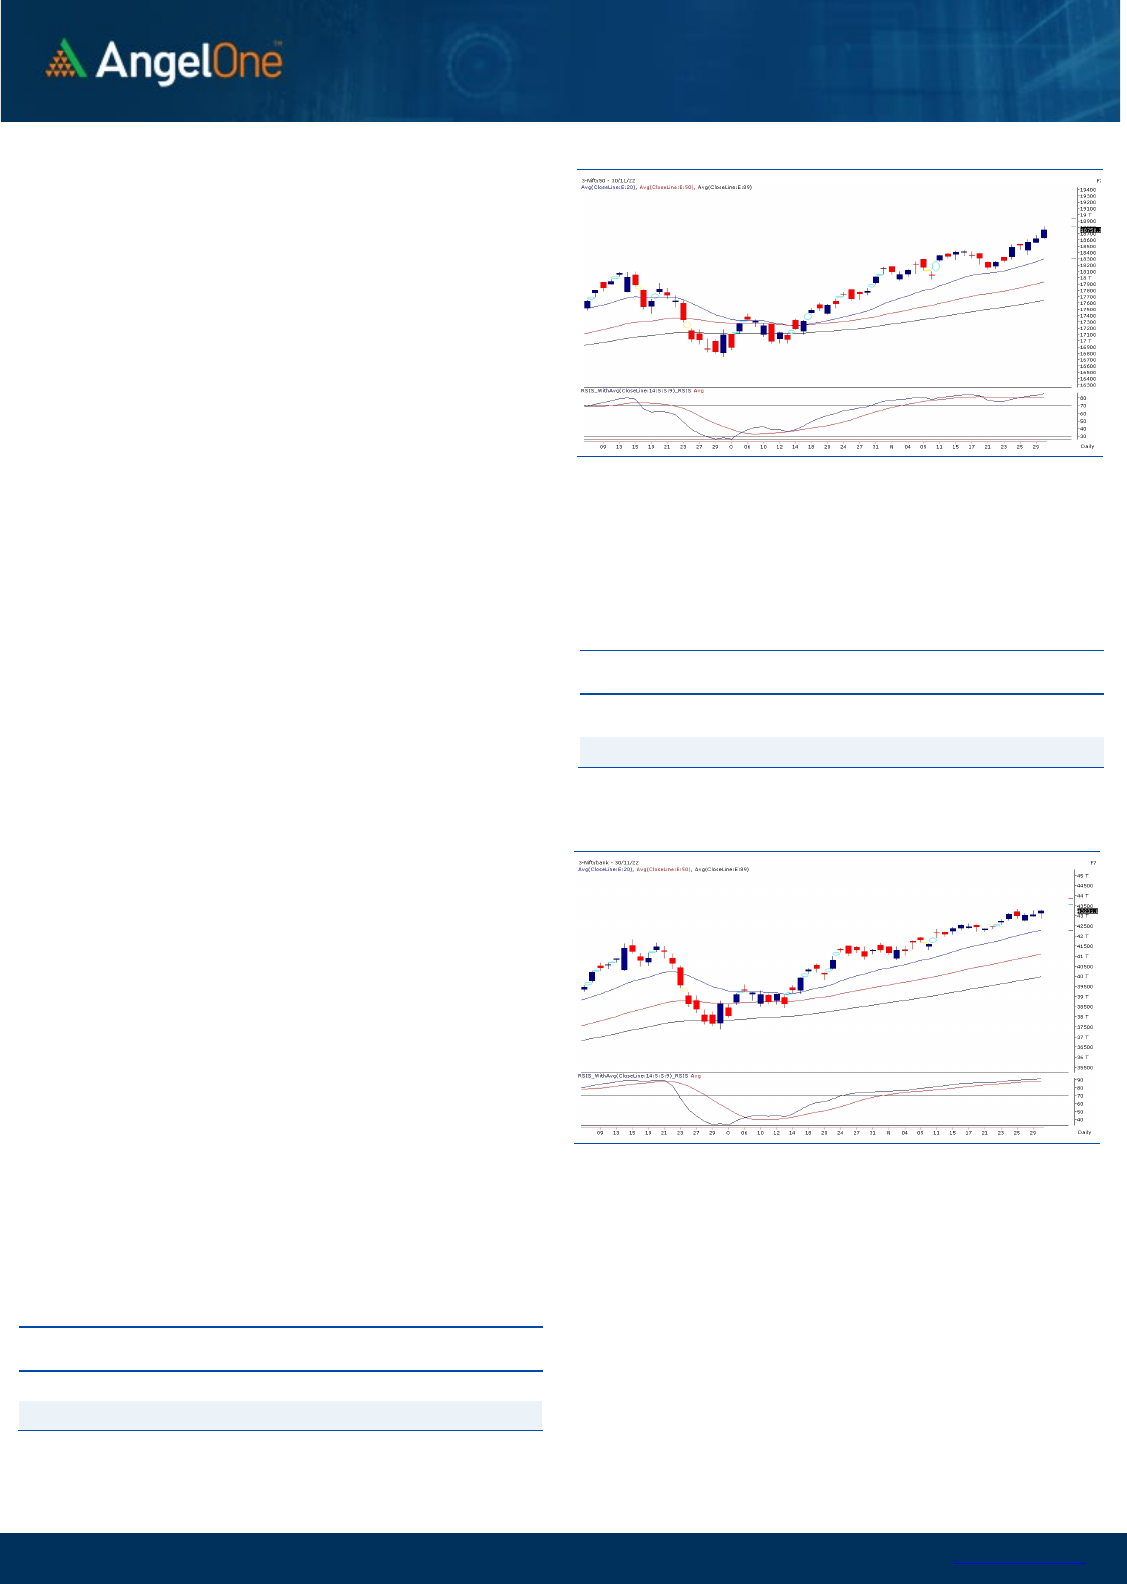
Sensex (63100) / Nifty (18758)
We started the session on a humble note in absence of global as
well as domestic triggers. Since there was no participation from
major heavyweight pockets, we continued with the consolidation
phase within a small range. However, at the stroke of the
penultimate hour, the buying momentum suddenly kicked in which
augmented in last half an hour of trade. With a complete gush
across the board, the Nifty hastened towards yet another milestone
of 18800 before anyone could even realize it. The adjusted close
happened tad above 18750 by adding three forth of a percent gains
to the bulls’ kitty.
The bulls continue to show their hegemony in the market and the
moment it feels as if they are going to loosen up their grip a bit,
moves like yesterday appear from nowhere. We have been
persistent with our optimistic approach and are not at all surprised
with seeing Nifty at new milestone of 18800. Hence, it’s advisable
not to fall for any intraday declines, because the positioning has
been quite strong and all meaningful dips are getting bought into.
Now, with most of the heavyweight spaces participating in the
move, we can consider this as a robust rally. Importantly, the
broader end of the spectrum has finally shown some signs of coming
out of the slumber phase.
Hence, the magical figure of 19000 is very much in sight now. For
the coming session, 18675 – 18600 should be seen as immediate
supports; whereas on the flipside, 18900 and then 19000 is the
key level to watch out for. Traders are advised to focus on stocks
from the cash segment, which are likely to find their mojo back
in coming days.
Key Levels
Support 1 – 18675 Resistance 1 – 18900
Support 2 – 18600 Resistance 2 – 19000

www.angelone.in
Technical & Derivatives Report
DEC 01, 2022
View
Our market maintained its winning streak for the
seventh consecutive session, wherein the benchmark
index Nifty50 logs a fresh high to settle above the
18750 zone with gains of 0.75 percent.
FIIs were net buyers in the cash market segment to
the tune of Rs. 9010 crores. Simultaneously, in Index
futures, they bought worth Rs. 1109 crores with an
increase in open interest, indicating long addition.
Looking at the overall F&O data, we have witnessed a
long addition in the benchmark index. On the options
front, the huge concentration of OI is visible in the
18600 put strike, followed by 18500 PE, indicating
nearby support. On the higher end, the piling up of
positions could be seen at 18800-19000 call strikes,
suggesting the intermediate resistance for the index.
Also, the stronger hands have remained steady with
their bullish bets as the ‘Long Short Ratio’ surged to
75% from 73%. Considering the recent price action, the
undertone is likely to remain bullish, and any intra-day
dip could be seen as an opportunity to add longs in the
index.
Comments
The Nifty futures open interest has increased by
4.23% and Bank Nifty futures open interest has
decreased by 0.41% as the market closed at 18758.35.
The Nifty December future closed with a premium of
116.15 point against a premium of 115.55 point in the
last trading session. The January series closed at a
premium of 208.80 point.
The INDIA VIX increased from 13.61 to 13.80. At the
same time, the PCR-OI of Nifty has increased to 1.55
from 1.28.
Few of the liquid counters where we have seen high
cost of carry are SRTRANSFIN, GMRINFRA, M&M,
ICICIGI and PIIND.
Historical Volatility
SCRIP HV
IDEA 73.53
IBULHSGFIN 70.37
RBLBANK 68.95
GNFC 59.86
HINDCOPPER 59.18
Nifty Vs OI
17800
18000
18200
18400
18600
18800
19000
8,000
9,000
10,000
11,000
12,000
13,000
14,000
15,000
16,000
11/10 11/15 11/17 11/22 11/24 11/28 11/30
Openinterest Nifty
OI Gainers
SCRIP OI
OI
CHG. (%)
PRICE
PRICE
CHG. (%)
TVSMOTOR 7991900 50.42 1048.15 0.45
CANBK 43613100 15.40 314.70 -2.14
ABB 1903750 14.86 3000.70 -0.83
VOLTAS 7311500 13.75 819.35 -0.71
ASHOKLEY 76810000 10.01 148.80 0.23
SRTRANSFIN 5914800 8.94 1349.90 2.62
CROMPTON 3912000 8.53 362.85 -0.20
GUJGASLTD 4576250 7.05 498.85 0.27
OI Losers
SCRIP OI
OI
CHG. (%)
PRICE
PRICE
CHG. (%)
IGL 8958125 -12.85 442.60 1.82
BAJAJ-AUTO 1120750 -10.05 3750.70 2.37
MARICO 8254800 -7.60 507.35 0.91
ICICIPRULI 17557500 -7.15 476.20 0.86
HINDUNILVR 6885000 -6.90 2684.30 1.81
BSOFT 8415100 -6.76 305.25 3.13
ICICIGI 4271250 -6.56 1211.15 3.03
CUMMINSIND 1848000 -6.21 1413.50 2.71
Put-Call Ratio
SCRIP PCR (OI) PCR (VOL)
NIFTY 1.55 1.01
BANKNIFTY 1.03 0.91
RELIANCE 0.71 0.42
ICICIBANK 0.71 0.53
INFY 0.68 0.58
www.angelone.in
Technical & Derivatives Report
DEC 01, 2022
Note: Above mentioned Bullish or Bearish Spreads in Nifty (Dec Series) are given as an information and not as a recommendation.
Nifty Spot =
1
8
758
.
3
5
FII Statistics for
November
30
, 2022
Detail Buy
Contracts
Open
Interest
Value
(in Cr.)
Sell
Net
CHANGE
INDEX
FUTURES
4007.81 2898.78 1109.03
201518 19814.83 1.29
INDEX
OPTIONS
1128169.74 1125694.87 2474.87
1999320 196205.87 6.15
STOCK
FUTURES
12811.02 11898.84 912.18
1978301 139117.91 0.14
STOCK
OPTIONS
6930.09 6958.99 (28.90) 103921 7566.55 7.81
Total 1151918.66
1147451.48
4467.18
4283060
362705.16
3.10
Turnover on
November
30
, 2022
Instrument
No. of
Contracts
Turnover
( in Cr. )
Change
(%)
Index
Futures
268705 2695307.91
28.81
Index
Options
152034048 3764209.55
21.89
Stock
Futures
795886 5712515.58
27.24
Stock
Options
2578158 366306.64 2.85
Total
25,78,158 366306.64 25.05
Bull-Call Spreads
Action Strike Price Risk Reward BEP
Buy
18700 345.60
59.95
40.05
18759.95
Sell
18800 285.65
Buy
18700 345.60
118.55
81.45
18818.55
Sell
18900 227.05
Buy
18800 285.65
58.60 41.40 18858.60
Sell 18900 227.05
Bear
-
Put Spreads
Action Strike Price Risk Reward BEP
Buy 18700 175.70
30.15
69.85
18669.85
Sell
18600 145.55
Buy 18700 175.70
53.80
146.20
18646.20
Sell 18500 121.90
Buy
18600 145.55
23.65 76.35 18576.35
Sell 18500 121.90
Nifty Put
-
Call Analysis
,0
500,000
1000,000
1500,000
2000,000
2500,000
3000,000
3500,000
4000,000
4500,000
18000 18100 18200 18300 18400 18500 18600 18700 18800 18900 19000 19100 19200 19300
Call Put

www.angelone.in
Technical & Derivatives Report
DEC 01, 2022
`
Daily Pivot Levels for Nifty Constituents
Scrips
S2
S1
PIVOT
R1 R2
ADANIENT 3,835 3,877
3,908 3,950
3,981
ADANIPORTS
869
875
879
886
890
APOLLOHOSP 4,592 4,659
4,710
4,777
4,827
ASIANPAINT
3,103
3,139
3,169
3,206
3,236
AXISBANK
878
889
897
909
917
BAJAJ-AUTO 3,630 3,690
3,732
3,792
3,833
BAJFINANCE 6,642 6,681
6,718
6,757
6,794
BAJAJFINSV 1,610 1,618
1,631
1,640
1,653
BPCL
332
337
340
345
348
BHARTIARTL
825
837
844
856
864
BRITANNIA 4,249 4,306
4,347 4,403
4,445
CIPLA 1,107 1,123
1,136 1,152
1,165
COALINDIA
225
226
228
229
230
DIVISLAB
3,317
3,361
3,390 3,434
3,464
DRREDDY 4,405 4,446
4,482
4,523
4,559
EICHERMOT
3,381
3,433
3,469 3,520 3,556
GRASIM
1,708
1,734
1,751 1,777
1,795
HCLTECH
1,110
1,115
1,123 1,128
1,135
HDFCBANK
1,590
1,599
1,606
1,615
1,622
HDFCLIFE
582
586
590
594
598
HDFC
2,653
2,673
2,686
2,706
2,720
HEROMOTOCO 2,803 2,828
2,844
2,869
2,885
HINDALCO
433
442
447
456 461
HINDUNILVR
2,593
2,639
2,668 2,714 2,743
ICICIBANK
934
943
951
960
968
INDUSINDBK
1,151
1,159
1,172 1,180
1,192
INFY
1,599
1,617
1,631 1,649
1,664
ITC
336
338
341 343
346
JSW STEEL 726 734
740
749
755
KOTAKBANK
1,900
1,924
1,939
1,963
1,978
LT 2,028 2,051
2,069
2,092
2,110
M&M
1,235
1,270
1,293
1,329
1,351
MARUTI 8,805 8,889
8,955 9,039
9,105
NESTLEIND
19,622
19,903
20,121
20,402
20,620
NTPC
169
170
172
173
175
ONGC
139
140
141
142 143
POWERGRID
215
219
222
227
230
RELIANCE
2,678
2,705
2,725
2,752
2,772
SBILIFE
1,238
1,261
1,275
1,297
1,312
SBIN
591
597
604
610
617
SUNPHARMA
1,029
1,038
1,048
1,056
1,067
TCS 3,354 3,372
3,394 3,412 3,433
TATACONSUM
797 808
815 825
832
TATAMOTORS
430
435
438
443
446
TATASTEEL 105 106
107
108
109
TECHM
1,055
1,066
1,074
1,085
1,093
TITAN 2,580 2,616
2,641
2,677
2,702
ULTRACEMCO 6,836 6,956
7,026
7,146
7,216
UPL 767 778
786
797
805
WIPRO 401 404
406
409
411

www.angelone.in
Technical & Derivatives Report
DEC 01, 2022
*
Technical and Derivatives Team:
Sameet Chavan Chief Analyst – Technical & Derivatives sameet.chavan@angelone.in
Sneha Seth Senior Analyst – Technical & Derivatives sneha.seth@angelone.in
Rajesh Bhosale Technical Analyst rajesh.bhosle@angelone.in
Osho Krishan Senior Analyst – Technical & Derivatives osho.krishan@angelone.in
Research Team Tel: 022 – 39357600 Website: www.angelone.in
For Technical Queries E-mail: technicalresearch-cso@angelone.in
For Derivatives Queries E-mail: derivatives.desk@angelone.in
DISCLAIMER
Angel One Limited (hereinafter referred to as “Angel”) is a registered Member of National Stock Exchange of India Limited, Bombay
Stock Exchange Limited and Metropolitan Stock Exchange Limited. It is also registered as a Depository Participant with CDSL and
Portfolio Manager and investment advisor with SEBI. It also has registration with AMFI as a Mutual Fund Distributor. Angel One
Limited is a registered entity with SEBI for Research Analyst in terms of SEBI (Research Analyst) Regulations, 2014 vide registration
number INH000000164. Angel or its associates has not been debarred/ suspended by SEBI or any other regulatory authority for
accessing /dealing in securities Market.
This document is solely for the personal information of the recipient, and must not be singularly used as the basis of any investment
decision. Nothing in this document should be construed as investment or financial advice. Each recipient of this document should
make such investigations as they deem necessary to arrive at an independent evaluation of an investment in the securities of the
companies referred to in this document (including the merits and risks involved), and should consult their own advisors to determine
the merits and risks of such an investment.
Angel or its associates or research analyst or his relative may have actual/beneficial ownership of 1% or more in the securities of
the subject company at the end of the month immediately preceding the date of publication of the research report. Neither Angel or
its associates nor Research Analysts or his relative has any material conflict of interest at the time of publication of research report.
Angel or its associates might have received any compensation from the companies mentioned in the report during the period
preceding twelve months from the date of this report for services in respect of managing or co-managing public offerings, corporate
finance, investment banking or merchant banking, brokerage services or other advisory service in a merger or specific transaction
in the normal course of business. Angel or its associates did not receive any compensation or other benefits from the companies
mentioned in the report or third party in connection with the research report. Neither Angel nor its research analyst entity has been
engaged in market making activity for the subject company.
Reports based on technical and derivative analysis center on studying charts of a stock's price movement, outstanding positions and
trading volume, as opposed to focusing on a company's fundamentals and, as such, may not match with a report on a company's
fundamentals. Investors are advised to refer the Fundamental and Technical Research Reports available on our website to evaluate
the contrary view, if any.
The information in this document has been printed on the basis of publicly available information, internal data and other reliable
sources believed to be true, but we do not represent that it is accurate or complete and it should not be relied on as such, as this
document is for general guidance only. Angel One Limited or any of its affiliates/ group companies shall not be in any way responsible
for any loss or damage that may arise to any person from any inadvertent error in the information contained in this report. Angel One
Limited has not independently verified all the information contained within this document. Accordingly, we cannot testify, nor make
any representation or warranty, express or implied, to the accuracy, contents or data contained within this document. While Angel
One Limited endeavors to update on a reasonable basis the information discussed in this material, there may be regulatory,
compliance, or other reasons that prevent us from doing so.
This document is being supplied to you solely for your information, and its contents, information or data may not be reproduced,
redistributed or passed on, directly or indirectly.
Neither Angel One Limited, nor its directors, employees or affiliates shall be liable for any loss or damage that may arise from or in
connection with the use of this information. Angel or its associates or Research Analyst or his relative might have financial interest
in the subject company. Research analyst has not served as an officer, director or employee of the subject company.
