NOV 01, 2022
www.angelone.in
Technical & Derivatives Report
xOOOOOOOO
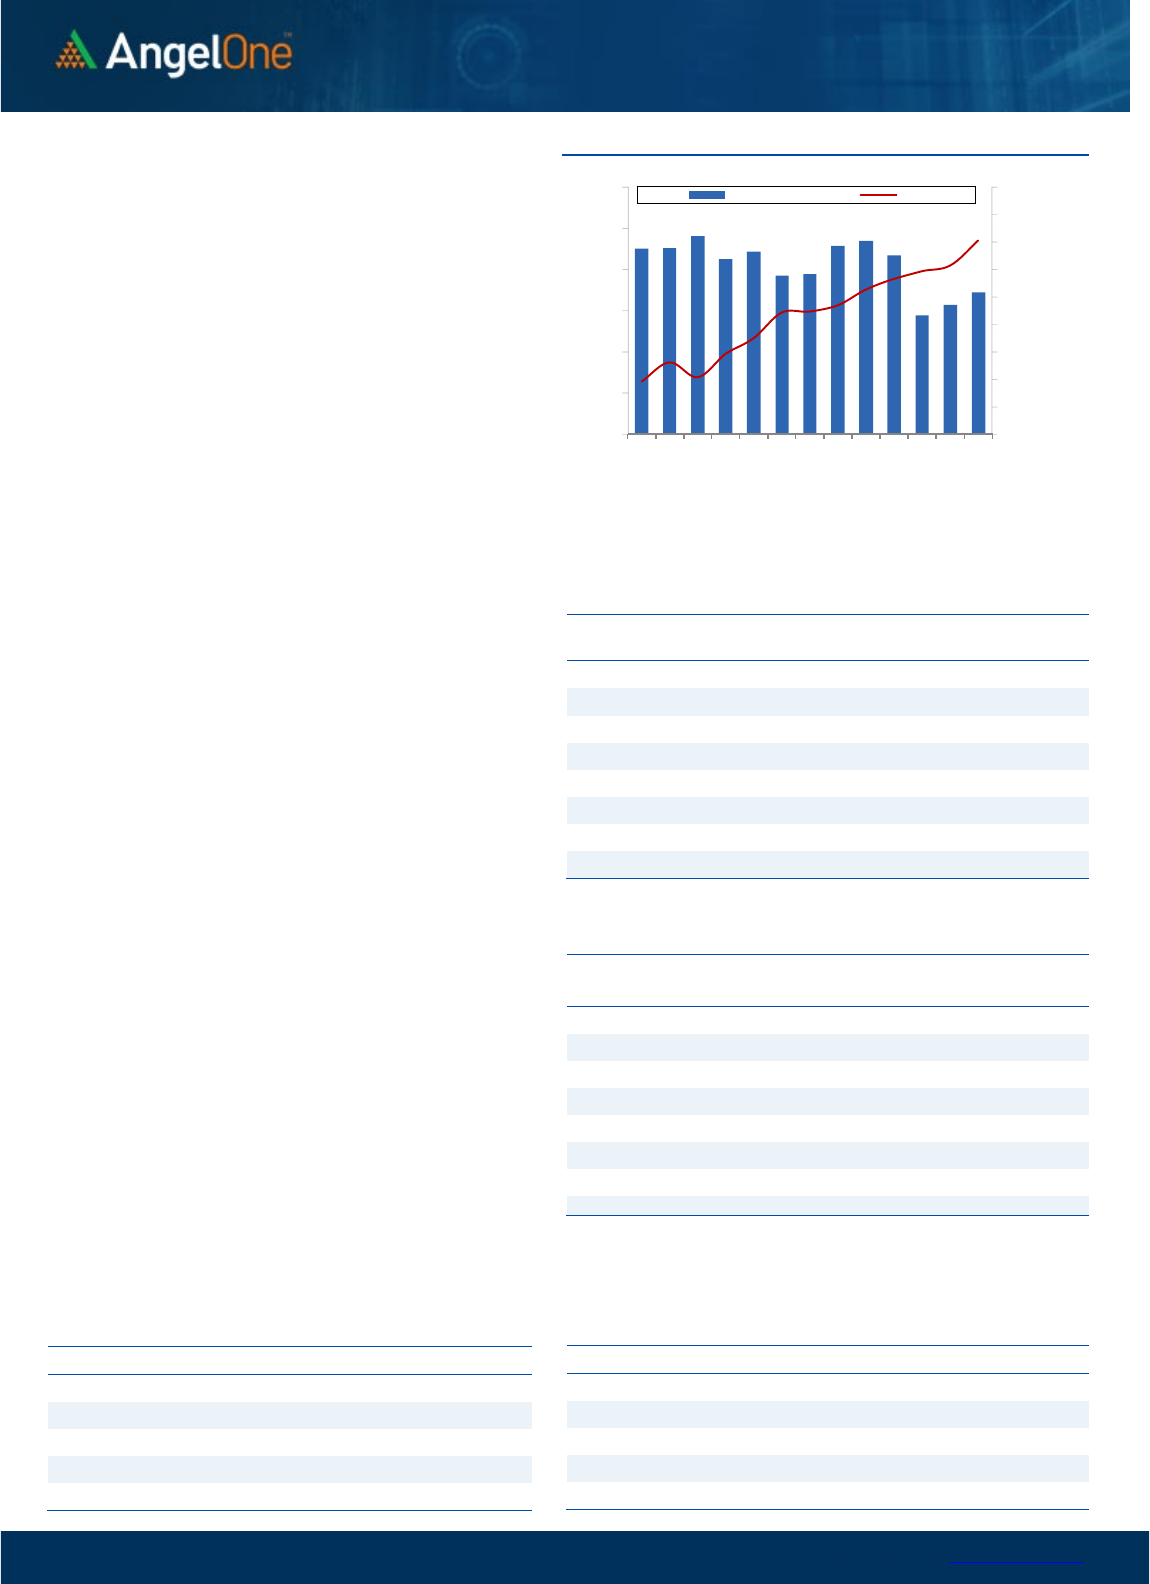
Nifty Bank Outlook (41308)
Bank Nifty as well started the week with a strong gap-up opening,
however, post the opening there was no major traction as the
Index remained within a slender range of around 250 points and
ended near the opening levels with gains of 0.77% tad above
41300.
The bank index has been the major driver for the recent run in the
broader markets and it ended October month with strong gains of
around 7%. The last few sessions, however, have been very range
bound and it is quite evident after a strong move of more than 3500
points in the last one month. We sense this as a healthy
consolidation before the next leg of the rally and hence traders
should avoid being skeptical and use any dips as a buying
opportunity. As far as levels are concerned, immediate support is
seen at 41100 - 41000 levels whereas, on the flip side, immediate
resistance is at 41530 - 41840 levels.
Key Levels
Support 1 – 41100 Resistance 1 – 41530
Support 2 – 41000 Resistance 2 – 41840
Exhibit 1: Nifty
Daily
Chart
Exhibit 2: Nifty Bank
Daily
Chart
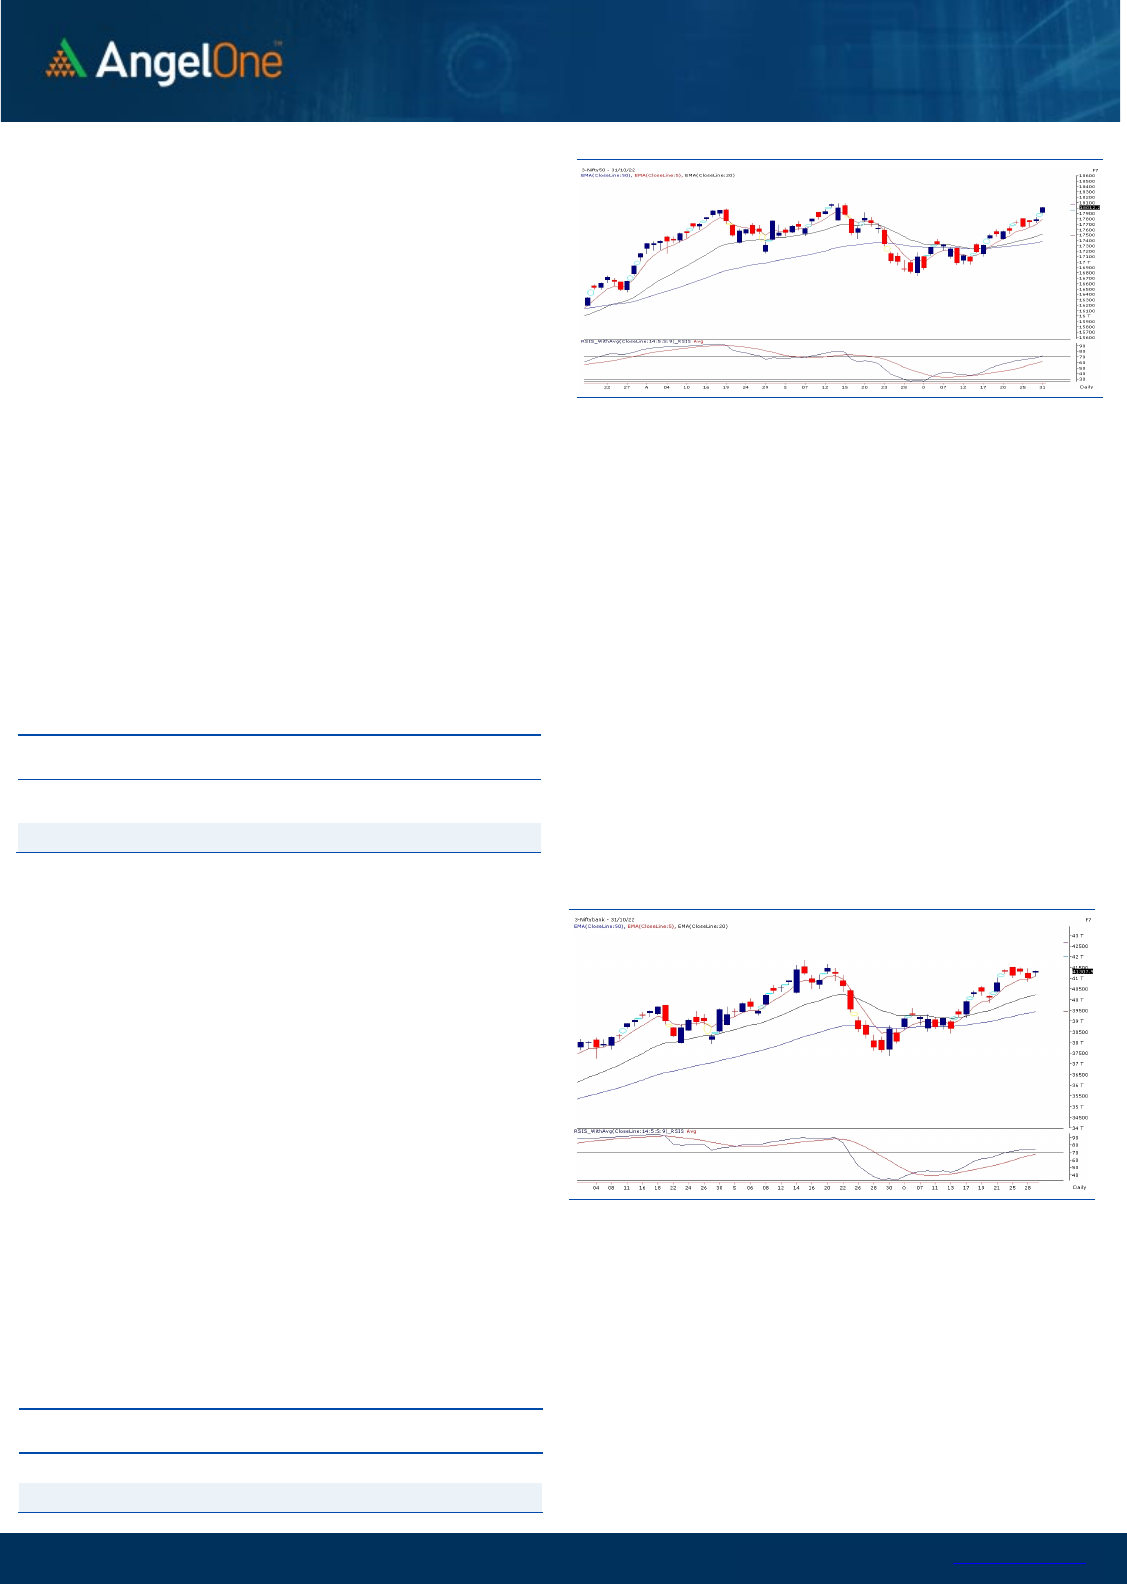
Sensex (60747) / Nifty (18012)
Markets had a buoyant start for the new trading week and last
week’s struggle around 17800 finally came to an end as we
managed to open convincingly above it. After the initial upticks,
index slipped into a consolidation and kept flirting with
psychological mark of 18000. The buying re-emerged towards the
fag end in some of the heavyweights, which helped Nifty finally
surpass this key figure with some authority.
With yesterday’s strong move, the benchmark index Nifty has
confirmed highest monthly close ever. The optimism on the
domestic front coupled with some signs of relief globally, indicates
next leg of the rally to unfold to challenge the record highs soon. For
the coming session, September highs around 18115 looks very
much on cards and once we surpass it, 18200 - 18350 becomes the
next zone to watch out for. On the flipside, 17900 followed by 17800
are now likely to provide cushion to intermediate decline. Traders
are advised to remain upbeat and now we may see some
consolidation with positive bias in key indices; but lot of individuals
themes are going to get unfolded.
Key Levels
Support 1 – 17900 Resistance 1 – 18115
Support 2 – 17800 Resistance 2 – 18200
www.angelone.in
Technical & Derivatives Report
NOV 01, 2022
View
Our market has started the week on a promising note,
wherein the benchmark index Nifty50 witnessed a
gap-up opening and maintained the positive stature
throughout the day. Nifty reclaimed the 18000 mark
with gains of 1.27 percent.
FIIs were net buyers in the cash market segment to
the tune of Rs. 4179 crores. Simultaneously, in Index
futures, they bought worth Rs. 1553 crores with a slight
decrease in open interest, indicating short covering.
Looking at the overall F&O data, we have witnessed
the building up of long position in the benchmark index.
On the options front, the piling up of positions is visible
in the 17800-18000 put strikes, indicating a shift in the
support base. On the higher end, the maximum OI
concentration is seen at the 18500 call strike, followed
by 18200 CE, which is likely to act as intermediate
resistance for the index. Also, the ‘Long Short Ratio’
has expanded to 63% from 57%. Considering the recent
price actions, the undertone is likely to remain upbeat,
wherein intraday dips could be utilized to add fresh
long bets in the indices.
Comments
The Nifty futures open interest has increased by
4.99%. and Bank Nifty futures open interest has
decreased by 0.37% as the market closed at 18012.20.
The Nifty November future closed with a premium of
38.85 point against a premium of 43.40 point in the
last trading session. The December series closed at
a premium of 97.75 point.
The INDIA VIX decreased from 15.92 to 15.80. At the
same time, the PCR-OI of Nifty has increased from
1.12 to 1.32.
Few of the liquid counters where we have seen high
cost of carry are INTELLECT, BANDHANBNK,
ULTRACEMCO, TRENT and SHREECEM.
Historical Volatility
SCRIP HV
IDEA 77.03
RBLBANK 71.80
IBULHSGFIN 71.41
ZEEL 61.69
HINDCOPPER 60.87
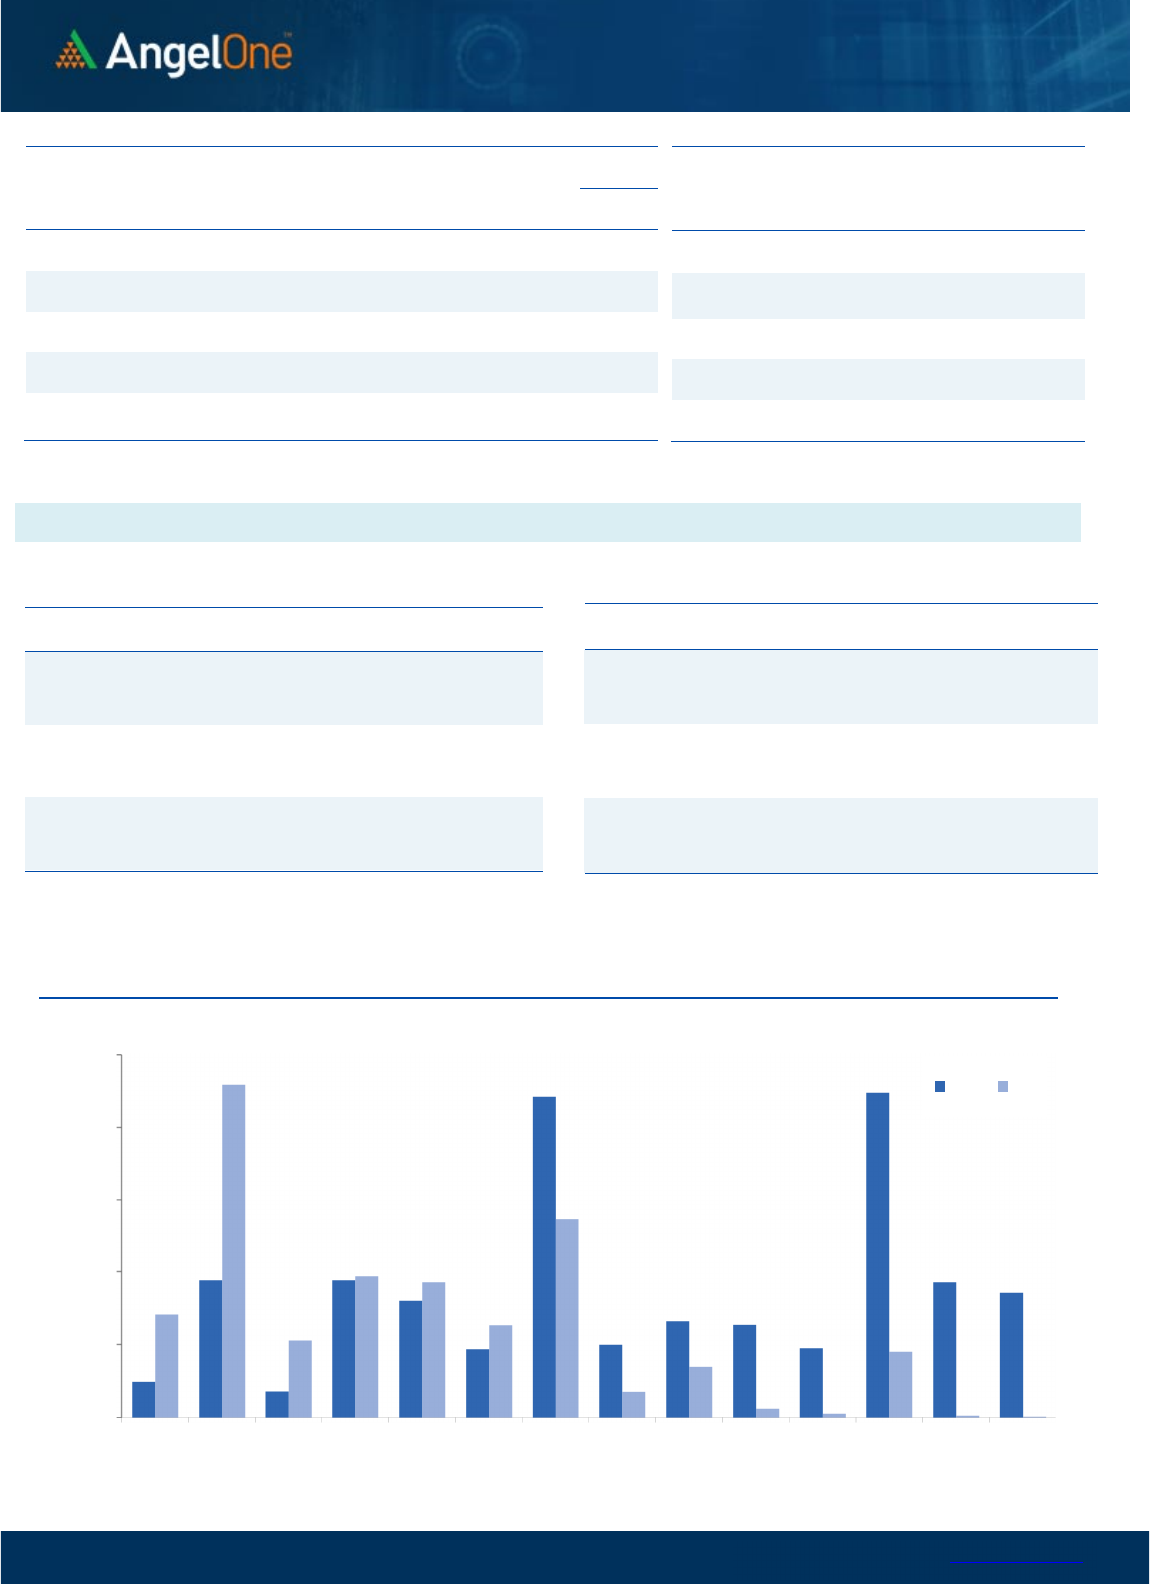
Nifty Vs OI
16600
16800
17000
17200
17400
17600
17800
18000
18200
18400
6,000
8,000
10,000
12,000
14,000
16,000
18,000
10/11 10/13 10/17 10/19 10/21 10/27 10/31
Openinterest Nifty
OI Gainers
SCRIP OI
OI
CHG. (%)
PRICE
PRICE
CHG. (%)
INTELLECT 3242250 87.79 431.60 -13.67
BANDHANBNK 37854000 37.89 238.55 -9.84
NMDC 24106150 28.34 99.75 -0.99
VOLTAS 4688600 17.14 876.20 0.42
JKCEMENT 419750 16.27 2712.65 5.02
DRREDDY 1871750 16.07 4433.65 0.13
METROPOLIS 744700 15.65 1691.75 4.69
ABFRL 8385000 14.32 353.90 3.32
OI Losers
SCRIP OI
OI
CHG. (%)
PRICE
PRICE
CHG. (%)
SBICARD 6000000 -12.08 826.65 2.07
NTPC 45451800 -11.30 173.10 -1.00
BAJAJFINSV 6066500 -7.50 1687.50 2.17
TATACHEM 7466500 -6.97 1132.80 0.22
CROMPTON 5146500 -6.18 362.30 2.58
MFSL 2276300 -4.89 708.05 0.94
BAJFINANCE 4780125 -4.80 7143.80 1.95
PFC 50145600 -4.70 115.20 1.37
Put-Call Ratio
SCRIP PCR (OI) PCR (VOL)
NIFTY 1.32 0.89
BANKNIFTY 0.93 0.94
RELIANCE 0.60 0.45
ICICIBANK 0.50 0.58
INFY 0.62 0.46
www.angelone.in
Technical & Derivatives Report
NOV 01, 2022
Note: Above mentioned Bullish or Bearish Spreads in Nifty (Nov Series) are given as an information and not as a recommendation.
Nifty Spot =
1
8012
.
2
0
FII Statistics for
October
31
, 2022
Detail Buy
Contracts
Open
Interest
Value
(in Cr.)
Sell
Net
CHANGE
INDEX
FUTURES
3869.04 2315.79 1553.25
127636 12047.10 (3.48)
INDEX
OPTIONS
605116.71 606223.39 (1106.68) 1286783 120992.82 6.95
STOCK
FUTURES
12171.29 10321.61 1849.68
2140893 143690.35 0.06
STOCK
OPTIONS
8214.28 8184.99 29.29
87156 6188.96 21.00
Total 629371.32
627045.78
2325.54
3642468
282919.23
2.69
Turnover on
October
31
, 2022
Instrument
No. of
Contracts
Turnover
( in Cr. )
Change
(%)
Index
Futures
261149 2511555.35 6510.15
Index Options
80322598 3265439.86 -68.03
Stock
Futures
798748 5440562.23 9228.44
Stock
Options
2768083 374782.40 64.31
Total
27,68,083 374782.40 10.01
Bull-Call Spreads
Action Strike Price Risk Reward BEP
Buy
18000 294.90
54.25
45.75
18054.25
Sell
18100 240.65
Buy
18000 294.90
103.80
96.20
18103.80
Sell
18200 191.10
Buy
18100 240.65
49.55 50.45 18149.55
Sell 18200 191.10
Bear
-
Put Spreads
Action Strike Price Risk Reward BEP
Buy 18000 245.35
37.80
62.20
17962.20
Sell
17900 207.55
Buy 18000 245.35
71.65
128.35
17928.35
Sell 17800 173.70
Buy
17900 207.55
33.85 66.15 17866.15
Sell 17800 173.70
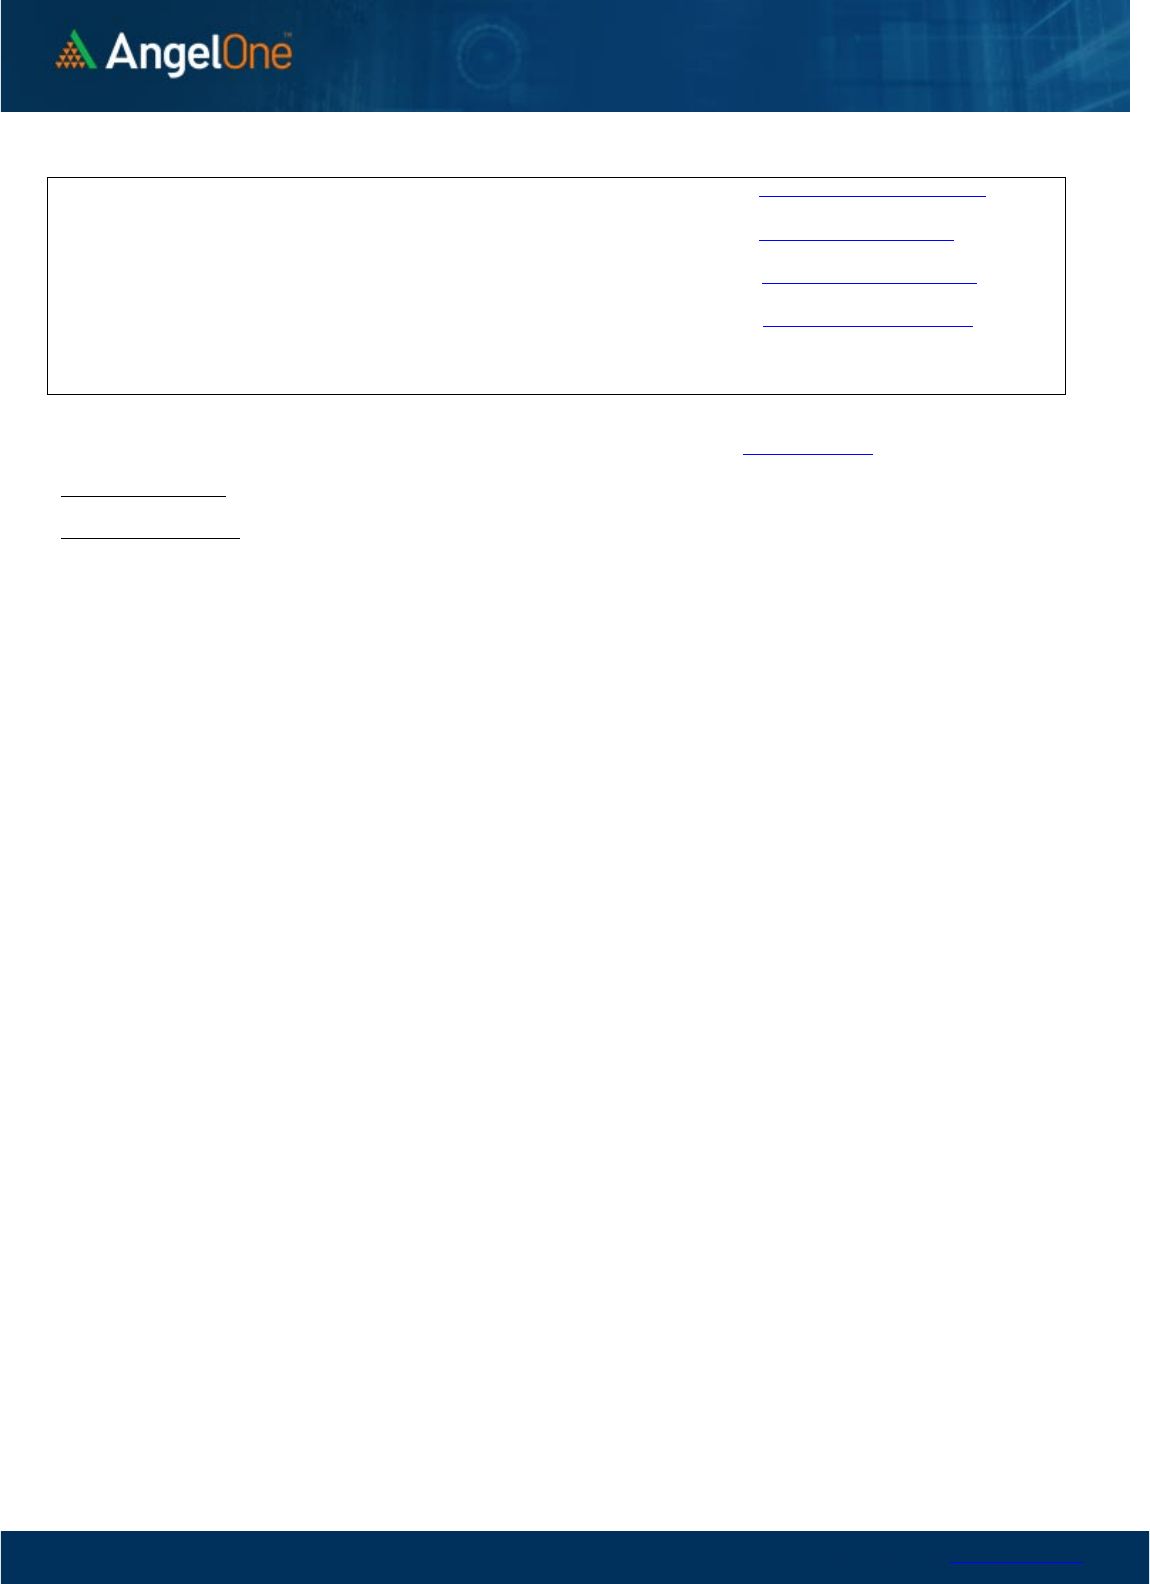
Nifty Put
-
Call Analysis
,0
500,000
1000,000
1500,000
2000,000
2500,000
17400 17500 17600 17700 17800 17900 18000 18100 18200 18300 18400 18500 18600 18700
Call Put

www.angelone.in
Technical & Derivatives Report
NOV 01, 2022
`
Daily Pivot Levels for Nifty Constituents
Scrips
S2
S1
PIVOT
R1 R2
ADANIENT 3,311 3,329
3,345
3,363
3,378
ADANIPORTS 813 818
825
830
836
APOLLOHOSP 4,411 4,464
4,545
4,598 4,678
ASIANPAINT 3,042 3,075
3,094 3,127
3,146
AXISBANK
893
899
909
915
925
BAJAJ-AUTO
3,632
3,652
3,679
3,699
3,726
BAJFINANCE
7,010
7,077
7,113 7,180
7,217
BAJAJFINSV
1,652
1,670
1,680
1,698
1,708
BPCL 299 301
304
306
308
BHARTIARTL 815 823
829
837
842
BRITANNIA 3,708 3,737
3,769
3,798 3,829
CIPLA 1,149 1,158
1,168
1,177
1,187
COALINDIA
242
244
246
248
250
DIVISLAB 3,546 3,578
3,599
3,630
3,651
DRREDDY
4,187
4,311
4,468
4,591
4,748
EICHERMOT
3,718
3,784
3,824 3,890 3,930
GRASIM
1,672
1,697
1,713 1,738
1,755
HCLTECH
1,027
1,034
1,043
1,050
1,059
HDFCBANK
1,457
1,477
1,487
1,507
1,518
HDFCLIFE
529
535
538
544
547
HDFC 2,390 2,430
2,452 2,492
2,515
HEROMOTOCO 2,638 2,658
2,676
2,695
2,713
HINDALCO
400
403
406
409 412
HINDUNILVR 2,525 2,538
2,555 2,568
2,585
ICICIBANK
898
903
910
916
923
INDUSINDBK 1,126 1,135
1,147
1,155
1,168
INFY
1,522
1,530
1,538
1,546
1,554
ITC
342
345
348
351
354
JSW STEEL 666 670
673
677 681
KOTAKBANK
1,878
1,890
1,901 1,913
1,924
LT
1,956
1,989
2,012
2,046 2,068
M&M
1,299
1,324
1,341
1,366
1,383
MARUTI
9,265
9,396
9,583 9,714 9,900
NESTLEIND 20,008 20,186
20,328
20,506
20,648
NTPC
167
170
172
175
177
ONGC
132
133
134 135
136
POWERGRID
225
226
228
230
232
RELIANCE
2,519
2,534
2,548
2,563
2,576
SBILIFE
1,247
1,256
1,265
1,275
1,283
SBIN
564
569
573
578
582
SUNPHARMA 976 996
1,012 1,032
1,048
TCS
3,169
3,181
3,190
3,202
3,211
TATACONSUM
758
764
768
774
779
TATAMOTORS
409
411
414 416
418
TATASTEEL 99 101
101
102 103
TECHM
1,040
1,052
1,065
1,077
1,090
TITAN 2,711 2,736
2,764
2,789
2,816
ULTRACEMCO
6,357
6,536
6,634 6,812
6,910
UPL
703
717
724
738
745
WIPRO
383
385
387
388
390
www.angelone.in
Technical & Derivatives Report
NOV 01, 2022
*
Technical and Derivatives Team:
Sameet Chavan Chief Analyst – Technical & Derivatives sameet.chavan@angelone.in
Sneha Seth Senior Analyst – Technical & Derivatives sneha.seth@angelone.in
Rajesh Bhosale Technical Analyst rajesh.bhosle@angelone.in
Osho Krishan Senior Analyst – Technical & Derivatives osho.krishan@angelone.in
Research Team Tel: 022 – 39357600 Website: www.angelone.in
For Technical Queries E-mail: technicalresearch-cso@angelone.in
For Derivatives Queries E-mail: derivatives.desk@angelone.in
DISCLAIMER
Angel One Limited (hereinafter referred to as “Angel”) is a registered Member of National Stock Exchange of India Limited, Bombay
Stock Exchange Limited and Metropolitan Stock Exchange Limited. It is also registered as a Depository Participant with CDSL and
Portfolio Manager and investment advisor with SEBI. It also has registration with AMFI as a Mutual Fund Distributor. Angel One
Limited is a registered entity with SEBI for Research Analyst in terms of SEBI (Research Analyst) Regulations, 2014 vide registration
number INH000000164. Angel or its associates has not been debarred/ suspended by SEBI or any other regulatory authority for
accessing /dealing in securities Market.
This document is solely for the personal information of the recipient, and must not be singularly used as the basis of any investment
decision. Nothing in this document should be construed as investment or financial advice. Each recipient of this document should
make such investigations as they deem necessary to arrive at an independent evaluation of an investment in the securities of the
companies referred to in this document (including the merits and risks involved), and should consult their own advisors to determine
the merits and risks of such an investment.
Angel or its associates or research analyst or his relative may have actual/beneficial ownership of 1% or more in the securities of
the subject company at the end of the month immediately preceding the date of publication of the research report. Neither Angel or
its associates nor Research Analysts or his relative has any material conflict of interest at the time of publication of research report.
Angel or its associates might have received any compensation from the companies mentioned in the report during the period
preceding twelve months from the date of this report for services in respect of managing or co-managing public offerings, corporate
finance, investment banking or merchant banking, brokerage services or other advisory service in a merger or specific transaction
in the normal course of business. Angel or its associates did not receive any compensation or other benefits from the companies
mentioned in the report or third party in connection with the research report. Neither Angel nor its research analyst entity has been
engaged in market making activity for the subject company.
Reports based on technical and derivative analysis center on studying charts of a stock's price movement, outstanding positions and
trading volume, as opposed to focusing on a company's fundamentals and, as such, may not match with a report on a company's
fundamentals. Investors are advised to refer the Fundamental and Technical Research Reports available on our website to evaluate
the contrary view, if any.
The information in this document has been printed on the basis of publicly available information, internal data and other reliable
sources believed to be true, but we do not represent that it is accurate or complete and it should not be relied on as such, as this
document is for general guidance only. Angel One Limited or any of its affiliates/ group companies shall not be in any way responsible
for any loss or damage that may arise to any person from any inadvertent error in the information contained in this report. Angel One
Limited has not independently verified all the information contained within this document. Accordingly, we cannot testify, nor make
any representation or warranty, express or implied, to the accuracy, contents or data contained within this document. While Angel
One Limited endeavors to update on a reasonable basis the information discussed in this material, there may be regulatory,
compliance, or other reasons that prevent us from doing so.
This document is being supplied to you solely for your information, and its contents, information or data may not be reproduced,
redistributed or passed on, directly or indirectly.
Neither Angel One Limited, nor its directors, employees or affiliates shall be liable for any loss or damage that may arise from or in
connection with the use of this information. Angel or its associates or Research Analyst or his relative might have financial interest
in the subject company. Research analyst has not served as an officer, director or employee of the subject company.
