March 01, 2023
www.angelone.in
Technical & Derivatives Report
Nifty Bank
Outlook (
40
269
)
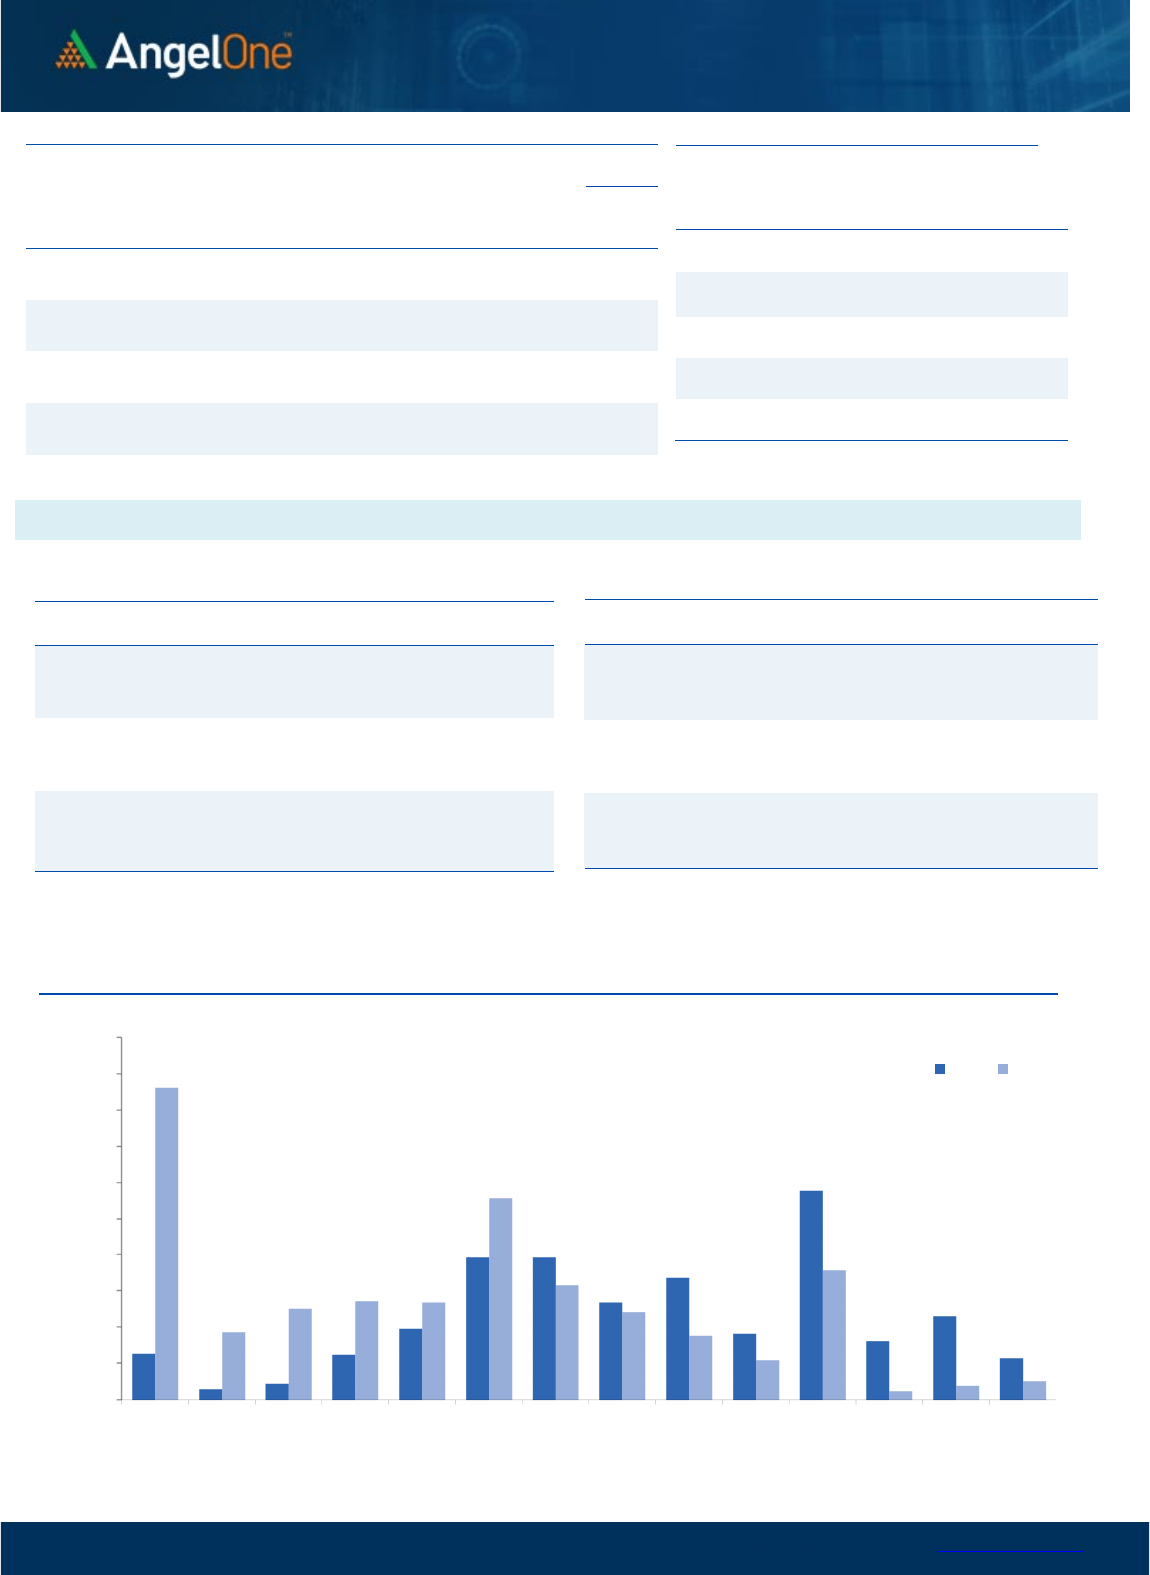
The banking index started the session on a flat note marginally in
the green. However, during the first half, previous day’s strong
performing space lacked follow up buying and hence, we saw some
tentativeness at higher levels. Although, it corrected slightly, there
was no damage to the bullishness it displayed on Monday. In fact,
towards the latter part of the day, we once again saw a good buying
emerging in some of the banking counters. Eventually, the
BANKNIFTY managed to recover fair bit of ground to conclude with
negligible loss. The BANKNIFTY maintains its firmness and unlike
Nifty, it has convincingly managed to defend its recent swing low
(on multiple occasions) of 39700 on a closing basis. Now, if overall
sentiments are to be improved in the market, the banking plays a
vital role here. A small aid from global peers can certainly provide
the much-needed impetus to this space and then we may see it
lifting Nifty higher from its multi-month lows. As far as levels are
concerned, 40000 – 39700 is likely to be seen as sacrosanct zone;
whereas on the flipside, a move beyond 40400 may result in
breaking the shackles to then march towards 40800 – 41000 levels.
Key Levels
Support 1 – 40000 Resistance 1 – 40400
Support 2 – 39700 Resistance 2 – 40800
Exhibit 1: Nifty Daily Chart
Exhibit 2: Nifty Bank Daily Chart
Sensex (
5
8962
) / Nifty (
1
7
3
04
)
Our market started on a flat note tracking the positive global cues
and inched higher at the opening bell. But soon after, a sell-off got
triggered that gradually dragged the index below Monday’s low,
signifying the strength of the bears at higher grounds. With the
intense day of sell-off, Nifty continued the selling streak for the
eighth day in a row and settled a tad above the 17300 level with
another cut of 0.51 percent.
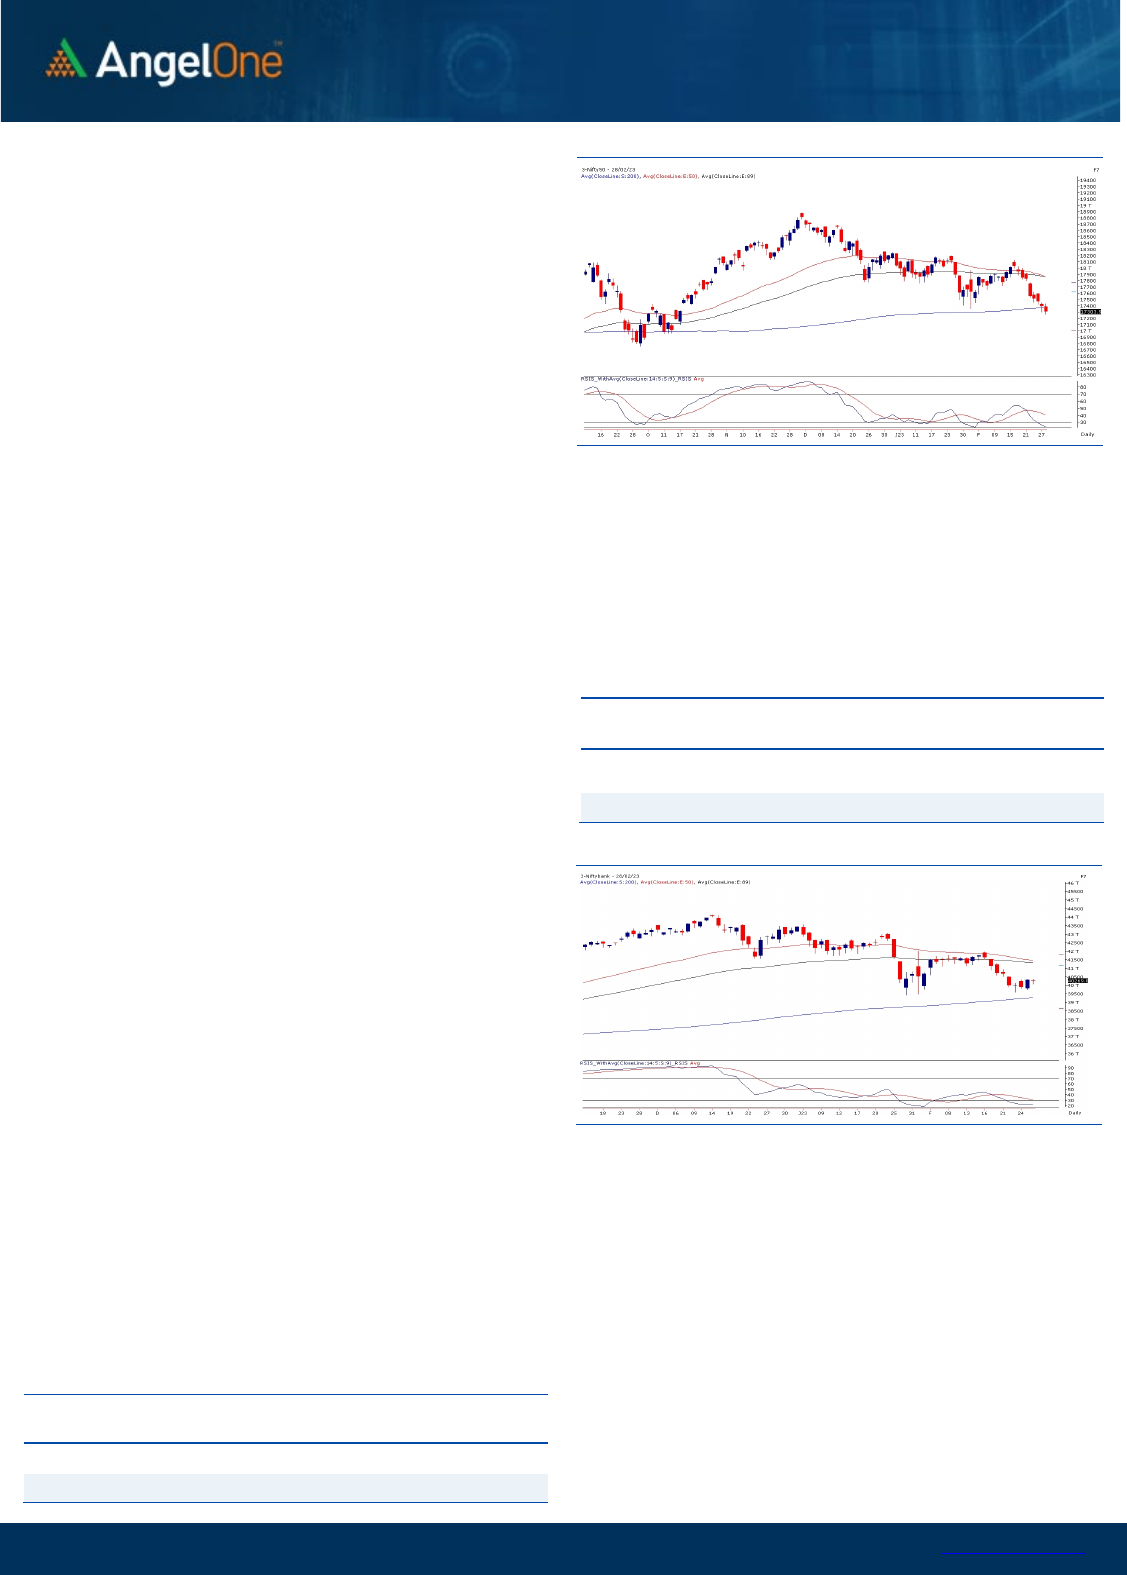
Technically speaking, the benchmark index kept flirting around the
200 SMA throughout the session but eventually settled tad below
the same. Price-wise it does not augur well for the bulls; but we are
still a bit skeptical and do not want to get carried away by the close.
The main reason behind this is a ‘Positive Divergence’ in the daily
‘RSI-Smoothened’ oscillator. When such condition takes place, we
may see deception in price breakdown. Also, the banking space is
showing some resilience and till the time, banking does not give up,
the hope of recovery remains intact. Hence, we advise traders avoid
shorting and let us see whether follow through selling happens or
not. As far as levels are concerned, 17200 is to be seen as immediate
support; whereas on the flipside, 17400 followed by 17500 is the
crucial hurdle for the benchmark index.
As we advance, one needs to keep close track of the
heavyweight’s performance as they have contributed to the sell-
off. Besides this, global development should also be tracked
closely, and in the meantime, we would advocate traders to
avoid aggressive bets and focus on stock-specific actions.
Simultaneously, Investors can start picking good-quality
propositions in a staggered manner from a short to medium-
term perspective.
Key Levels
Support 1 – 17200 Resistance 1 – 17400
Support 2 – 17100 Resistance 2 – 17500

www.angelone.in
Technical & Derivatives Report
March 01, 2023
View
On Tuesday, market had a flat start but as we
progressed market attracted selling to gradually drag
index lower towards 17250. In the final hour, some
recovery was seen to end the day tad above 17300.
FIIs were net sellers in the cash market segment to
the tune of Rs. 4559 crores. Simultaneously, in Index
futures, they sold worth Rs. 1358 crores with some
rise in open interest, indicating short formation.
Yesterday, we witnessed follow-up selling with was
supported by shorts in both the key indices. Stronger
hands continue selling streak not only in equities but
also in index futures segment. Their index futures
Long Short Ratio stands at 15% which clearly hints
they are oversold. In options front, we saw fresh
build-up in 17300-17600 call options and considering
the high implied volatility than the puts it clearly
suggest these are long positions. On the other side,
17300 put witnessed fresh writing. For coming
session, any sustainable recovery is the key
especially above 17400 odd zone. On the downside,
support has been shifted lower to 17000-17100.
Comments
The Nifty futures open interest has increased by 5.46%
and Bank Nifty futures open interest has increased by
6.60% as the market closed at 17303.95.
The Nifty March future closed with a premium of 99.45
point against a premium of 105.25 point in the last
trading session. The April series closed at a premium of
200.35 point.
The INDIA VIX increased from 13.87 to 14.02. At the
same time, the PCR-OI of Nifty has decreased from 0.72
to 0.67.
Few of the liquid counters where we have seen high
cost of carry are COALINDIA, AARTIIND, CUB,
RAMCOCEM and CANBK.
Historical Volatility
SCRIP HV
CIPLA 28.92
ADANIENT 91.14
VEDL 51.36
BERGEPAINT 30.03
ZEEL 54.12
Nifty Vs OI
17400
17500
17600
17700
17800
17900
18000
18100
18200
4,000
6,000
8,000
10,000
12,000
14,000
16,000
2/8 2/10 2/14 2/16 2/20 2/23 2/27
Openinterest Nifty
OI Gainers
SCRIP OI
OI
CHG. (%)
PRICE
PRICE
CHG. (%)
CIPLA 11406850 22.07 906.40 -4.51
VEDL 39446000 20.29 268.35 -6.57
ESCORTS 1386550 12.54 2075.25 2.19
HCLTECH 14574000 10.03 1077.60 -0.41
POLYCAB 879300 9.45 3081.30 1.36
COALINDIA 42067200 9.23 215.40 -1.49
GUJGASLTD 3835000 8.91 504.90 0.29
LTIM 1268850 8.42 4722.10 -1.02
OI Losers
SCRIP OI
OI
CHG. (%)
PRICE
PRICE
CHG. (%)
ADANIENT 12897000 -12.45 1363.85 14.47
POWERGRID 27704700 -11.79 222.25 1.39
CUB 12025000 -6.42 138.45 2.17
MCX 937200 -5.45 1402.65 1.67
ALKEM 456200 -4.64 3175.00 -2.98
RECLTD 42832000 -4.48 114.30 1.77
DELTACORP 18155200 -4.18 187.80 2.98
TATACOMM 2182500 -3.81 1208.55 1.80
Put-Call Ratio
SCRIP PCR (OI) PCR (VOL)
NIFTY 0.67 0.89
BANKNIFTY 0.86 1.01
RELIANCE 0.61 0.47
ICICIBANK 0.74 0.48
INFY 0.54 0.44
www.angelone.in
Technical & Derivatives Report
March 01, 2023
Note: Above mentioned Bullish or Bearish Spreads in Nifty (March Series) are given as an information and not as a recommendation.
Nifty Spot =
1
7
3
04
0900
Lot Size = 75
FII Statistics for
February
2
8
, 202
3
Detail Buy
Contracts
Open
Interest
Value
(in Cr.)
Sell
Net
CHANGE
INDEX
FUTURES
3401.83
4759.80
(1357.97) 189163
17025.40
5.95
INDEX
OPTIONS
1578263.91
1573817.98
4445.93
2624364
237561.44
4.91
STOCK
FUTURES
13185.65
12116.92
1068.73
2174044
141350.08
(0.34)
STOCK
OPTIONS
8185.01
8340.15
(155.14) 100725
6520.49
18.35
Total 1603036.40
1599034.85
4001.55
5088296
402457.41
2.86
Turnover
on
February
2
8
, 202
3
Instrumen
t
No. of
Contracts
Turnover
( in Cr. )
Change
(%)
Index Futures
319992
29627.05 -15.96
Index Options
2667799
26
52727.61 -2.77
Stock Futures
885216
53125.89 20.70
Stock Options
2681953
3899.96 37.11
Total
2,681,95
3
3899.96 2.23
Bull-Call Spreads
Action Strike Price Risk Reward BEP
Buy
17300 295.40
59.20
40.80
17359.20
Sell
17400 236.20
Buy
17300 295.40
111.90
88.10
17411.90
Sell
17500 183.50
Buy
17400 236.20
52.70 47.30 17452.70
Sell
17500 183.50
Bear-Put Spreads
Action Strike Price Risk Reward BEP
Buy
17300 193.70
34.35
65.65
17265.65
Sell 17200 159.35
Buy 17300 193.70
65.10
134.90
17234.90
Sell
17100 128.60
Buy
17200 159.35
30.75 69.25 17169.25
Sell 17100 128.60
Nifty Put-Call Analysis
,0
500,000
1000,000
1500,000
2000,000
2500,000
3000,000
3500,000
4000,000
4500,000
5000,000
17000 17100 17200 17300 17400 17500 17600 17700 17800 17900 18000 18100 18200 18300
Call Put

www.angelone.in
Technical & Derivatives Report
March 01, 2023
`
Daily
Pivot Levels for Nifty Constituents
Scrips
S2
S1
PIVOT
R1
R2
ADANIENT 994 1,179
1,289
1,473
1,583
ADANIPORTS 524 558
586
621
649
APOLLOHOSP
4,300
4,351
4,412
4,463
4,524
ASIANPAINT
2,687
2,758
2,798
2,869
2,910
AXISBANK 830 837
847
854
865
BAJAJ-AUTO
3,559
3,610
3,677
3,728
3,794
BAJFINANCE
5,993
6,053
6,150
6,209
6,306
BAJAJFINSV
1,304
1,319
1,346
1,361
1,388
BPCL 310 314
318
321
325
BHARTIARTL 729 736
746
753
764
BRITANNIA
4,344
4,403
4,439
4,498
4,534
CIPLA 876 891
918
934
961
COALINDIA 210 213
215
218
220
DIVISLAB
2,776
2,801
2,842
2,867
2,908
DRREDDY
4,213
4,265
4,352
4,404
4,491
EICHERMOT
3,036
3,071
3,126
3,161
3,216
GRASIM
1,547
1,563
1,574
1,589
1,600
HCLTECH
1,052
1,065
1,081
1,094
1,110
HDFCBANK
1,581
1,590
1,598
1,607
1,614
HDFCLIFE
481
485
488
492
496
HDFC
2,535
2,572
2,597
2,634
2,659
HEROMOTOCO
2,372
2,396
2,434
2,457
2,495
HINDALCO 388 394
404
409
420
HINDUNILVR
2,418
2,439
2,457
2,478
2,496
ICICIBANK 846 851
854
859
862
INDUSINDBK
1,057
1,067
1,079
1,089
1,100
INFY
1,455
1,471
1,498
1,514
1,540
ITC 369 373
379
382
388
JSW STEEL 653 660
672
679
691
KOTAKBANK
1,711
1,720
1,731
1,740
1,751
LT
2,058
2,083
2,111
2,137
2,164
M&M
1,241
1,255
1,274
1,289
1,308
MARUTI
8,543
8,583
8,646
8,687
8,750
NESTLEIND
18,354
18,512
18,618
18,777
18,883
NTPC 168 169
171
172
174
ONGC 149 150
153
155
157
POWERGRID 217 220
221
224
226
RELIANCE
2,281
2,302
2,334
2,355
2,388
SBILIFE
1,096
1,108
1,122
1,134
1,148
SBIN 517 520
524
527
532
SUNPHARMA 940 948
962
970
984
TCS
3,243
3,278
3,335
3,370
3,427
TATACONSUM
701 708
713
720
725
TATAMOTORS 416 418
422
424
427
TATASTEEL 101 103
105
106
108
TECHM
1,072
1,086
1,111
1,125
1,150
TITAN
2,326
2,349
2,387
2,411
2,449
ULTRACEMCO
7,114
7,188
7,236
7,309
7,358
UPL 682 688
699
705
717
WIPRO 381 384
389
392
396

www.angelone.in
Technical & Derivatives Report
March 01, 2023
*
Technical and Derivatives Team:
Sameet Chavan Chief Analyst – Technical & Derivatives sameet.chavan@angelone.in
Sneha Seth Senior Analyst – Technical & Derivatives sneha.seth@angelone.in
Rajesh Bhosale Technical Analyst rajesh.bhosle@angelone.in
Osho Krishan Senior Analyst – Technical & Derivatives osho.krishan@angelone.in
Research Team Tel: 022 – 39357600 Website: www.angelone.in
For Technical Queries E-mail: technicalresearch-cso@angelone.in
For Derivatives Queries E-mail: derivatives.desk@angelone.in
DISCLAIMER
Angel One Limited (hereinafter referred to as “Angel”) is a registered Member of National Stock Exchange of India Limited, Bombay Stock Exchange
Limited and Metropolitan Stock Exchange Limited. It is also registered as a Depository Participant with CDSL and Portfolio Manager and investment
advisor with SEBI. It also has registration with AMFI as a Mutual Fund Distributor. Angel One Limited is a registered entity with SEBI for Research
Analyst in terms of SEBI (Research Analyst) Regulations, 2014 vide registration number INH000000164. Angel or its associates has not been
debarred/ suspended by SEBI or any other regulatory authority for accessing /dealing in securities Market.
This document is solely for the personal information of the recipient, and must not be singularly used as the basis of any investment decision.
Nothing in this document should be construed as investment or financial advice. Each recipient of this document should make such investigations
as they deem necessary to arrive at an independent evaluation of an investment in the securities of the companies referred to in this document
(including the merits and risks involved), and should consult their own advisors to determine the merits and risks of such an investment.
Angel or its associates or research analyst or his relative may have actual/beneficial ownership of 1% or more in the securities of the subject
company at the end of the month immediately preceding the date of publication of the research report. Neither Angel or its associates nor
Research Analysts or his relative has any material conflict of interest at the time of publication of research report.
Angel or its associates might have received any compensation from the companies mentioned in the report during the period preceding twelve
months from the date of this report for services in respect of managing or co-managing public offerings, corporate finance, investment banking or
merchant banking, brokerage services or other advisory service in a merger or specific transaction in the normal course of business. Angel or its
associates did not receive any compensation or other benefits from the companies mentioned in the report or third party in connection with the
research report. Neither Angel nor its research analyst entity has been engaged in market making activity for the subject company.
Reports based on technical and derivative analysis center on studying charts of a stock's price movement, outstanding positions and trading
volume, as opposed to focusing on a company's fundamentals and, as such, may not match with a report on a company's fundamentals. Investors
are advised to refer the Fundamental and Technical Research Reports available on our website to evaluate the contrary view, if any.
The information in this document has been printed on the basis of publicly available information, internal data and other reliable sources believed
to be true, but we do not represent that it is accurate or complete and it should not be relied on as such, as this document is for general guidance
only. Angel One Limited or any of its affiliates/ group companies shall not be in any way responsible for any loss or damage that may arise to any
person from any inadvertent error in the information contained in this report. Angel One Limited has not independently verified all the information
contained within this document. Accordingly, we cannot testify, nor make any representation or warranty, express or implied, to the accuracy,
contents or data contained within this document. While Angel One Limited endeavors to update on a reasonable basis the information discussed
in this material, there may be regulatory, compliance, or other reasons that prevent us from doing so.
This document is being supplied to you solely for your information, and its contents, information or data may not be reproduced, redistributed or
passed on, directly or indirectly.
Neither Angel One Limited, nor its directors, employees or affiliates shall be liable for any loss or damage that may arise from or in connection
with the use of this information. Angel or its associates or Research Analyst or his relative might have financial interest in the subject company.
Research analyst has not served as an officer, director or employee of the subject company.
