Technical & Derivatives Report
February 10, 2017
Sensex (28330) / Nifty (8778)
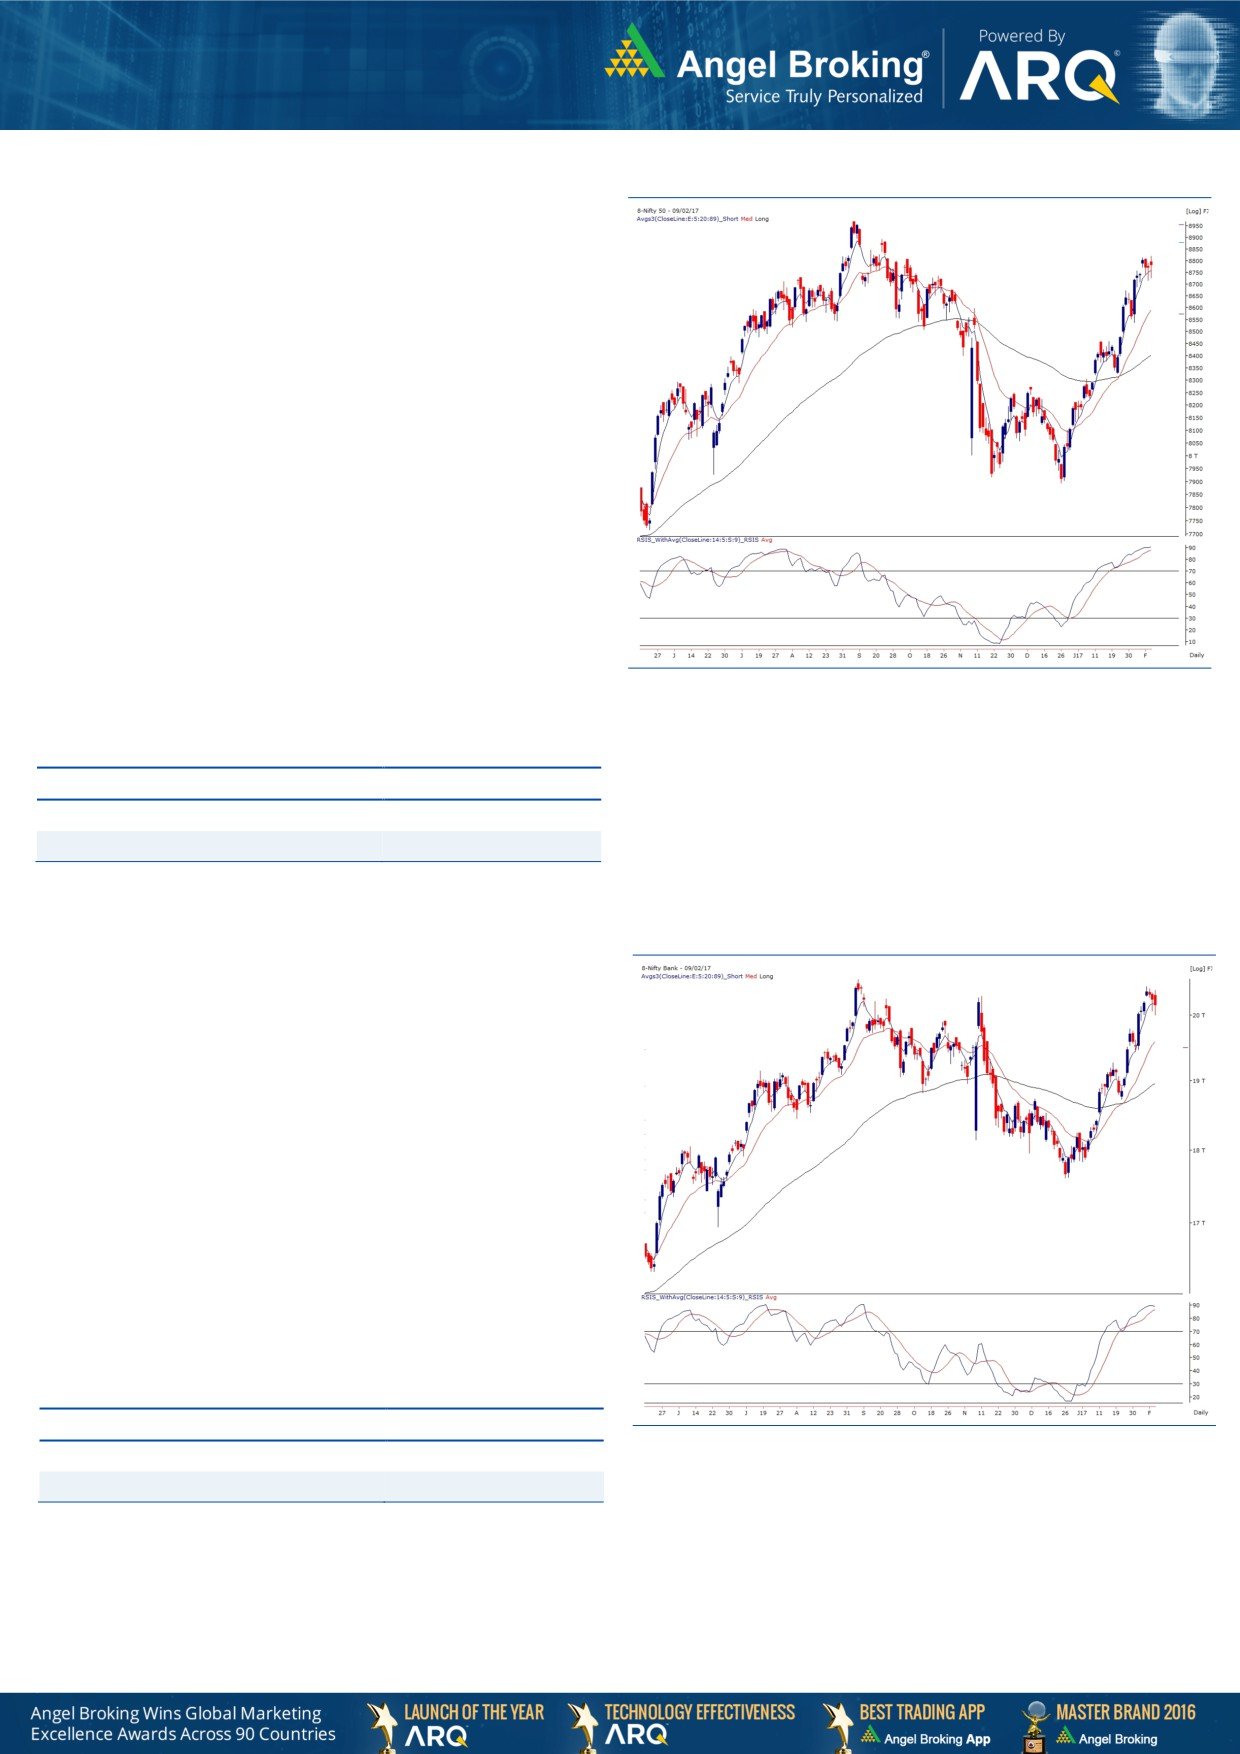
Exhibit 1: Nifty Daily Chart
The consolidation continues in our market as we almost witnessed
a replica of Wednesday’s session. The benchmark index opened
tad higher and then corrected sharply to test the previous day’s
low. However, once again a modest recovery in the latter half
pulled the index higher to close on a flat note with very nominal
gains.
Market is repeatedly proving its strength as we have seen a
complete reluctance of getting corrected on a sustainable basis.
All intraday dips are getting bought into, which is a sign of a
strong trend and we have been consistently advising the same.
Going forward, 8820 remains to be an immediate hurdle and
surpassing this point would extend the rally towards the next
milestone of 8900. On the downside, 8707 - 8685 has now
earned tremendous respect from the bears. Despite a small dip,
we would interpret this as a part of a consolidation phase and
hence, traders should keep following stock centric approach with
a positive bias in order to fetch good returns.
Key Levels
Support 1 - 8707
Resistance 1 - 8820
Support 2 - 8685
Resistance 2 - 8900
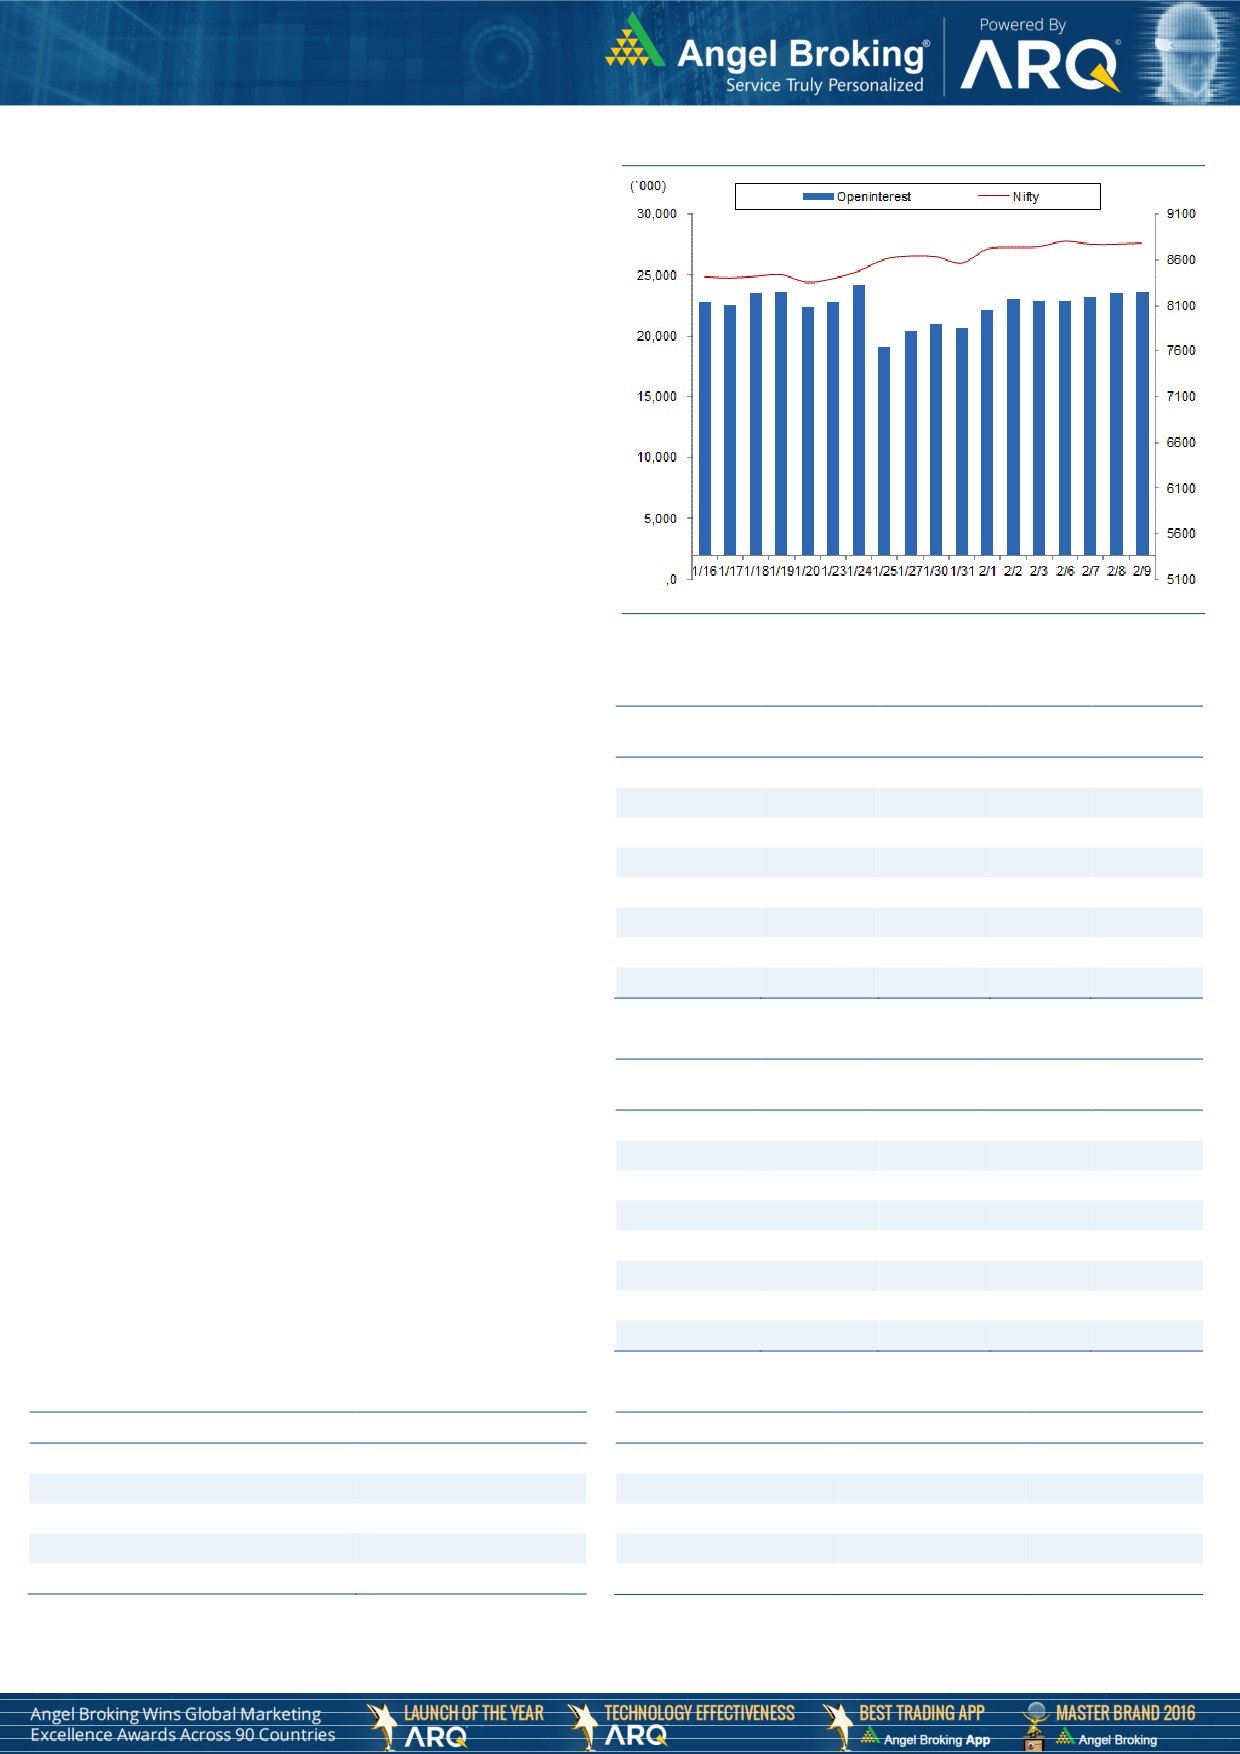
Nifty Bank Outlook - (20151)
Exhibit 2: Nifty Bank Daily Chart
Although the Nifty Bank index opened marginally positive, the
index and its constituents witnessed some profit booking which led
to a marginal correction of 0.47 percent yesterday.
In last four trading sessions, the index has consolidated in a
range. Since there are no signs of trend reversal, we would
interpret this move to be a breather within an uptrend, Hence, the
broader trend for the index continues to be up and such corrective
declines should be used as buying opportunities. Traders should
hence focus on buying specific stocks which have shown
outperformance during the recent up move and are now showing
corrective move. The intraday supports for the Nifty Bank index is
placed in the range of 19915-19848 whereas resistances are
seen around 20330 and 20410.
Key Levels
Support 1 - 19915
Resistance 1 - 20330
Support 2 - 19848
Resistance 2 - 20410
Technical & Derivatives Report
February 10, 2017
Comments
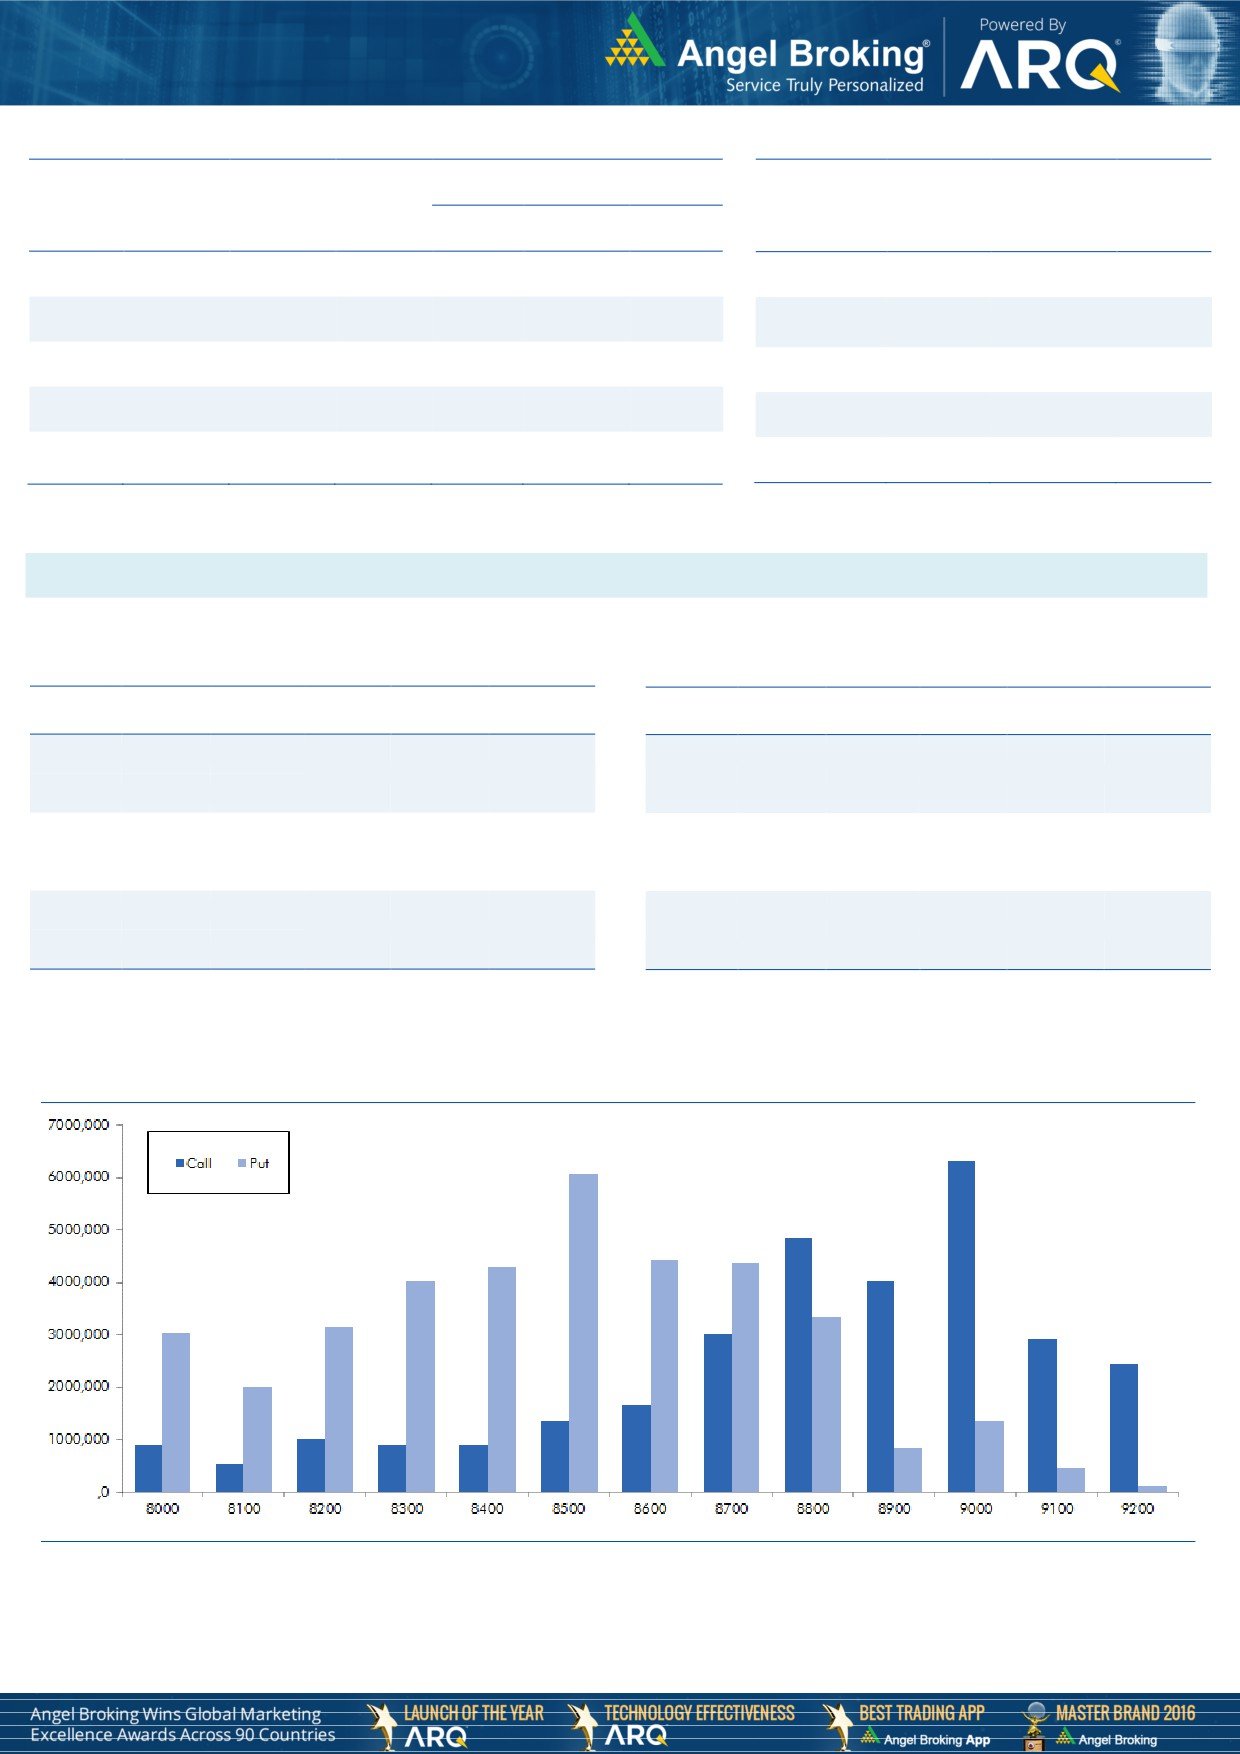
Nifty Vs OI
The Nifty futures open interest has increased by 0.67%
BankNifty futures open interest has decreased by 6.65%
as market closed at 8778.40 levels.
The Nifty February future closed with a premium of
18.45 points against the premium of 27.30 points in last
trading session. The March series closed at a premium of
50.00 points.
The Implied Volatility of at the money options has
decreased from 11.37% to 10.92%. At the same time,
the PCR-OI of Nifty has increased from 1.11 to 1.12
levels.
The total OI of the market is Rs. 3,26,616/- cr. and the
stock futures OI is Rs. 88,591/- cr.
Few of the liquid counters where we have seen high
cost of carry are JPASSOCIAT, IBREALEST, RCOM,
VOLTAS and ADANIPOWER.
OI Gainers
Views
OI
PRICE
SCRIP
OI
PRICE
CHG. (%)
CHG. (%)
Yesterday, FIIs were net buyer in both cash market and
UNIONBANK
33584000
44.48
147.95
-10.01
index future segment. They bought equities worth Rs. 357
PAGEIND
51500
25.92
14233.85
-2.17
crores. While, they were buyer in index futures to the tune
BEML
2316600
19.98
1336.75
4.39
of Rs. 600 crores with rise in open interest, indicating
TORNTPHARM
565200
19.04
1252.05
-0.79
long build-up in previous trading session.
BANKINDIA
28572000
15.25
136.90
3.17
In index options segment, FIIs were buyer worth Rs. 1373
LUPIN
7196000
11.48
1497.25
0.27
crores with marginal rise in open interest. In call options,
IGL
2063600
11.27
1031.25
1.38
8800 strike added fresh positions; followed by unwinding
in 8900 strike. On the other hand, in put options, OI
PIDILITIND
1307000
9.56
666.15
-1.09
addition was visible in 8800 and 8700 strikes. Highest
open interest in current series is placed at 9000 call and
OI Losers
8500 put option.
OI
PRICE
SCRIP
OI
PRICE
After subdued activity for few sessions, FIIs has started
CHG. (%)
CHG. (%)
DCBBANK
2871000
-22.67
138.30
2.33
buying in index future segment from last couple of
INFRATEL
7947200
-11.26
319.35
2.90
sessions. We also witnessed their buying in cash segment
SOUTHBANK
43080000
-10.81
23.00
-0.65
in yesterday’s session. Considering current derivative
data, market seems to be poised for further up move.
SUNTV
7890000
-9.14
735.65
3.85
Thus, we continue to maintain our bullish stance on the
HDIL
29320000
-6.98
69.85
1.38
index. Hence, we advise traders to trade with positive
MCLEODRUSS
3717000
-5.78
171.45
0.56
bias and use declines as a buying opportunity.
SIEMENS
1090500
-5.05
1226.90
0.25
ZEEL
7855900
-4.98
522.70
1.90
Historical Volatility
Put-Call Ratio
SCRIP
HV
SCRIP
PCR-OI
PCR-VOL
UNIONBANK
73.09
NIFTY
1.12
1.08
BHARATFORG
42.77
BANKNIFTY
0.72
0.86
CIPLA
30.08
INFY
0.55
0.44
JUSTDIAL
58.67
SBIN
0.68
0.58
OFSS
37.21
ICICIBANK
0.56
0.54
Technical & Derivatives Report
February 10, 2017
FII Statistics for February 09, 2017
Turnover on February 09, 2017
Open Interest
No. of
Turnover
Change
Detail
Buy
Sell
Net
Instrument
Value
Change
Contracts
( in Cr. )
(%)
Contracts
(in Cr.)
(%)
INDEX
INDEX
2810.59
2210.48
600.11
307933
20949.87
2.75
300358
21814.17
26.36
FUTURES
FUTURES
INDEX
INDEX
72555.04
71181.78
1373.26
1126880
76329.09
0.82
10175835
788948.66
125.70
OPTIONS
OPTIONS
STOCK
7987.50
8152.74
(165.25)
1043168
69632.08
1.26
STOCK
FUTURES
642826
46001.48
11.18
FUTURES
STOCK
STOCK
5276.35
5126.66
149.69
98896
6966.50
7.06
407949
30235.84
16.29
OPTIONS
OPTIONS
TOTAL
88629.48
86671.66
1957.82
2576877
173877.54
1.45
TOTAL
11526968
887000.14
104.29
Nifty Spot = 8778.40
Lot Size = 75
Bull-Call Spreads
Bear-Put Spreads
Action
Strike
Price
Risk
Reward
BEP
Action
Strike
Price
Risk
Reward
BEP
Buy
8800
72.05
Buy
8800
77.55
39.80
60.20
8839.80
35.00
65.00
8765.00
Sell
8900
32.25
Sell
8700
42.55
Buy
8800
72.05
Buy
8800
77.55
59.70
140.30
8859.70
54.70
145.30
8745.30
Sell
9000
12.35
Sell
8600
22.85
Buy
8900
32.25
Buy
8700
42.55
19.90
80.10
8919.90
19.70
80.30
8680.30
Sell
9000
12.35
Sell
8600
22.85
Note: Above mentioned Bullish or Bearish Spreads in Nifty (February Series) are given as an information and not as a recommendation.
Nifty Put-Call Analysis
Technical & Derivatives Report
February 10, 2017
Daily Pivot Levels for Nifty Constituents
Scrips
S2
S1
PIVOT
R1
R2
ACC
1,457
1,471
1,492
1,506
1,526
ADANIPORTS
297
301
305
308
312
AMBUJACEM
232
235
240
243
248
ASIANPAINT
986
994
1,000
1,008
1,014
AUROPHARMA
695
701
707
713
720
AXISBANK
476
481
488
492
499
BAJAJ-AUTO
2,723
2,754
2,782
2,813
2,841
BANKBARODA
177
181
184
188
191
BHEL
150
154
156
160
162
BPCL
718
722
726
730
734
BHARTIARTL
348
352
354
358
361
INFRATEL
303
311
317
325
330
BOSCH
22,215
22,591
22,935
23,311
23,656
CIPLA
567
578
595
605
622
COALINDIA
315
319
322
325
329
DRREDDY
2,992
3,008
3,019
3,034
3,045
EICHERMOT
23,231
23,562
23,831
24,162
24,431
GAIL
481
486
490
495
499
GRASIM
943
959
971
987
999
HCLTECH
794
807
815
827
835
HDFCBANK
1,276
1,287
1,303
1,314
1,331
HDFC
1,366
1,381
1,401
1,417
1,437
HEROMOTOCO
3,177
3,221
3,270
3,314
3,363
HINDALCO
177
180
185
189
194
HINDUNILVR
838
844
850
857
863
ICICIBANK
274
279
284
290
294
IDEA
108
109
110
112
112
INDUSINDBK
1,282
1,293
1,308
1,319
1,334
INFY
931
938
944
952
958
ITC
270
274
276
280
282
KOTAKBANK
757
763
771
778
786
LT
1,458
1,474
1,493
1,509
1,527
LUPIN
1,451
1,471
1,496
1,516
1,540
M&M
1,253
1,273
1,284
1,303
1,314
MARUTI
6,065
6,111
6,158
6,204
6,250
NTPC
163
166
170
172
176
ONGC
190
192
194
195
198
POWERGRID
198
200
203
205
208
RELIANCE
1,024
1,028
1,031
1,036
1,038
SBIN
266
271
276
280
285
SUNPHARMA
644
650
659
665
675
TCS
2,247
2,282
2,305
2,340
2,363
TATAMTRDVR
312
316
320
324
329
TATAMOTORS
500
506
512
519
524
TATAPOWER
80
81
82
83
84
TATASTEEL
446
453
463
470
480
TECHM
470
477
482
490
494
ULTRACEMCO
3,697
3,725
3,743
3,771
3,789
WIPRO
454
460
463
469
473
YESBANK
1,383
1,396
1,408
1,420
1,432
ZEEL
502
512
518
529
535
Technical & Derivatives Report
February 10, 2017
Research Team Tel: 022 - 39357800
For Technical Queries
For Derivatives Queries
DISCLAIMER
Angel Broking Private Limited (hereinafter referred to as “Angel”) is a registered Member of National Stock Exchange of India Limited,
Bombay Stock Exchange Limited and Metropolitan Stock Exchange Limited. It is also registered as a Depository Participant with CDSL
and Portfolio Manager with SEBI. It also has registration with AMFI as a Mutual Fund Distributor. Angel Broking Private Limited is a
registered entity with SEBI for Research Analyst in terms of SEBI (Research Analyst) Regulations, 2014 vide registration number
INH000000164. Angel or its associates has not been debarred/ suspended by SEBI or any other regulatory authority for accessing
/dealing in securities Market. Angel or its associates/analyst has not received any compensation / managed or co-managed public
offering of securities of the company covered by Analyst during the past twelve months.
This document is solely for the personal information of the recipient, and must not be singularly used as the basis of any investment
decision. Nothing in this document should be construed as investment or financial advice. Each recipient of this document should
make such investigations as they deem necessary to arrive at an independent evaluation of an investment in the securities of the
companies referred to in this document (including the merits and risks involved), and should consult their own advisors to determine
the merits and risks of such an investment.
Reports based on technical and derivative analysis center on studying charts of a stock's price movement, outstanding positions and
trading volume, as opposed to focusing on a company's fundamentals and, as such, may not match with a report on a company's
fundamentals. Investors are advised to refer the Fundamental and Technical Research Reports available on our website to evaluate the
contrary view, if any.
The information in this document has been printed on the basis of publicly available information, internal data and other reliable
sources believed to be true, but we do not represent that it is accurate or complete and it should not be relied on as such, as this
document is for general guidance only. Angel Broking Pvt. Limited or any of its affiliates/ group companies shall not be in any way
responsible for any loss or damage that may arise to any person from any inadvertent error in the information contained in this report.
Angel Broking Pvt. Limited has not independently verified all the information contained within this document. Accordingly, we cannot
testify, nor make any representation or warranty, express or implied, to the accuracy, contents or data contained within this document.
While Angel Broking Pvt. Limited endeavors to update on a reasonable basis the information discussed in this material, there may be
regulatory, compliance, or other reasons that prevent us from doing so.
This document is being supplied to you solely for your information, and its contents, information or data may not be reproduced,
redistributed or passed on, directly or indirectly.
Neither Angel Broking Pvt. Limited, nor its directors, employees or affiliates shall be liable for any loss or damage that may arise from
or in connection with the use of this information.