Technical & Derivatives Report
May 26, 2017
Sensex (30750) / Nifty (9510)
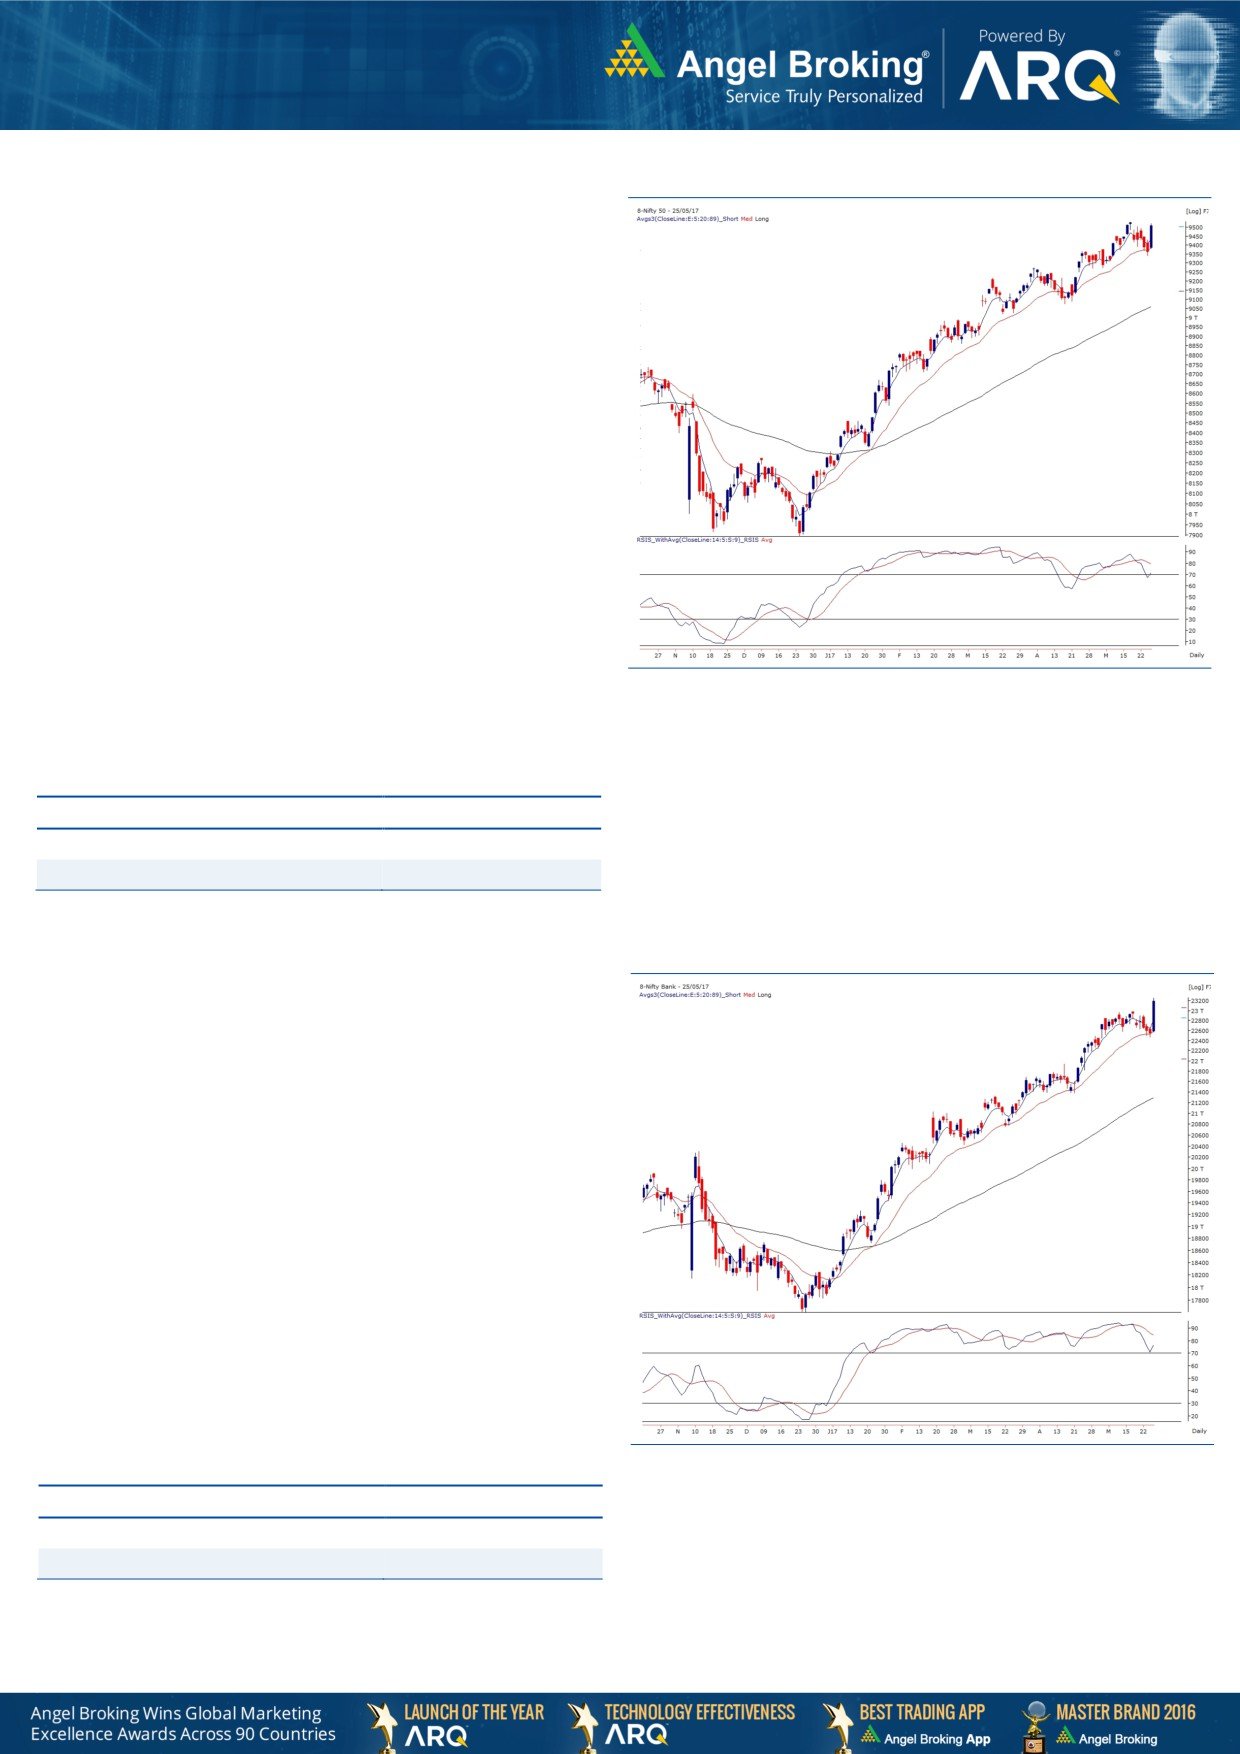
Exhibit 1: Nifty Daily Chart
It was a kind of day that we were looking for since last 2-3 days.
Our markets opened higher and immediately added some gains
in the initial hours. Subsequently, we witnessed some
consolidation in the market; but, the moment Nifty surpassed the
intraday hurdle of 9420, we witnessed a sort of gush in the
market. As a result, the index eventually went on to close this May
(F&O) series on a happy note.
Now, with reference to our recent reports, we remained firm on
our bullish stance on the market despite seeing some correction
below the 9400 mark. In fact, we were quite vocal about the
probable bounce back towards 9500 first and then to achieve the
next milestone of 9600. Due to today’s spectacular move, our first
level has been reached and now a move towards 9600 is just a
matter of time. Traders are advised to stay on the positive side
and use any intraday decline towards 9480 - 9450 to create long
positions in the market. At this juncture, a prudent strategy would
be to concentrate on individual stocks that are likely to fetch
higher returns.
Key Levels
Support 1 - 9480
Resistance 1 - 9550
Support 2 - 9450
Resistance 2 - 9600
Nifty Bank Outlook - (23191)
Exhibit 2: Nifty Bank Daily Chart
The Nifty Bank index rallied sharply higher in yesterday's session
and registered it's all time high to end the day with gains of 2.90
percent.
The bulls came back roaring post the consolidation phase seen in
last few trading sessions. The '20 DEMA', which we have been
referring to as a strong support in this uptrend once again acted
as a savior and the index registered all-time high to mark the
continuation of the uptrend. Analyzing the reciprocal retracements
of the previous corrective move, we expect the index to continue
this upmove till 23500-23550 in next few trading sessions.
Traders are hence advised to trade with positive bias as the stocks
from this sector could outperform the broader markets in near
term. The intraday supports for the Nifty Bank index are placed in
the range of 22978 - 22900 whereas resistances are seen
around 23480 and 23550.
Key Levels
Support 1 - 22978
Resistance 1 - 23480
Support 2 - 22900
Resistance 2 - 23550
Technical & Derivatives Report
May 26, 2017
Comments
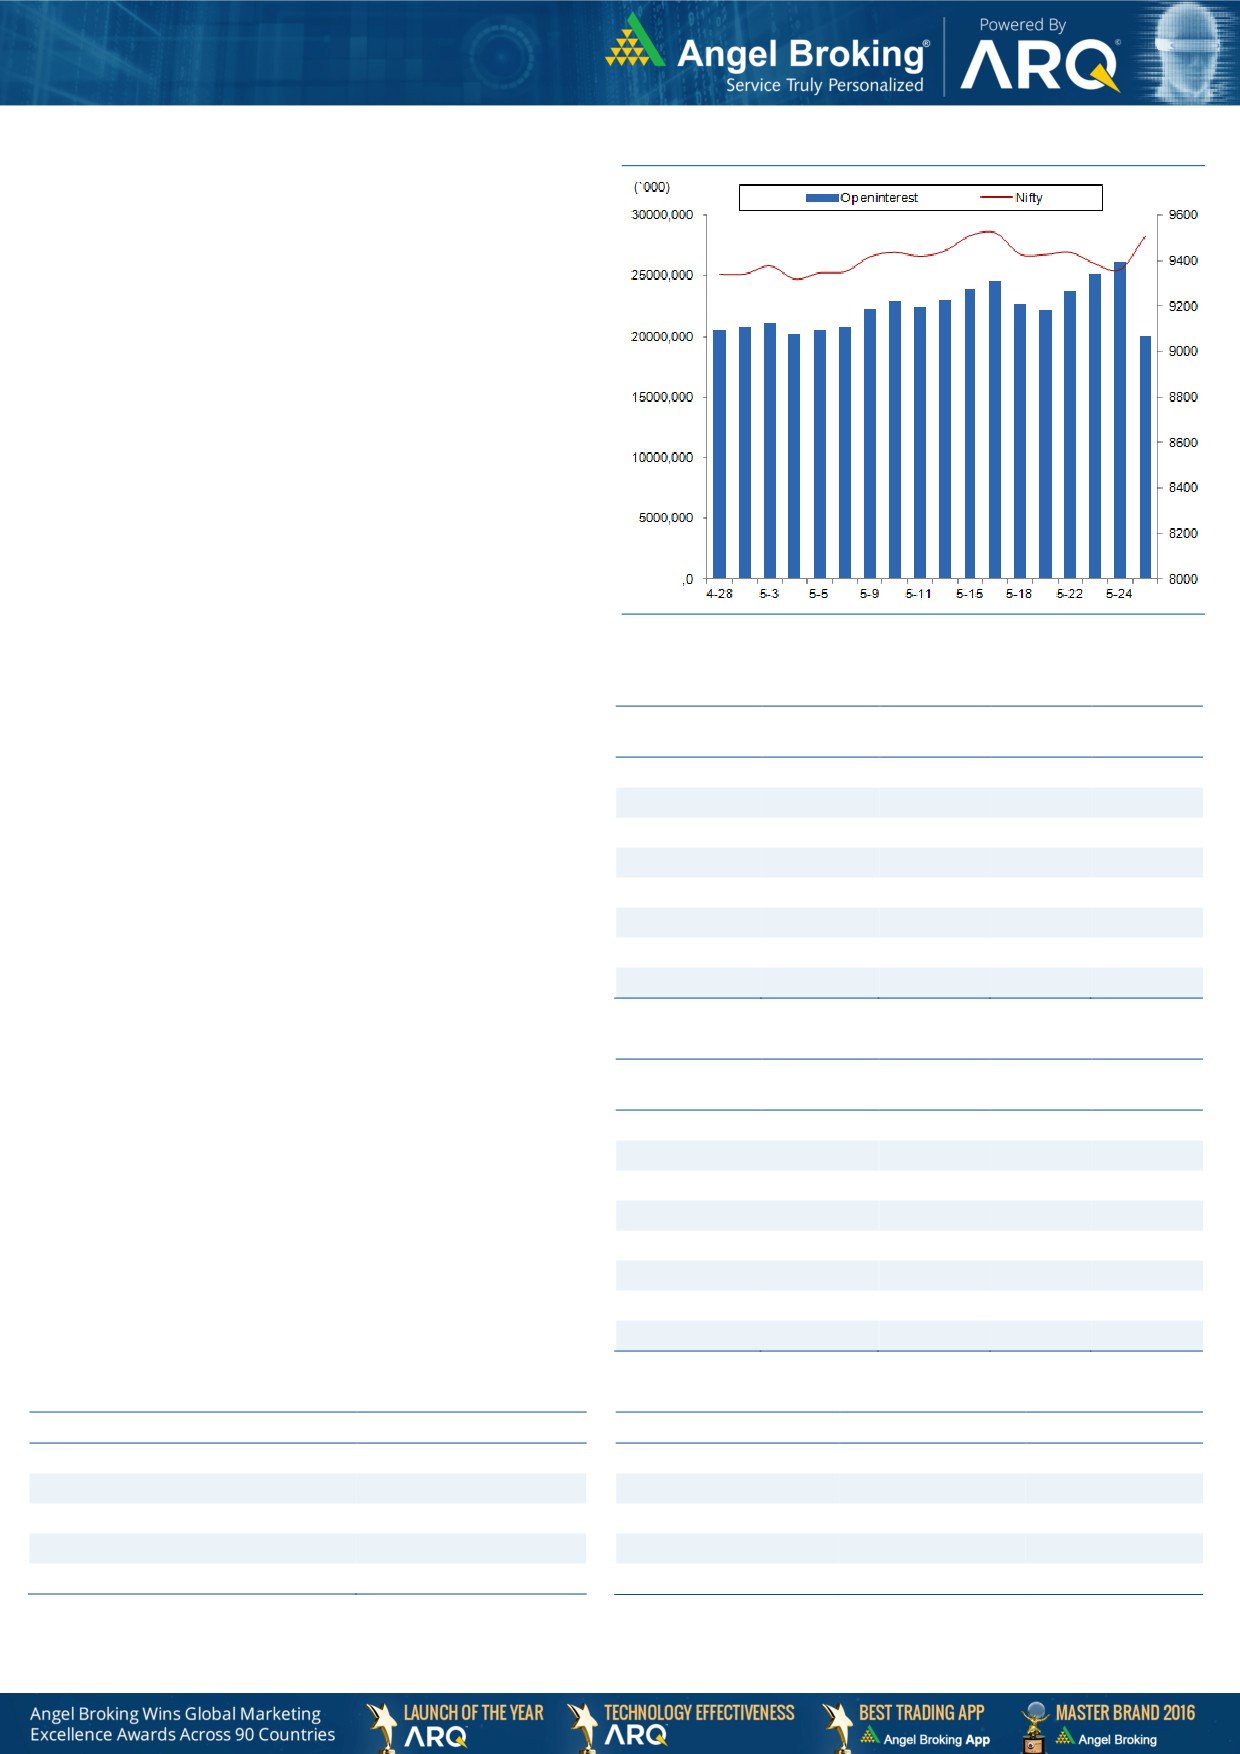
Nifty Vs OI
The Nifty futures open interest has decreased by 23.53%
BankNifty futures open interest has decreased by 20.09%
as market closed at 9509.75 levels.
The Nifty June future closed with a discount of 13.85
points against the premium of 12.60 points in last
trading session. The July series closed at a discount of
0.15 point.
The Implied Volatility of at the money options has
decreased from 12.49% to 8.01%. At the same time, the
PCR-OI of Nifty has decreased from 1.07 to 1.06 levels.
The total OI of the market is Rs. 2,38,057/- cr. and the
stock futures OI is Rs. 90,358/- cr.
Few of the liquid counters where we have seen high cost
of carry are UJJIVAN, BALKRISIND, GMRINFRA,
TV18BRDCST and SOUTHBANK.
Views
FIIs were net buyers in both cash market segment and
OI Gainers
index futures. They bought equities worth Rs. 589 crores;
OI
PRICE
SCRIP
OI
PRICE
while they were net buyer to the tune of Rs. 371 crores in
CHG. (%)
CHG. (%)
JINDALSTEL
38650500
0.69
119.40
7.04
index futures with fall in open interest, due to expiry.
TV18BRDCST
90542000
0.11
35.95
7.47
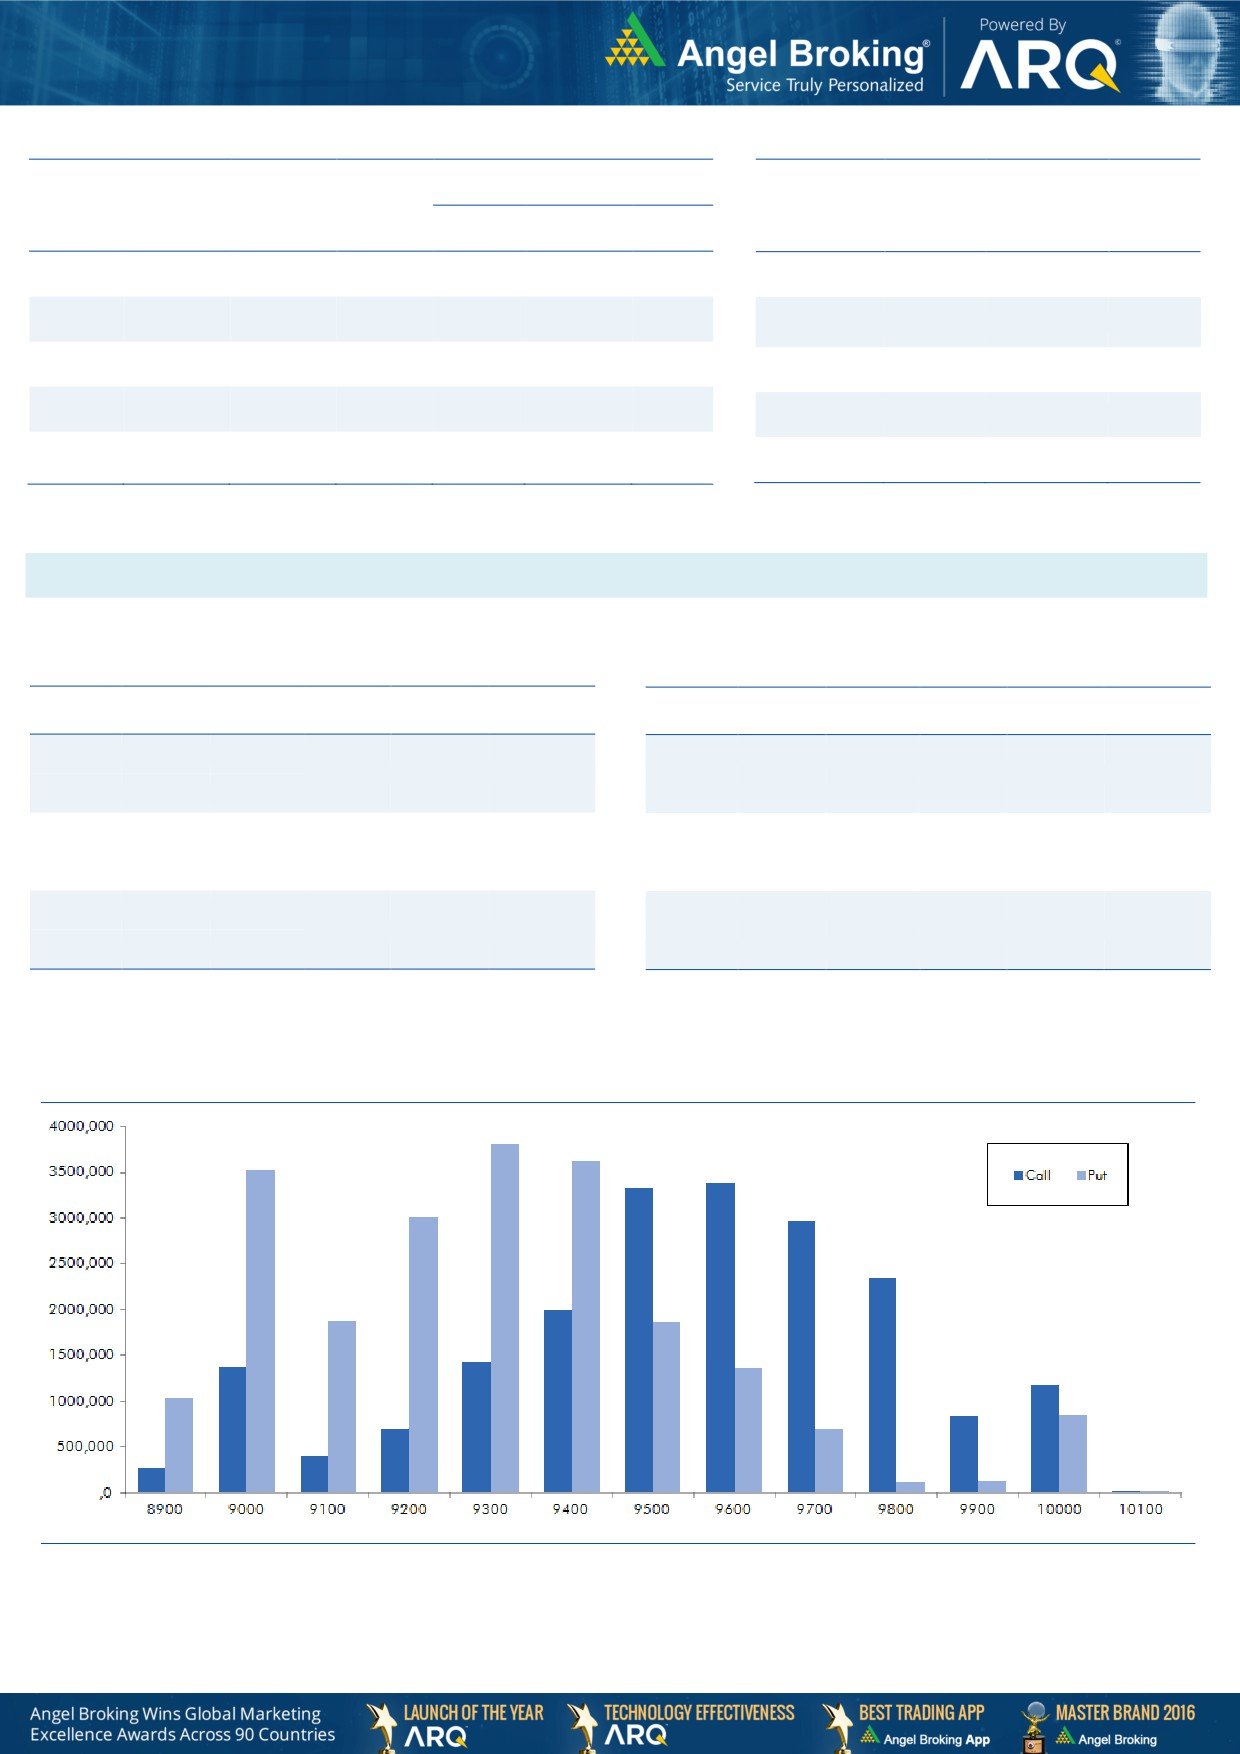
In index options front, they bought of Rs. 2043 crores
with fall in open interest. In Nifty options, 9800 call
-
-
-
-
-
option added huge positions; followed by decent
-
-
-
-
-
build-up in 9500 - 9700 strikes. On the other hand, in
-
-
-
-
-
put options,
9300
-
9500 are attracting trader’s
-
-
-
-
-
attraction and added fresh positions. At current juncture,
-
-
-
-
-
highest open interest in June series is placed at 9600 call
-
-
-
-
-
and 9300 put options.
Rollover in Nifty (74.09%) is higher than its quarterly
OI Losers
average of 69.36%, thus indicating that traders have
OI
PRICE
SCRIP
OI
PRICE
rolled their long positions to the next series. However, the
CHG. (%)
CHG. (%)
rollover in banking index (60.60%) is on lower side as
ITC
34315200
-38.21
298.00
-0.18
compared to its average (68.40). Yesterday, FIIs have
INFIBEAM
1204800
-34.93
973.25
6.69
exited around 55% of their short positions in index future
NHPC
20844000
-34.47
29.50
1.37
and added some fresh longs. As a result, their
LT
7286500
-34.17
1773.35
4.72
‘Long/Short Ratio’ has increased from 65.50% to 81%.
TORNTPHARM
194000
-33.56
1225.30
-1.15
Considering overall rollover activity, we continue to
MRPL
2817000
-32.98
131.00
5.73
maintain our bullish stance on the market and thus,
M&M
2901500
-32.85
1336.25
1.50
would advice traders to trade with a positive bias.
GAIL
9662000
-32.67
402.75
2.72
Historical Volatility
Put-Call Ratio
SCRIP
HV
SCRIP
PCR-OI
PCR-VOL
MINDTREE
39.96
NIFTY
1.06
1.09
DISHTV
66.34
BANKNIFTY
1.00
0.75
LUPIN
46.92
SBIN
0.66
0.38
JPASSOCIAT
134.89
RELIANCE
0.53
0.48
HDFCBANK
20.25
ICICIBANK
0.77
0.61
Technical & Derivatives Report
May 26, 2017
FII Statistics for May 25, 2017
Turnover on May 25, 2017
Open Interest
No. of
Turnover
Change
Detail
Buy
Sell
Net
Instrument
Value
Change
Contracts
( in Cr. )
(%)
Contracts
(in Cr.)
(%)
INDEX
INDEX
8505.83
8134.88
370.95
246257
18202.68
(18.48)
604418
47412.23
41.00
FUTURES
FUTURES
INDEX
INDEX
74677.90
72634.90
2043.00
644484
46631.81
(39.96)
12558724
1018815.21
50.72
OPTIONS
OPTIONS
STOCK
31100.42
30972.60
127.81
1014215
65739.95
(19.71)
STOCK
FUTURES
2143889
143234.32
19.03
FUTURES
STOCK
STOCK
4299.69
4072.57
227.11
1656
97.81
(98.57)
722546
51652.59
-8.05
OPTIONS
OPTIONS
TOTAL
118583.83
115814.96
2768.88
1906612
130672.25
(30.78)
TOTAL
16029577
1261114.37
42.32
Nifty Spot = 9509.75
Lot Size = 75
Bull-Call Spreads
Bear-Put Spreads
Action
Strike
Price
Risk
Reward
BEP
Action
Strike
Price
Risk
Reward
BEP
Buy
9500
102.95
Buy
9500
110.05
46.70
53.30
9546.70
34.95
65.05
9465.05
Sell
9600
56.25
Sell
9400
75.10
Buy
9500
102.95
Buy
9500
110.05
76.25
123.75
9576.25
59.20
140.80
9440.80
Sell
9700
26.70
Sell
9300
50.85
Buy
9600
56.25
Buy
9400
75.10
29.55
70.45
9629.55
24.25
75.75
9375.75
Sell
9700
26.70
Sell
9300
50.85
Note: Above mentioned Bullish or Bearish Spreads in Nifty (June Series) are given as an information and not as a recommendation.
Nifty Put-Call Analysis
Technical & Derivatives Report
May 26, 2017
Daily Pivot Levels for Nifty Constituents
Scrips
S2
S1
PIVOT
R1
R2
ACC
1,546
1,583
1,608
1,645
1,670
ADANIPORTS
324
333
339
348
354
AMBUJACEM
230
235
238
244
247
ASIANPAINT
1,074
1,094
1,109
1,129
1,144
AUROPHARMA
509
517
524
533
540
AXISBANK
490
499
504
513
518
BAJAJ-AUTO
2,733
2,778
2,806
2,851
2,879
BANKBARODA
174
178
180
184
187
BPCL
696
712
722
738
748
BHARTIARTL
354
362
369
378
385
INFRATEL
361
367
372
378
382
BOSCHLTD
22,202
22,882
23,480
24,161
24,759
CIPLA
480
492
508
521
537
COALINDIA
261
263
265
267
268
DRREDDY
2,334
2,381
2,445
2,491
2,555
EICHERMOT
27,018
27,514
27,817
28,313
28,616
GAIL
387
394
399
406
411
GRASIM
1,068
1,083
1,098
1,113
1,128
HCLTECH
845
852
860
867
875
HDFCBANK
1,542
1,580
1,605
1,642
1,667
HDFC
1,523
1,532
1,539
1,547
1,554
HEROMOTOCO
3,481
3,554
3,599
3,672
3,718
HINDALCO
183
187
189
193
196
HINDUNILVR
1,022
1,033
1,041
1,052
1,061
IBULHSGFIN
1,010
1,028
1,050
1,068
1,089
ICICIBANK
301
309
315
323
328
IOC
415
427
435
447
455
INDUSINDBK
1,397
1,429
1,451
1,483
1,505
INFY
951
967
977
993
1,003
ITC
291
295
300
305
309
KOTAKBANK
925
941
952
967
978
LT
1,662
1,716
1,745
1,799
1,828
LUPIN
1,069
1,105
1,142
1,178
1,215
M&M
1,291
1,309
1,322
1,341
1,354
MARUTI
6,763
6,874
6,946
7,057
7,129
NTPC
154
155
156
157
158
ONGC
172
173
174
175
177
POWERGRID
193
196
199
201
204
RELIANCE
1,288
1,295
1,304
1,311
1,320
SBIN
281
285
288
293
296
SUNPHARMA
567
580
594
606
621
TCS
2,541
2,583
2,610
2,652
2,680
TATAMTRDVR
274
278
282
286
289
TATAMOTORS
459
467
473
482
488
TATAPOWER
79
80
81
81
82
TATASTEEL
472
479
483
489
493
TECHM
412
419
423
431
435
ULTRACEMCO
4,103
4,133
4,160
4,190
4,217
WIPRO
521
529
534
542
547
YESBANK
1,416
1,440
1,455
1,479
1,494
ZEEL
498
505
511
518
525
Technical & Derivatives Report
May 26, 2017
Research Team Tel: 022 - 39357800
For Technical Queries
For Derivatives Queries
DISCLAIMER
Angel Broking Private Limited (hereinafter referred to as “Angel”) is a registered Member of National Stock Exchange of India Limited,
Bombay Stock Exchange Limited and Metropolitan Stock Exchange Limited. It is also registered as a Depository Participant with CDSL
and Portfolio Manager with SEBI. It also has registration with AMFI as a Mutual Fund Distributor. Angel Broking Private Limited is a
registered entity with SEBI for Research Analyst in terms of SEBI (Research Analyst) Regulations, 2014 vide registration number
INH000000164. Angel or its associates has not been debarred/ suspended by SEBI or any other regulatory authority for accessing
/dealing in securities Market. Angel or its associates/analyst has not received any compensation / managed or co-managed public
offering of securities of the company covered by *Analyst during the past twelve months.
This document is solely for the personal information of the recipient, and must not be singularly used as the basis of any investment
decision. Nothing in this document should be construed as investment or financial advice. Each recipient of this document should
make such investigations as they deem necessary to arrive at an independent evaluation of an investment in the securities of the
companies referred to in this document (including the merits and risks involved), and should consult their own advisors to determine
the merits and risks of such an investment.
Reports based on technical and derivative analysis center on studying charts of a stock's price movement, outstanding positions and
trading volume, as opposed to focusing on a company's fundamentals and, as such, may not match with a report on a company's
fundamentals. Investors are advised to refer the Fundamental and Technical Research Reports available on our website to evaluate the
contrary view, if any.
The information in this document has been printed on the basis of publicly available information, internal data and other reliable
sources believed to be true, but we do not represent that it is accurate or complete and it should not be relied on as such, as this
document is for general guidance only. Angel Broking Pvt. Limited or any of its affiliates/ group companies shall not be in any way
responsible for any loss or damage that may arise to any person from any inadvertent error in the information contained in this report.
Angel Broking Pvt. Limited has not independently verified all the information contained within this document. Accordingly, we cannot
testify, nor make any representation or warranty, express or implied, to the accuracy, contents or data contained within this document.
While Angel Broking Pvt. Limited endeavors to update on a reasonable basis the information discussed in this material, there may be
regulatory, compliance, or other reasons that prevent us from doing so.
This document is being supplied to you solely for your information, and its contents, information or data may not be reproduced,
redistributed or passed on, directly or indirectly.
Neither Angel Broking Pvt. Limited, nor its directors, employees or affiliates shall be liable for any loss or damage that may arise from
or in connection with the use of this information.