Technical & Derivatives Report
February 15, 2018
Sensex (34156) / Nifty (10501)
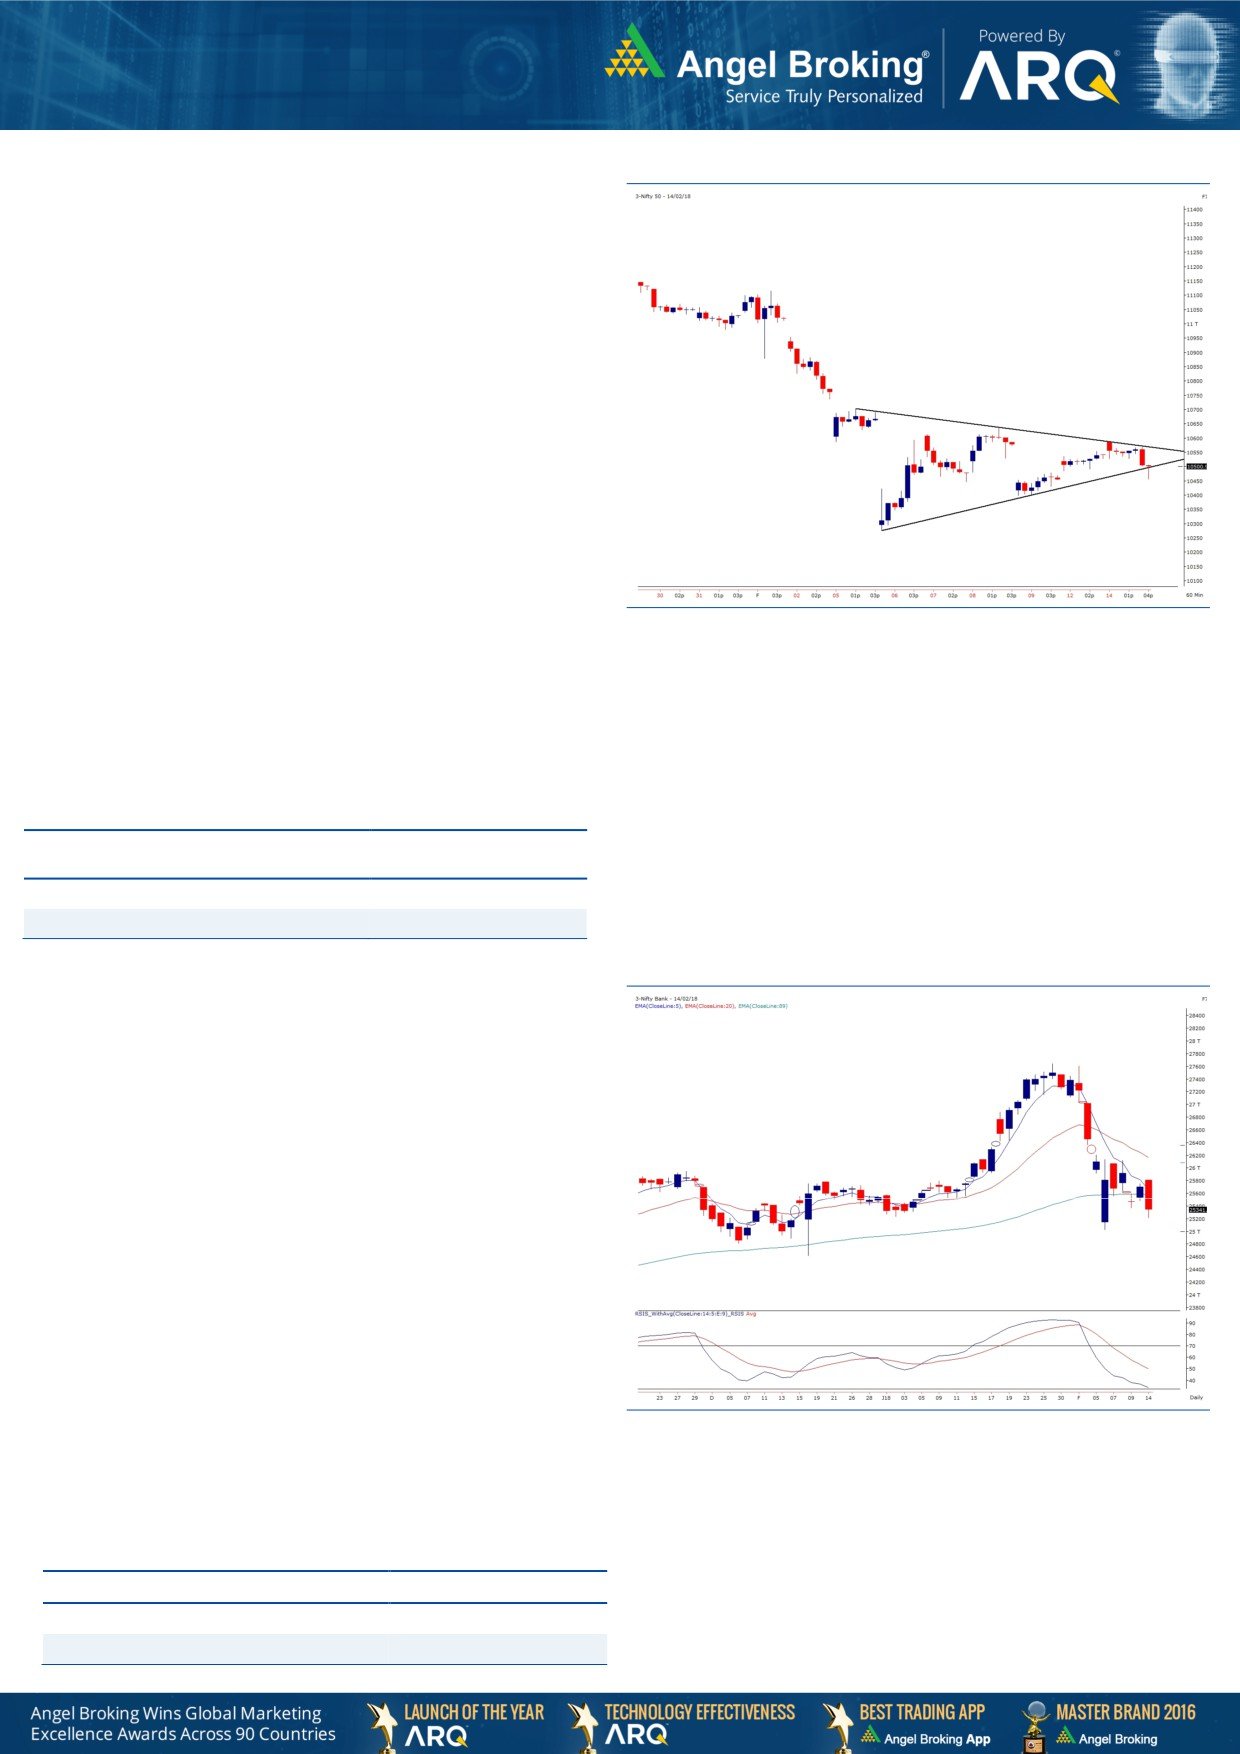
Exhibit 1: Nifty Hourly Chart
Some cooling off in the US markets resulted into a gap up
opening in our benchmarks by a small margin. However, this
early morning lead was very short lived as we witnessed a hint of
profit booking in the early trades. This was followed by a long
consolidation in a narrow range; however, a strong bout of
selling towards the fag end resulted into a nosedive below
the 10500 mark.
In our previous article, we had mentioned a formation of
‘Symmetrical Triangle’ which was visible on hourly chart.
Yesterday’s high precisely coincided with the higher boundary
(10590) of this pattern and a failure to surpass this hurdle
resulted into a sell off. In fact, the index went on to violate the
lower boundary of 10490 in the final trades. Hence, going
ahead, a sustainable move below 10455 would reinforce the
selling pressure in the market. In this scenario, we may see
extension of this corrective move towards 10400 - 10347 levels.
On the flipside, 10527 followed by 10590 would be seen as
immediate resistance levels. The PSU banking space was the
party spoiler yesterday as we saw massive cut in individual names
within this basket. Going ahead, one needs to keep a close eye
on this basket as a follow-through selling may result into further
dampness in the market.
Key Levels
Support 1 - 10455
Resistance 1 - 10527
Support 2 - 10400
Resistance 2 - 10590
Nifty Bank Outlook - (25341)
Exhibit 2: Nifty Bank Daily Chart
Although the Nifty Bank index opened marginally positive
yesterday along with the benchmark indices, the stocks from the
banking sector were in the bear grip right from the word go. The
sell-off accelerated towards the end of the session and the Nifty
Bank index eventually ended the session with a loss of
1.40
percent.
The underperformer PSU Banking space continued to witness
negative news first in form of disappointing quarterly results by
the heavyweight SBI in the weekend gone by, followed by the
news of PNB detecting
$1.77 billion worth of fraudulent
transactions. Also RBI came out with new framework for NPA
resolutions which market participants perceived as a possible
short-term pain for the banks. All this turned up the heat which
led to the sell-off and technically speaking, this indicates a
continuation of the corrective phase which the index has
been undergoing since the start of this month. Going ahead, the
near term support is placed at the recent low of 25024, breach of
which could extend the correction upto its '200 DMA' placed
around 24600. Hence, we advise traders to avoid any bottom
fishing and stay light in this sector. On the flipside, 25800 has
now become a short-term resistance.
Key Levels
Support 1 - 25212
Resistance 1 - 25480
Support 2 - 25024
Resistance 2 - 25620
Technical & Derivatives Report
February 15, 2018
Comments
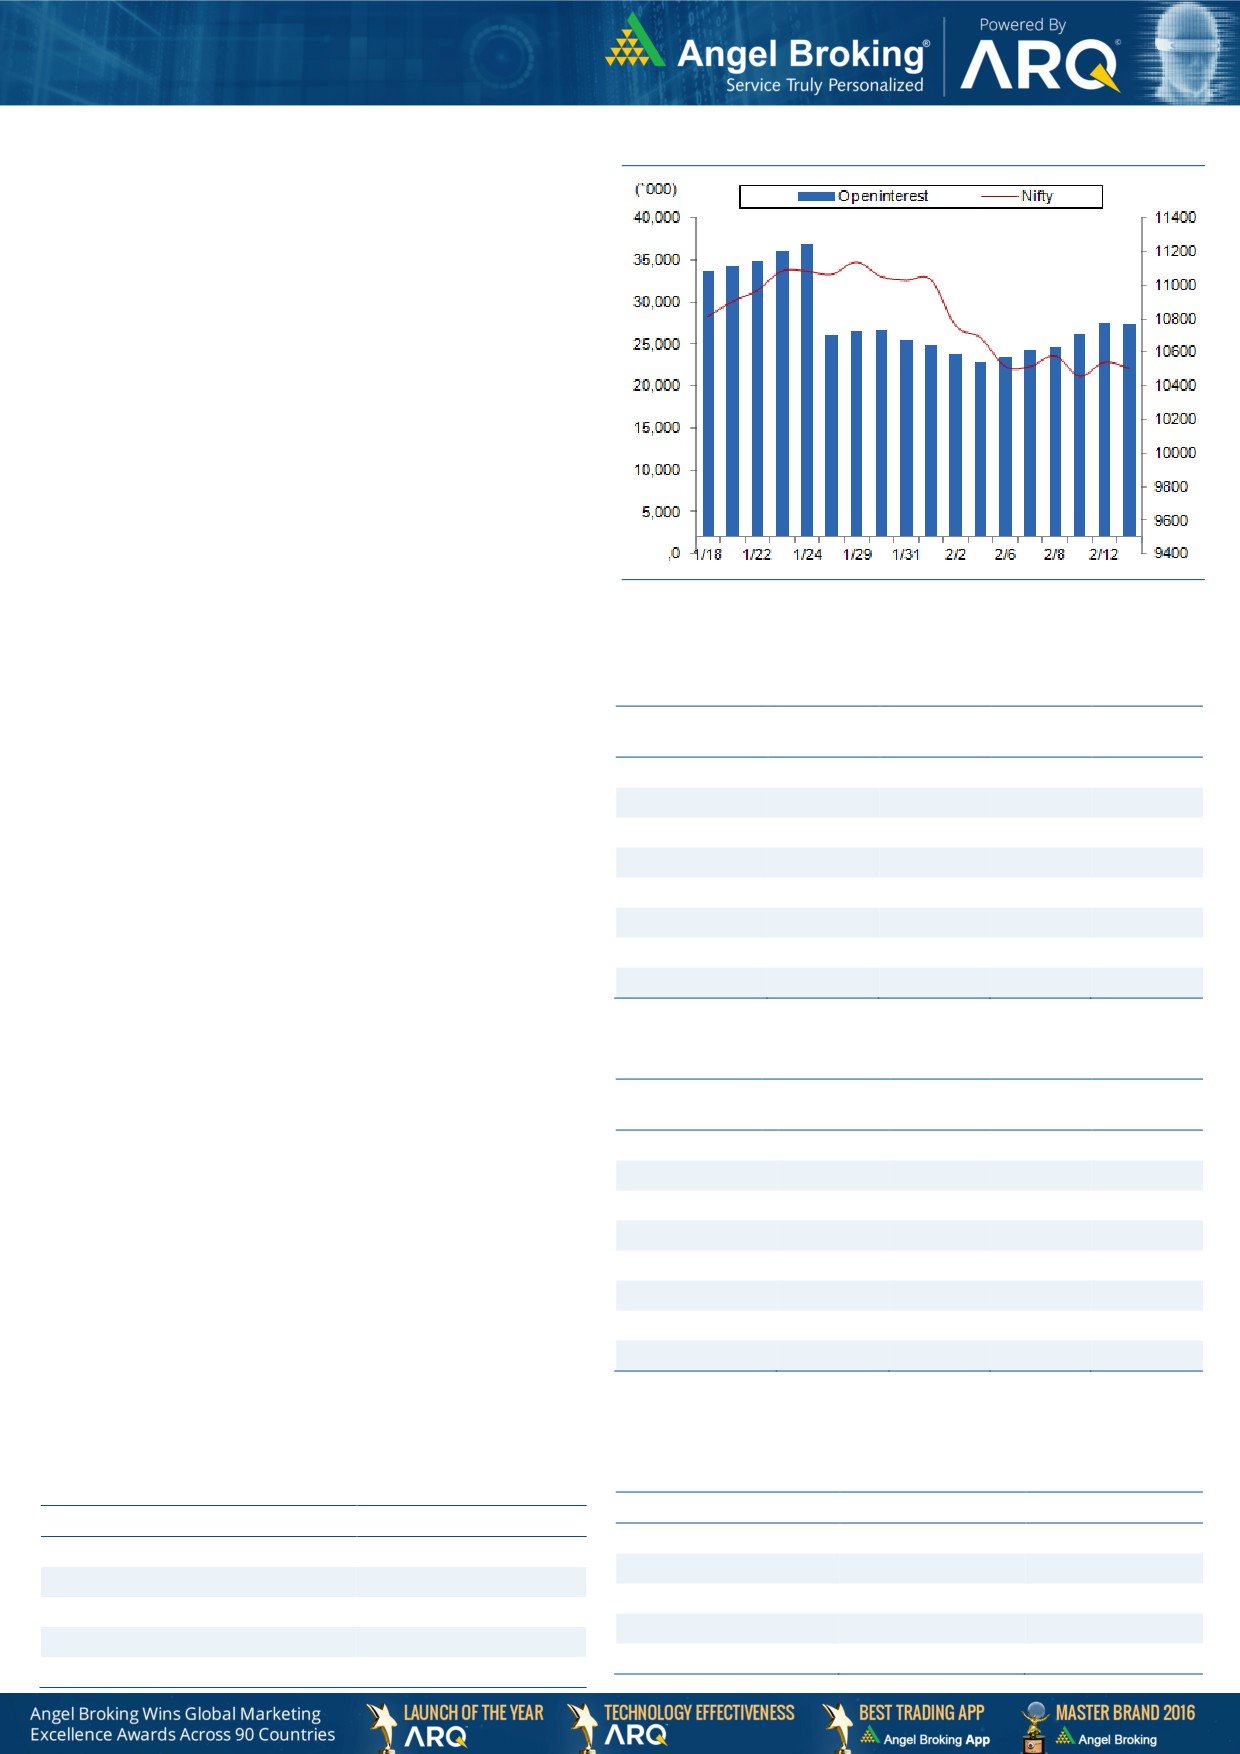
Nifty Vs OI
The Nifty futures open interest has decreased by 0.30%
BankNifty futures open interest has increased by 13.62%
as market closed at 10500.90 levels.
The Nifty February future closed with a discount of 5.70
points against a premium of 3.35 points in last trading
session. The March series closed at a premium of 18.95
points.
The INDIA VIX has decreased from 17.88 to 17.18. At
the same time, the PCR-OI of Nifty has decreased from
1.11 to 1.09 level.
Few of the liquid counters where we have seen high cost
of carry are DISHTV, SAIL, PTC, REPCOHOME and
BEML.
Views
FIIs continued selling in cash market segment to the tune
OI Gainers
of Rs. 729 crores. While, they were net buyers in index
OI
PRICE
futures of Rs. 1039 crores with negligible fall in open
SCRIP
OI
PRICE
CHG. (%)
CHG. (%)
interest, indicating formation of some long positions
PNB
55732000
34.57
146.20
-9.67
along with short covering in last trading session.
BANKINDIA
25548000
28.91
133.00
-8.31
In index options front, they were net buyers of Rs. 1733
ORIENTBANK
21282000
27.50
103.75
-7.94
crores with rise in open interest. In Nifty call options, OI
SBIN
79407000
16.16
276.85
-4.32
build up was seen in 10500-10700 strikes; whereas in
ALBK
22360000
15.44
56.15
-8.10
put options OI build up was seen in 10500 strike along
SYNDIBANK
30195000
13.15
63.05
-4.32
with unwinding seen in 10000-10400 strikes. Now,
NCC
32856000
12.46
126.60
6.79
maximum open interest concentration stood at 11100
KAJARIACER
1506400
11.82
603.75
-1.09
call and 10500 put options.
In yesterday’s session, FII’s squared off some of their
short positions in index fut. and also formed some fresh
OI Losers
longs. However, they have also bought put options in
OI
PRICE
SCRIP
OI
PRICE
yesterday’s session. Overall, they continue to be net short
CHG. (%)
CHG. (%)
in the index fut. segment and considering their recent
IGL
6014250
-10.48
307.20
1.55
activity, we continue with our cautious stance on the
BATAINDIA
2808300
-6.93
717.75
0.24
market. As expected, the index witnessed selling pressure
MGL
1225200
-6.42
1035.75
1.01
from higher levels in yesterday’s session and hence,
JUSTDIAL
3952200
-6.06
465.85
-1.92
unless we see any meaningful change in data, indices
CEATLTD
1269100
-4.95
1620.00
0.51
are expected to trade with a negative bias.
SIEMENS
838500
-4.77
1275.45
1.33
TORNTPOWER
3924000
-4.53
271.55
0.50
SUNTV
3791000
-4.10
997.85
1.64
Put-Call Ratio
Historical Volatility
SCRIP
PCR-OI
PCR-VOL
SCRIP
HV
NIFTY
1.09
0.88
BANKINDIA
59.28
BANKNIFTY
0.79
0.73
ORIENTBANK
58.00
SBIN
0.42
0.58
ALBK
59.21
RELIANCE
0.47
0.38
PNB
74.22
ITC
0.31
0.23
YESBANK
39.31
Technical & Derivatives Report
February 15, 2018
FII Statistics for February 14, 2018
Turnover on February 14, 2018
Open Interest
No. of
Turnover
Change
Detail
Buy
Sell
Net
Instrument
Value
Change
Contracts
( in Cr. )
(%)
Contracts
(in Cr.)
(%)
INDEX
INDEX
2810.09
1770.68
1039.41
265544
21641.97
(0.13)
234570
20718.25
16.87
FUTURES
FUTURES
INDEX
INDEX
74563.81
72830.69
1733.12
1063988
86198.89
3.11
6204280
581863.98
79.78
OPTIONS
OPTIONS
STOCK
9258.02
9159.95
98.06
1112525
79525.98
1.05
STOCK
FUTURES
792006
58496.55
6.31
FUTURES
STOCK
STOCK
8978.33
8920.75
57.58
116263
8603.46
2.69
638516
49699.87
9.84
OPTIONS
OPTIONS
Total
95610.25
92682.07
2928.17
2558320
195970.30
1.85
TOTAL
7869372
710778.64
60.93
Nifty Spot = 10500.90
Lot Size = 75
Bull-Call Spreads
Bear-Put Spreads
Action
Strike
Price
Risk
Reward
BEP
Action
Strike
Price
Risk
Reward
BEP
Buy
10500
106.80
Buy
10500
110.65
45.35
54.65
10545.35
32.75
67.25
10467.25
Sell
10600
61.45
Sell
10400
77.90
Buy
10500
106.80
Buy
10500
110.65
77.10
122.90
10577.10
59.00
141.00
10441.00
Sell
10700
29.70
Sell
10300
51.65
Buy
10600
61.45
Buy
10400
77.90
31.75
68.25
10631.75
26.25
73.75
10373.75
Sell
10700
29.70
Sell
10300
51.65
Note: Above mentioned Bullish or Bearish Spreads in Nifty (February Series) are given as an information and not as a recommendation.
Nifty Put-Call Analysis
Technical & Derivatives Report
February 15, 2018
Daily Pivot Levels for Nifty Constituents
Scrips
S2
S1
PIVOT
R1
R2
ADANIPORTS
400
406
412
418
423
AMBUJACEM
250
252
255
257
261
ASIANPAINT
1,120
1,129
1,137
1,146
1,154
AUROPHARMA
590
596
605
612
621
AXISBANK
524
534
550
560
576
BAJAJ-AUTO
3,063
3,087
3,123
3,146
3,183
BAJFINANCE
1,627
1,649
1,673
1,694
1,718
BPCL
452
456
463
467
474
BHARTIARTL
421
428
433
440
445
INFRATEL
316
322
331
337
346
BOSCHLTD
19,372
19,443
19,542
19,613
19,712
CIPLA
601
608
619
627
638
COALINDIA
296
301
305
311
315
DRREDDY
2,145
2,164
2,195
2,214
2,245
EICHERMOT
27,534
27,781
27,999
28,246
28,464
GAIL
457
462
468
473
479
HCLTECH
913
925
943
955
972
HDFCBANK
1,862
1,873
1,885
1,896
1,908
HDFC
1,789
1,802
1,817
1,830
1,845
HEROMOTOCO
3,533
3,564
3,594
3,626
3,656
HINDALCO
239
241
244
246
249
HINDPETRO
371
377
386
392
401
HINDUNILVR
1,324
1,337
1,345
1,358
1,366
IBULHSGFIN
1,301
1,324
1,347
1,370
1,393
ICICIBANK
310
315
321
325
331
IOC
372
375
378
381
384
INDUSINDBK
1,664
1,679
1,694
1,710
1,725
INFY
1,075
1,086
1,102
1,113
1,129
ITC
262
264
268
270
273
KOTAKBANK
1,028
1,035
1,044
1,051
1,059
LT
1,333
1,347
1,360
1,374
1,387
LUPIN
811
819
833
842
856
M&M
736
741
748
753
760
MARUTI
8,877
8,939
9,048
9,111
9,220
NTPC
160
162
164
165
167
ONGC
180
183
187
190
195
POWERGRID
191
193
196
198
201
RELIANCE
911
922
932
944
954
SBIN
266
271
280
285
294
SUNPHARMA
559
567
579
587
600
TCS
2,844
2,878
2,926
2,960
3,008
TATAMOTORS
365
371
377
383
388
TATASTEEL
695
702
711
717
727
TECHM
579
595
605
621
631
ULTRACEMCO
4,127
4,151
4,179
4,203
4,231
UPL
709
716
724
731
740
VEDANTA
306
311
317
322
329
WIPRO
286
290
293
297
300
YESBANK
307
314
326
332
345
ZEEL
564
570
578
585
593
Technical & Derivatives Report
February 15, 2018
Research Team Tel: 022 - 39357800
For Technical Queries
For Derivatives Queries
DISCLAIMER
Angel Broking Private Limited (hereinafter referred to as “Angel”) is a registered Member of National Stock Exchange of India Limited,
Bombay Stock Exchange Limited and Metropolitan Stock Exchange Limited. It is also registered as a Depository Participant with CDSL
and Portfolio Manager and Investment Adviser with SEBI. It also has registration with AMFI as a Mutual Fund Distributor. Angel Broking
Private Limited is a registered entity with SEBI for Research Analyst in terms of SEBI (Research Analyst) Regulations, 2014 vide
registration number INH000000164. Angel or its associates has not been debarred/ suspended by SEBI or any other regulatory
authority for accessing /dealing in securities Market. Angel or its associates/analyst has not received any compensation / managed or
co-managed public offering of securities of the c*ompany covered by Analyst during the past twelve months.
This document is solely for the personal information of the recipient, and must not be singularly used as the basis of any investment
decision. Nothing in this document should be construed as investment or financial advice. Each recipient of this document should
make such investigations as they deem necessary to arrive at an independent evaluation of an investment in the securities of the
companies referred to in this document (including the merits and risks involved), and should consult their own advisors to determine
the merits and risks of such an investment.
Reports based on technical and derivative analysis center on studying charts of a stock's price movement, outstanding positions and
trading volume, as opposed to focusing on a company's fundamentals and, as such, may not match with a report on a company's
fundamentals. Investors are advised to refer the Fundamental and Technical Research Reports available on our website to evaluate the
contrary view, if any.
The information in this document has been printed on the basis of publicly available information, internal data and other reliable
sources believed to be true, but we do not represent that it is accurate or complete and it should not be relied on as such, as this
document is for general guidance only. Angel Broking Pvt. Limited or any of its affiliates/ group companies shall not be in any way
responsible for any loss or damage that may arise to any person from any inadvertent error in the information contained in this report.
Angel Broking Pvt. Limited has not independently verified all the information contained within this document. Accordingly, we cannot
testify, nor make any representation or warranty, express or implied, to the accuracy, contents or data contained within this document.
While Angel Broking Pvt. Limited endeavors to update on a reasonable basis the information discussed in this material, there may be
regulatory, compliance, or other reasons that prevent us from doing so.
This document is being supplied to you solely for your information, and its contents, information or data may not be reproduced,
redistributed or passed on, directly or indirectly.
Neither Angel Broking Pvt. Limited, nor its directors, employees or affiliates shall be liable for any loss or damage that may arise from
or in connection with the use of this information.