www.angelbroking.com
Technical & Derivatives Report
January 08, 2020
Sensex (40869) / Nifty (12053)
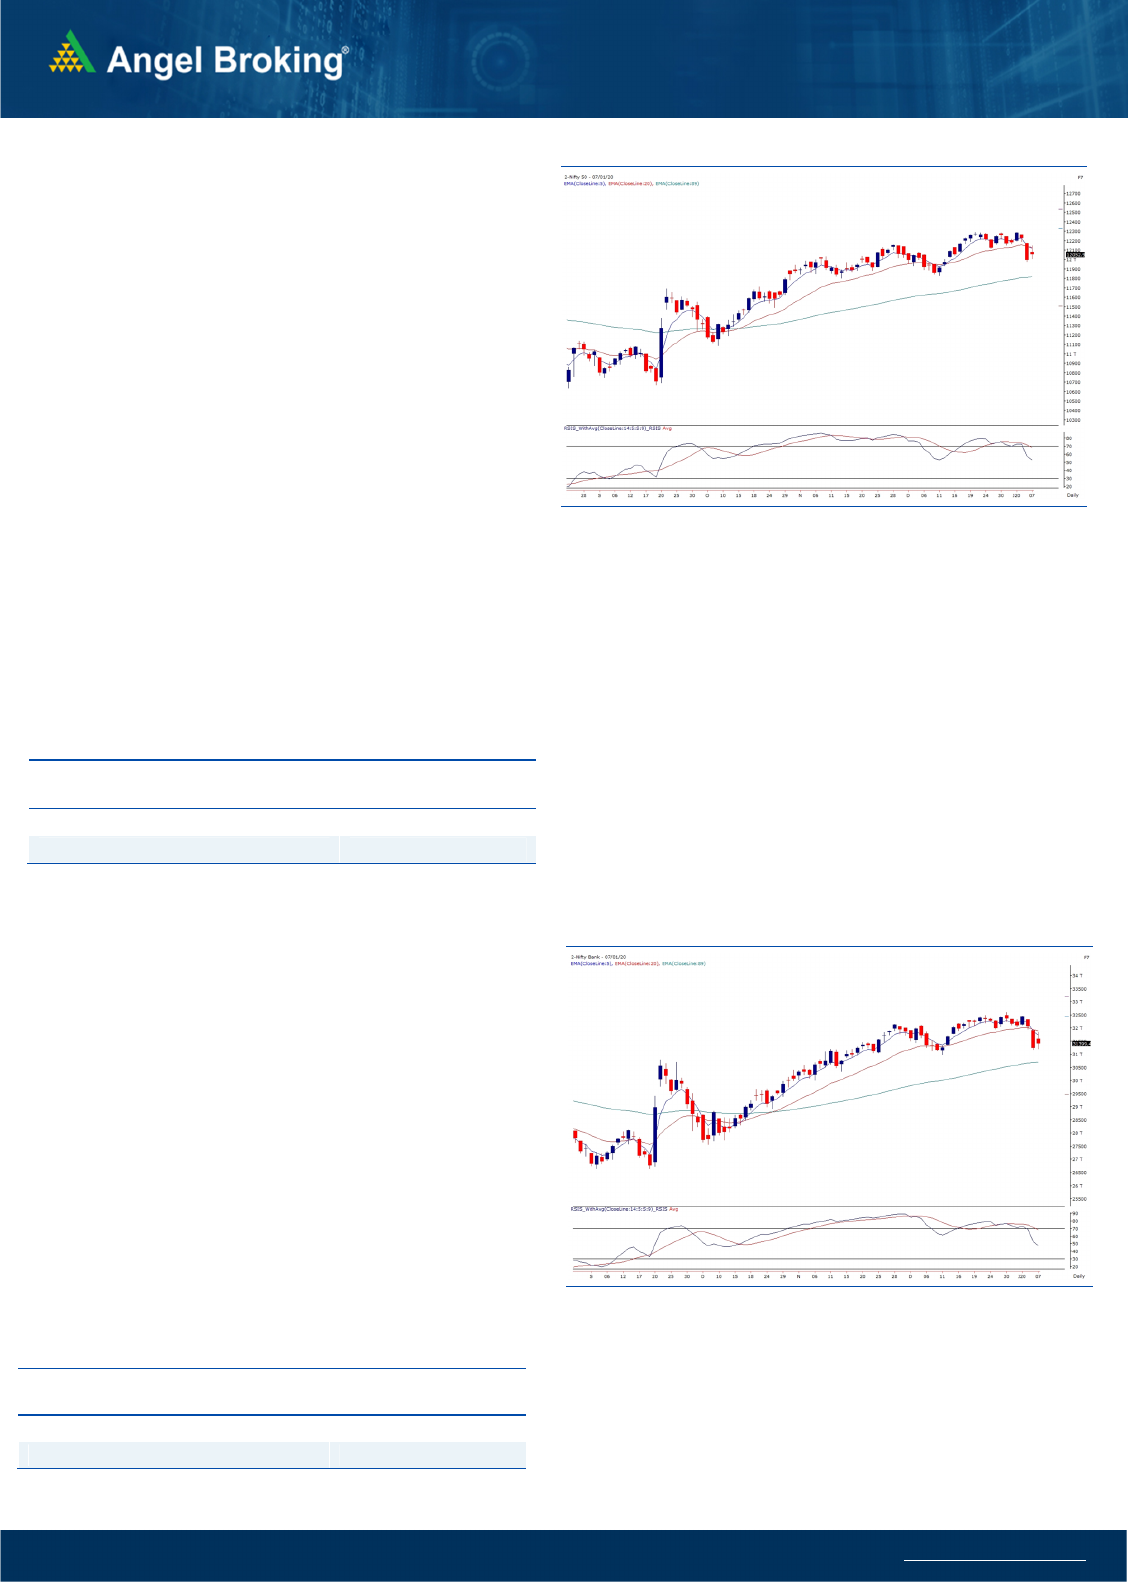
Post the sharp sell-off in Monday's session, our markets opened
on a positive note yesterday as the US and other global markets
were trading in the green. The index rallied higher but resisted
around 12150 mark and then corrected towards the 12000
mark. A mild recovery in the end led to the index closing the
session with gains of about half a percent.
In Monday's trading session, the index had breached the
immediate support of 12150 which now acted as a resistance in
the pullback move yesterday. The index again witnessed some
downmove from the resistance during the day. However, the
overall market breadth was in favor of advances and hence, there
were some stock specific momentum seen during the day. For
near term, 12150-12200 is now seen as a resistance and the
index need to surpass the same for a resumption of its uptrend.
Until we see a breakout above the same, traders are advised to
prefer a stock specific approach and trade with proper risk
management. Monday's low of 11974 is seen as the immediate
support which if breached, then we could see the correction
extending towards 11850-11800 range.
Key Levels
Support 1 – 11974 Resistance 1 – 12120
Support 2 – 11850 Resistance 2 – 12150
Exhibit 1: Nifty
Daily
Chart
Nifty Bank Outlook - (31399)
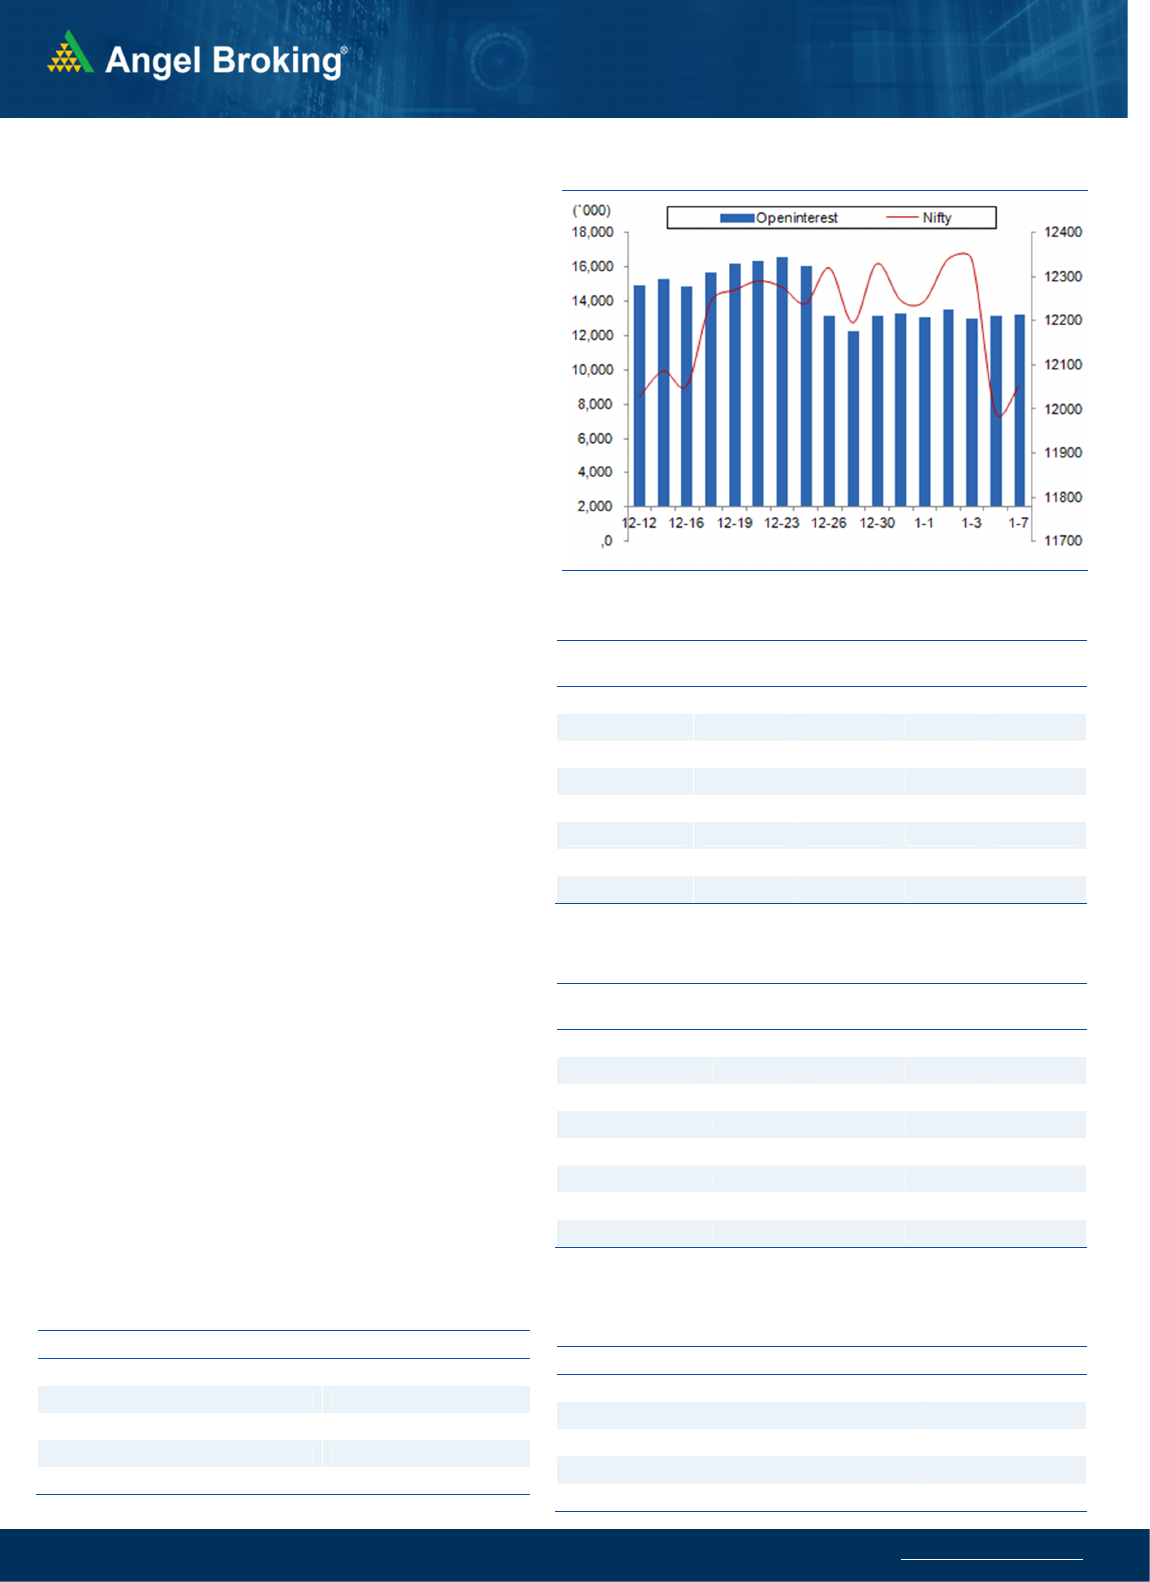
BankNifty too opened on a positive note yesterday and rallied
sharply in the first hour of the trade. At one point, the index was
trading with gains of over 600 points, but this pullback move
witnessed selling pressure from the highs and it gave up all the
gains before ending the session around 31400.
The pullback move in yesterday's session witnessed selling
pressure during the day as the index heavyweights failed to hold
on to the morning gains. The immediate resistance for BankNifty
is seen around 31200 and it needs to be surpassed soon for a
resumption of the uptrend. Untill then, traders are advised to
stay light on positions in stocks within this sector. On the flipside,
the immediate supports for BankNifty are placed around 31000
and 30680.
Key Levels
Support 1 – 31000 Resistance 1 – 31850
Support 2 – 30680 Resistance 2 – 32000
Exhibit 2: Nifty Bank
Daily
Chart

www.angelbroking.com
Technical & Derivatives Report
January 08, 2020
Nifty Vs OI
Views
Yesterday Nifty started on a strong positive note and
in the first hour itself was up by more than 150 points.
However the rub-off effect from the previous session
pulled Index lower to eventually end with half a
percent gains tad above 12050 levels.
FIIs were net sellers in the cash market segment to the
tune of Rs. 682 crores. In index futures, they were net
buyers worth Rs. 1392 crores fall in open interest by
2.31%.
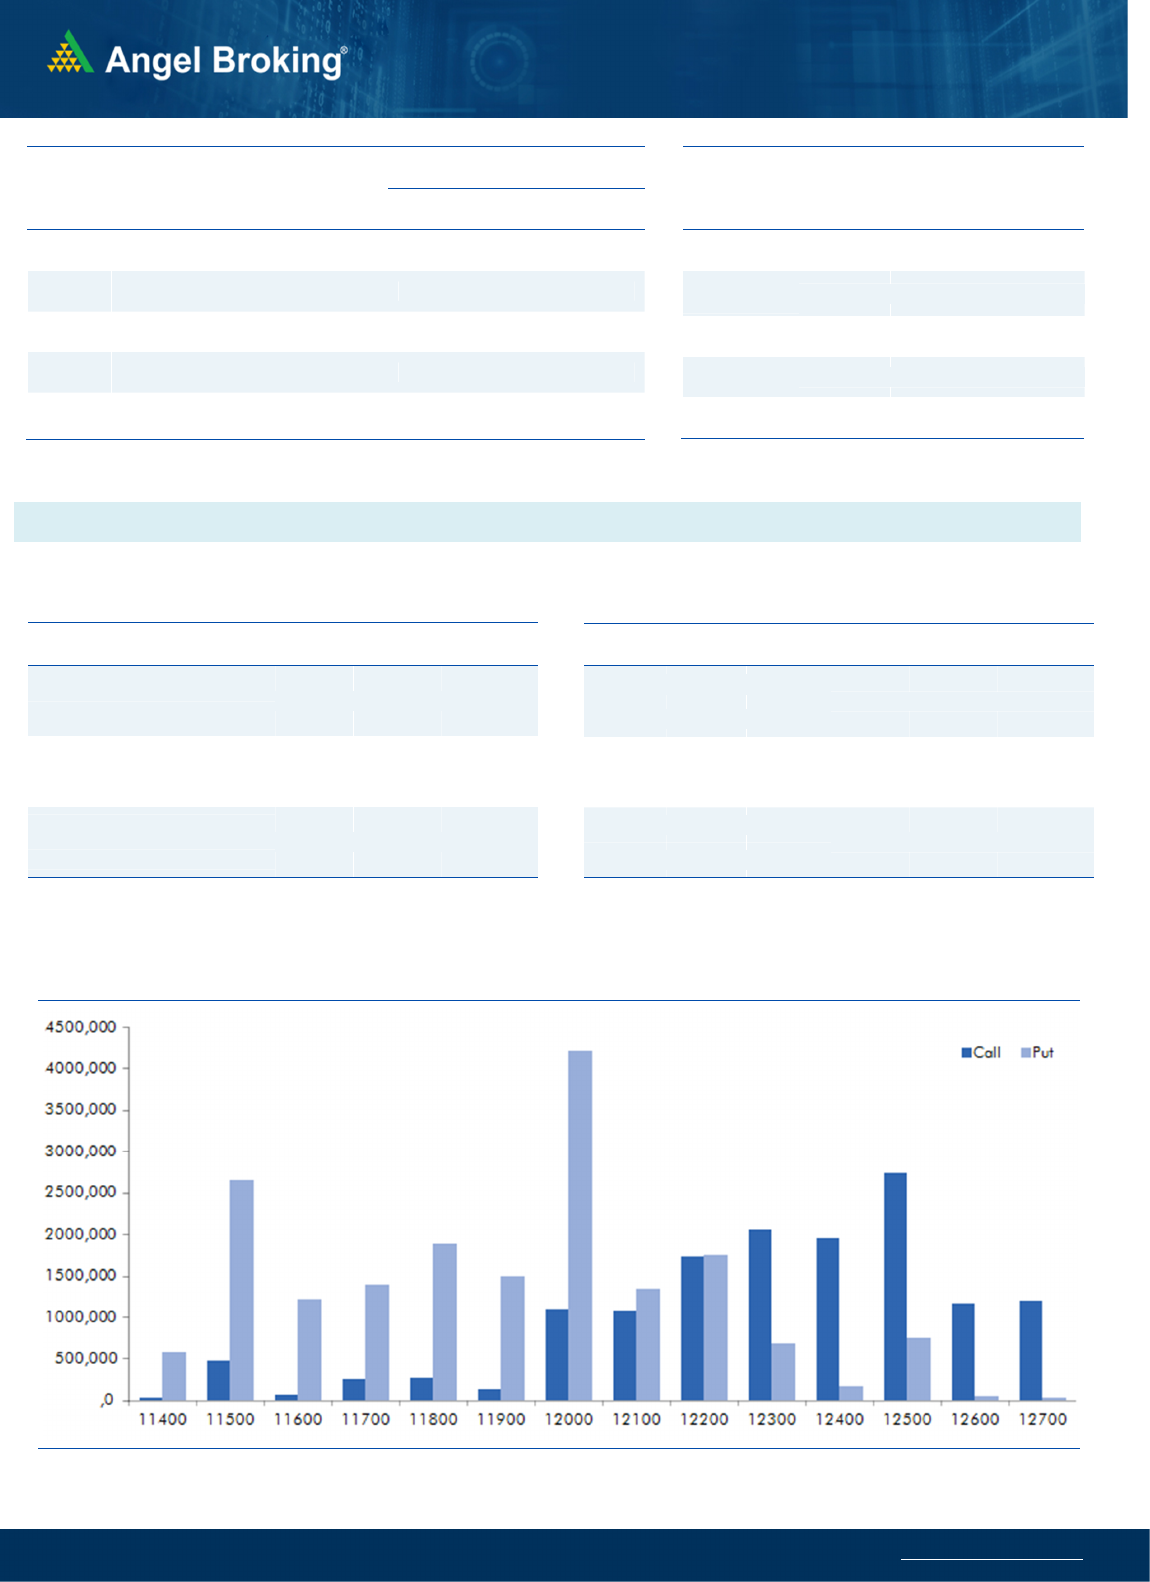
The index rallied higher in the morning yesterday but
we did not witness a continuation of the momentum.
The index resisted around 12200 where there was
good amount of writing seen in the call option in last
two days. The options data indicates a stiff resistance
around 12200 whereas support is seen around 12000
where there is highest open interest in put options. A
move beyond this range of 12000-12200 along with
unwinding in positions will lead to the next directional
move in the index and hence, traders are advised to be
vigilant on the same.
Comments
The Nifty futures open interest has increased by 0.06%
Bank Nifty futures open interest has increased 4.71% as
market closed at 12052.95 levels.
The Nifty January future closed with a premium of 53.75
points against a premium of 50.65 points in last trading
session. The February series closed at a premium of
96.25 points.
The INDIA VIX has increased from 14.47 to 14.61.
At the same time, the PCR-OI of Nifty has increased
from 1.12 to 1.19.
Few of the liquid counters where we have seen high cost
of carry are ICICIBANK, SAIL, CENTURYTEX, LUPIN and
MGL.
OI Gainers
SCRIP OI
OI
CHG. (%)
PRICE
PRICE
CHG. (%)
BIOCON 12645400 12.48 284.15 -1.51
RBLBANK 15730500 8.07 344.00 1.86
GLENMARK 6731200 7.11 343.20 0.89
MINDTREE 1455200 6.94 846.30 1.94
MGL 1981200 6.62 1040.75 -0.76
HINDALCO 41513500 6.34 208.85 -0.05
NMDC 25944000 5.46 128.05 -0.70
INDUSINDBK 11036800 5.33 1461.65 -0.60
OI Losers
SCRIP OI
OI
CHG. (%)
PRICE
PRICE
CHG. (%)
RAMCOCEM 1012800 -6.64 788.70 4.85
CANBK 14378000 -5.53 208.05 0.70
CADILAHC 6681400 -5.51 257.05 1.00
ASHOKLEY 54240000 -5.08 82.10 2.05
AMARAJABAT 1373600 -5.03 726.25 1.50
ADANIPORTS 32985000 -4.34 384.80 1.10
BALKRISIND 1767200 -3.66 967.50 0.45
INDIGO 3308700 -3.41 1364.05 2.80
Put-Call Ratio
SCRIP PCR-OI PCR-VOL
NIFTY 1.19 0.94
BANKNIFTY 0.77 1.04
RELIANCE 0.70 0.55
ICICIBANK 0.52 0.65
INFY 0.61 0.81
Historical Volatility
SCRIP HV
RAMCOCEM 29.27
SHREECEM 32.04
PFC 42.21
HDFCBANK 20.40
ULTRACEMCO 30.60

www.angelbroking.com
Technical & Derivatives Report
January 08, 2020
Note: Above mentioned Bullish or Bearish Spreads in Nifty (January Series) are given as an information and not as a recommendation.
Nifty Spot
=
1
2052
.
9
5
Lot Size = 75
FII Statistics for
January
0
7
, 2020
Detail Buy Sell Net
Open Interest
Contracts
Value
(in Cr.)
Change
(%)
INDEX
FUTURES
5490.03 4098.38 1391.65
140829 11882.70 (2.31)
INDEX
OPTIONS
372765.96 371890.31 875.65
721941 59571.03 12.62
STOCK
FUTURES
11635.93 11088.59 547.34
1467128 97110.26 0.09
STOCK
OPTIONS
4327.28 4247.98 79.30
52160 3511.28 4.93
Total 394219.20
391325.26
2893.94
2382058
172075.27
3.54
Turnover on
January
0
7
, 20
20
Instrument
No. of
Contracts
Turnover
( in Cr. )
Change
(%)
INDEX
FUTURES
411495 30722.10 11.58
INDEX
OPTIONS
23795432 1708214.05 45.38
STOCK
FUTURES
673263 45968.05 1.32
STOCK
OPTIONS
592956 43424.45 -10.84
TOTAL 2,54,73,146 1828328.65 41.01
Bull
-
Call Spreads
Action Strike Price Risk Reward BEP
Buy 12000 218.85
64.75 35.25 12064.75
Sell 12100 154.10
Buy 12000 218.85
116.15 83.85 12116.15
Sell 12200 102.70
Buy 12100 154.10
51.40 48.60 12151.40
Sell 12200 102.70
Bear
-
Put Spreads
Action Strike Price Risk Reward BEP
Buy 12000 116.95
27.80 72.20 11972.20
Sell 11900 89.15
Buy 12000 116.95
50.05 149.95 11949.95
Sell 11800 66.90
Buy 11900 89.15
22.25 77.75 11877.75
Sell 11800 66.90
Nifty Put
-
Call Analysis

www.angelbroking.com
Technical & Derivatives Report
January 08, 2020
Daily Pivot Levels for Nifty Constituents
Scrips S2 S1
PIVOT
R1
R2
ADANIPORTS 378 382
386 389
393
ASIANPAINT 1,696 1,710
1,725 1,740 1,755
AXISBANK 711 719
728 735
745
BAJAJ-AUTO 3,005 3,021
3,047 3,063 3,089
BAJFINANCE 3,936 3,972
4,032 4,068 4,128
BAJAJFINSV 8,942 9,019
9,142 9,219 9,342
BPCL 450 456
465 471
480
BHARTIARTL 436 440
448 453
460
INFRATEL 231 235
241 244
251
BRITANNIA 3,014 3,025
3,040 3,051 3,066
CIPLA 461 465
467 471
474
COALINDIA 202 204
206 208
210
DRREDDY 2,849 2,867
2,888 2,906 2,927
EICHERMOT 20,320 20,562
20,956 21,198 21,592
GAIL 123 124
125 126
127
GRASIM 724 733
745 754
765
HCLTECH 575 580
584 588
592
HDFCBANK 1,242 1,251
1,261 1,271 1,281
HDFC 2,359 2,387
2,408 2,436 2,457
HEROMOTOCO
2,299
2,323
2,362
2,386
2,425
HINDALCO 204 207
210 212
215
HINDUNILVR 1,910 1,915
1,923 1,928 1,936
ICICIBANK 513 518
527 532
541
IOC 122 123
125 127
129
INDUSINDBK 1,405 1,433
1,471 1,499 1,536
INFY 714 721
732 739
749
ITC 233 234
236 237
239
JSW STEEL 259 262
266 269
273
KOTAKBANK 1,641 1,656
1,665 1,680 1,690
LT 1,299 1,310
1,325 1,335 1,350
M&M 518 522
527 531
536
MARUTI 6,949 7,011
7,089 7,151 7,228
NESTLEIND 14,080 14,185
14,366 14,471 14,652
NTPC 118 119
120 122
123
ONGC 124 125
126 127
129
POWERGRID 189 190
192 194
196
RELIANCE 1,503 1,514
1,524 1,535 1,545
SBIN 309 314
320 325
332
SUNPHARMA 434 440
444 450
454
TCS 2,171 2,188
2,201 2,219 2,232
TATAMOTORS 178 182
185 189
193
TATASTEEL 467 472
478 483
489
TECHM 754 766
772 784
790
TITAN 1,140 1,150
1,162 1,172 1,184
ULTRACEMCO 4,130 4,186
4,220 4,276 4,310
UPL 573 584
594 605
615
VEDANTA 151 153
155 158
159
WIPRO 248 251
254 258
260
YESBANK 43 44
45 46 48
ZEEL 259 264
267 272
275

www.angelbroking.com
Technical & Derivatives Report
January 08, 2020
*
Research Team Tel: 022
-
39357800
Website:
www.angelbroking.com
For Technical Queries E-mail: technicalresearch-cso@angelbroking.com
For Derivatives Queries E-mail: derivatives.desk@angelbroking.com
DISCLAIMER
Angel Broking Limited (hereinafter referred to as “Angel”) is a registered Member of National Stock Exchange of India Limited,
Bombay Stock Exchange Limited and Metropolitan Stock Exchange Limited. It is also registered as a Depository Participant with CDSL
and Portfolio Manager and Investment Adviser with SEBI. It also has registration with AMFI as a Mutual Fund Distributor. Angel
Broking Limited is a registered entity with SEBI for Research Analyst in terms of SEBI (Research Analyst) Regulations, 2014 vide
registration number INH000000164. Angel or its associates has not been debarred/ suspended by SEBI or any other regulatory
authority for accessing /dealing in securities Market. Angel or its associates/analyst has not received any compensation / managed
or co-managed public offering of securities of the company covered by Analyst during the past twelve months.
This document is solely for the personal information of the recipient, and must not be singularly used as the basis of any investment
decision. Nothing in this document should be construed as investment or financial advice. Each recipient of this document should
make such investigations as they deem necessary to arrive at an independent evaluation of an investment in the securities of the
companies referred to in this document (including the merits and risks involved), and should consult their own advisors to determine
the merits and risks of such an investment.
Reports based on technical and derivative analysis center on studying charts of a stock's price movement, outstanding positions and
trading volume, as opposed to focusing on a company's fundamentals and, as such, may not match with a report on a company's
fundamentals. Investors are advised to refer the Fundamental and Technical Research Reports available on our website to evaluate
the contrary view, if any.
The information in this document has been printed on the basis of publicly available information, internal data and other reliable
sources believed to be true, but we do not represent that it is accurate or complete and it should not be relied on as such, as this
document is for general guidance only. Angel Broking Limited or any of its affiliates/ group companies shall not be in any way
responsible for any loss or damage that may arise to any person from any inadvertent error in the information contained in this
report. Angel Broking Limited has not independently verified all the information contained within this document. Accordingly, we
cannot testify, nor make any representation or warranty, express or implied, to the accuracy, contents or data contained within this
document. While Angel Broking Limited endeavors to update on a reasonable basis the information discussed in this material, there
may be regulatory, compliance, or other reasons that prevent us from doing so.
This document is being supplied to you solely for your information, and its contents, information or data may not be reproduced,
redistributed or passed on, directly or indirectly.
Neither Angel Broking Limited, nor its directors, employees or affiliates shall be liable for any loss or damage that may arise from or
in connection with the use of this information.