Daily Technical Report
December 01, 2014
Sensex (28694) / Nifty (8588)
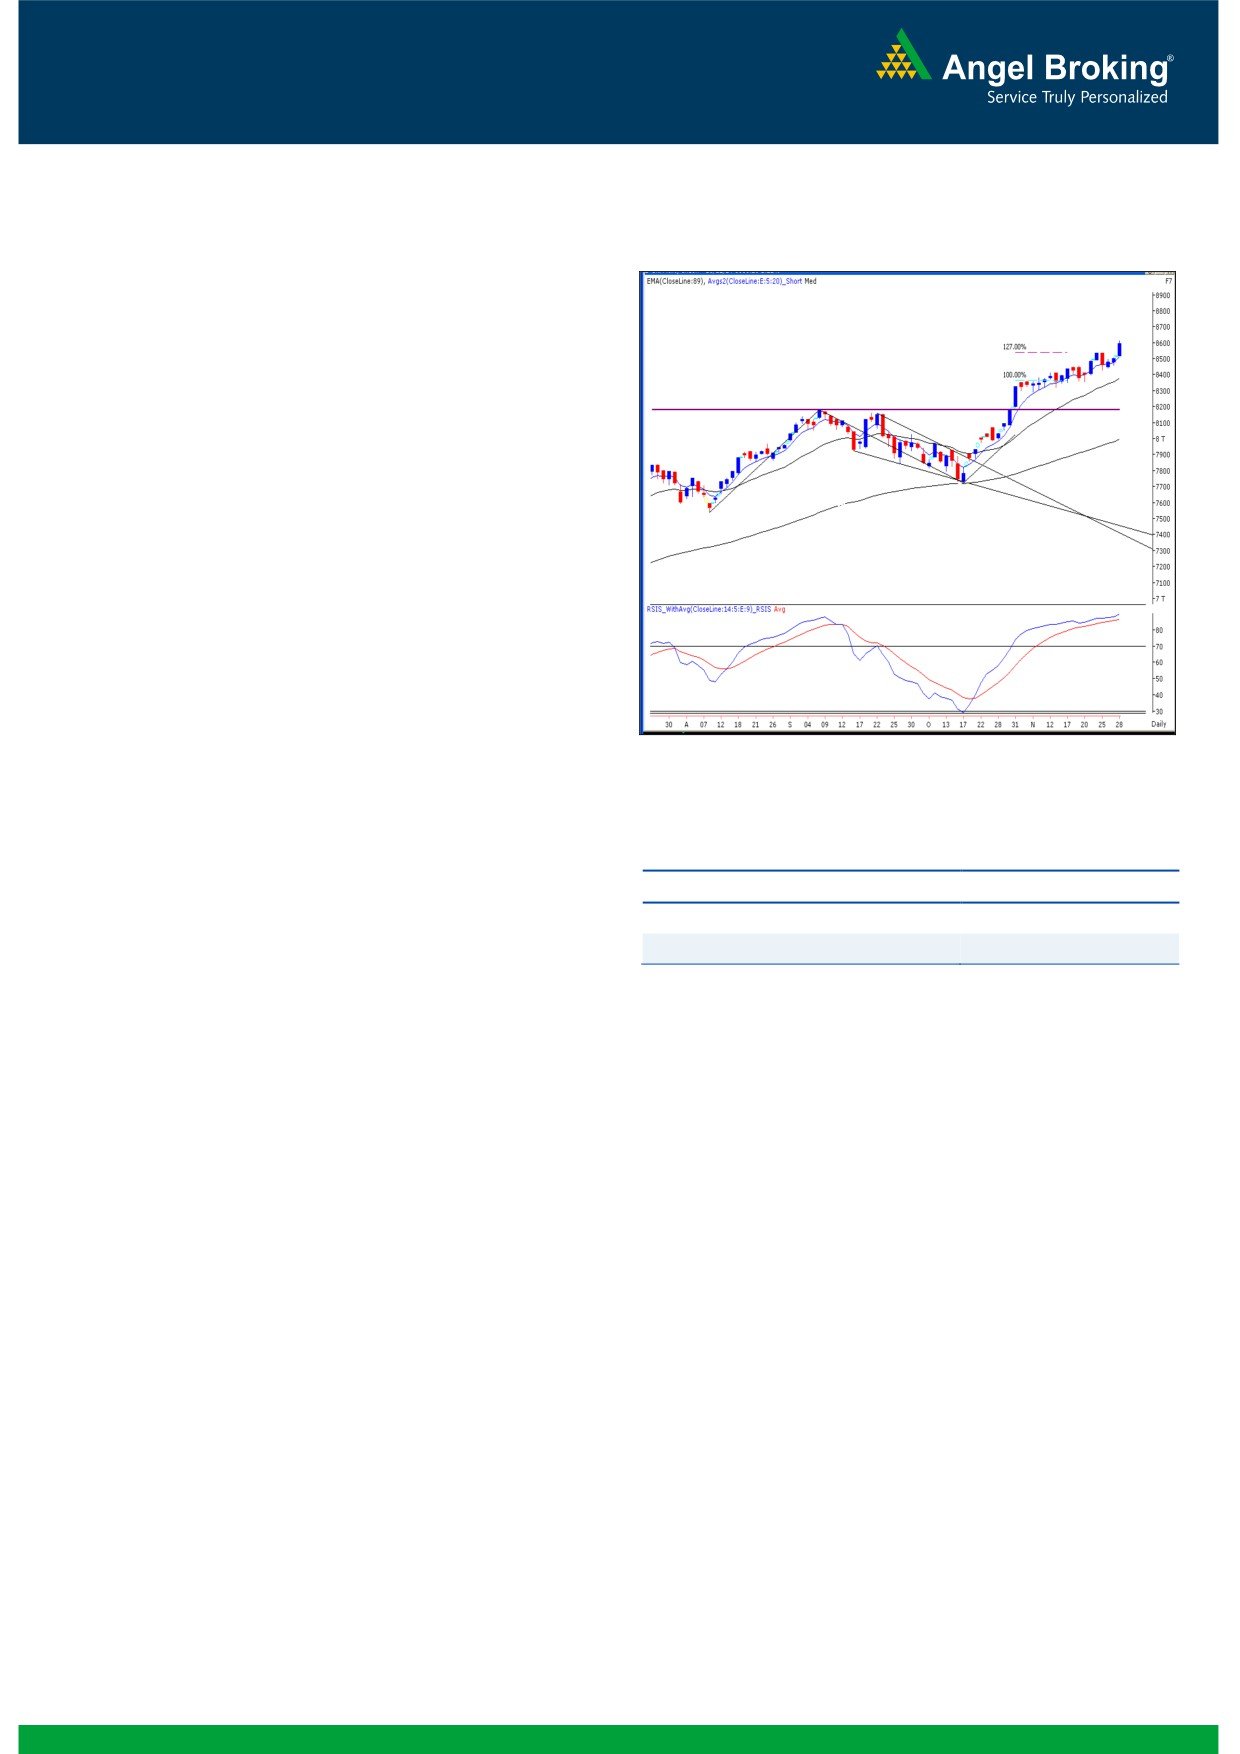
Exhibit 1: Nifty Daily Chart
The concluding session of the week opened on a cheerful
note on the back of optimistic global cues. This momentum
accelerated as the day progressed and as a result, the Nifty
posted a close at the historical high by adding more than a
percent to the previous close. Barring nominal loss in the IT
sector, all other sectors ended the week on a positive note.
The Banking, Auto, Capital Goods and Realty were among
the major contributors. The advance to decline ratio was
marginally in favor of the declining counters. (A=1481
Formations
The ’89-day EMA’ and the ’89-week EMA’ are placed
at 26746 / 7994 and 23128 / 6918 levels, respectively.
The ’20-day EMA’ and the ‘20-week EMA’ are placed
at 28020 / 8378 and 26784 / 8007 levels, respectively.
Source: Falcon
Actionable points:
Trading strategy:
As in the previous week, the concluding session turned out
View
Neutral
to be a trend decider for the concluded week as well. As
Support Level
8500
mentioned in our earlier report, the Nifty marched towards
Resistance Levels
8620 - 8650
the target levels of 8500 - 8550 in the initial part of week.
We had also mentioned about being a bit cautious and
staying light on positions after approaching this important
resistance zone. This strategy played out well during the first
half of the week as we witnessed a nearly one and half a
percent cut in the Nifty from the high. Still, we hadn't
advised traders to short the Nifty; in fact, we continued to
concentrate on stock specific movements. Following this, the
Nifty soared on Friday on the back of a sharp cut in global
crude oil prices. The Nifty has now surpassed our expected
level of 8550; but despite having a strong momentum on
the upside, we would not provide any trade set up until we
get a clear development on the charts. Meanwhile, it's
advisable to stick to a stock centric approach and trade with
a proper exit strategy. If the momentum persists in the
market then we may see an extended move towards 8650 -
8680 levels on the Nifty. On the flipside, 8500 - 8420 are
seen as immediate support levels for the index.
1
Daily Technical Report
December 01, 2014
Bank Nifty Outlook - (18513)
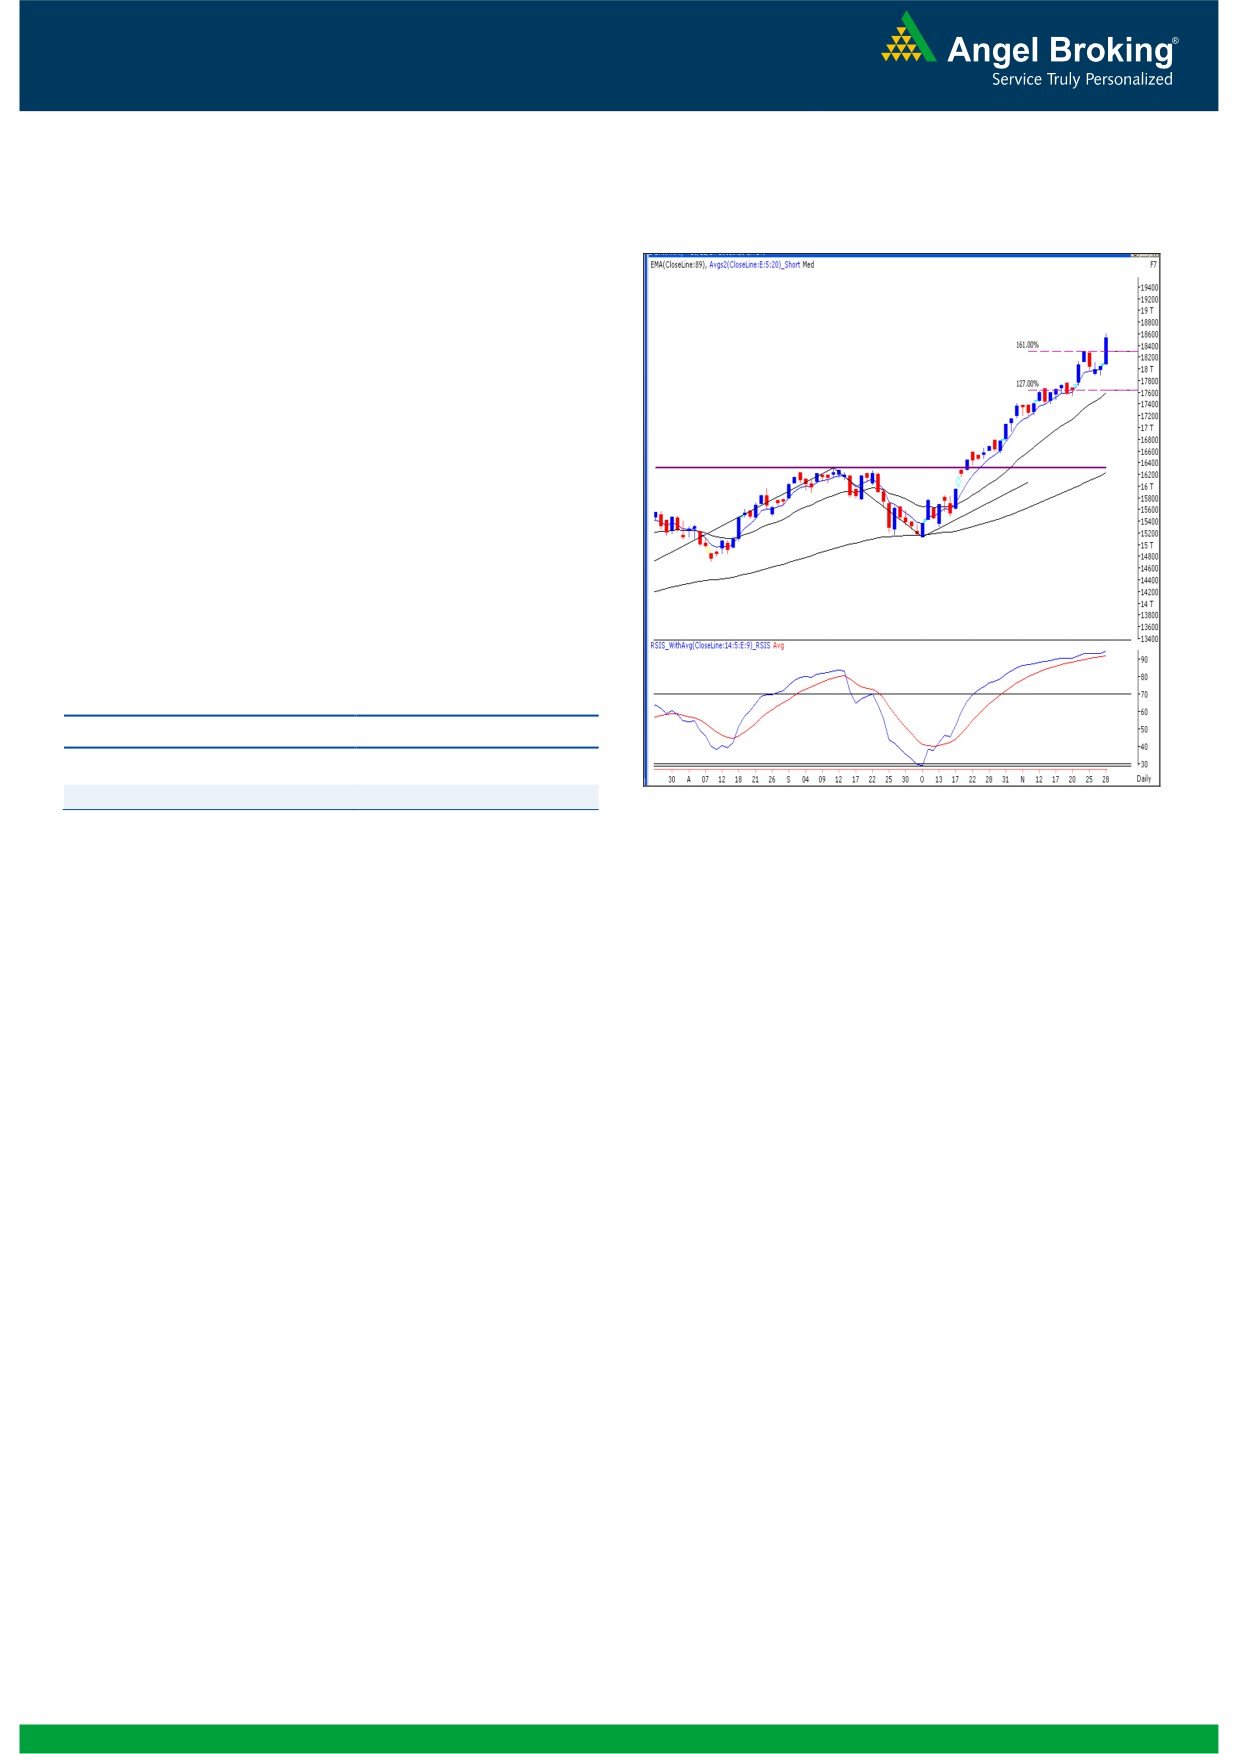
Exhibit 2: Bank Nifty Daily Chart
On Friday, the Bank Nifty opened higher in-line with the
benchmark index and posted a mammoth single day
gains of more than two and half a percent to end the
session tad above the 18500 mark. The banking index
has now moved well byond our expection of 18300 -
18400 levels. Going forward, looking at the momentum,
the possibility of extending this rally towards 18700 -
18800 cannot be ruled out. However, due to unfavorable
risk to reward ratio, it becomes difficult to provide a trade
set up. Traders are advised to focus on its constituents
and trade with proper exit strategy. On the flipside,
18300 - 18100 are seen as immediate support levels for
the index.
Actionable points:
View
Neutral
Resistance Levels
18600 - 18700
Support Levels
18300
Source: Falcon
2
Daily Technical Report
December 01, 2014
Daily Pivot Levels for Nifty 50 Stocks
SCRIPS
S2
S1
PIVOT
R1
R2
SENSEX
28,328
28,511
28,667
28,850
29,005
NIFTY
8,473
8,531
8,574
8,631
8,675
BANKNIFTY
17,871
18,192
18,404
18,725
18,937
ACC
1,425
1,450
1,465
1,490
1,505
AMBUJACEM
221
225
229
233
237
ASIANPAINT
703
724
737
757
770
AXISBANK
465
473
479
488
494
BAJAJ-AUTO
2,604
2,622
2,649
2,667
2,694
BANKBARODA
990
1,039
1,069
1,118
1,148
BHARTIARTL
373
378
384
389
395
BHEL
277
281
284
287
290
BPCL
709
728
756
775
804
CAIRN
254
257
262
265
270
CIPLA
624
630
638
644
652
COALINDIA
342
348
353
360
364
DLF
140
144
150
154
160
DRREDDY
3,569
3,587
3,613
3,632
3,658
GAIL
474
481
490
497
506
GRASIM
3,489
3,522
3,554
3,587
3,618
HCLTECH
1,628
1,645
1,662
1,679
1,696
HDFC
1,140
1,150
1,164
1,174
1,188
HDFCBANK
938
947
957
966
976
HEROMOTOCO
3,094
3,121
3,142
3,168
3,189
HINDALCO
171
172
174
175
177
HINDUNILVR
774
780
789
796
805
ICICIBANK
1,700
1,727
1,752
1,779
1,804
IDFC
152
156
159
162
165
INDUSINDBK
708
729
745
766
781
INFY
4,312
4,336
4,367
4,391
4,422
ITC
357
360
363
366
369
JINDALSTEL
136
138
142
144
148
KOTAKBANK
1,148
1,175
1,192
1,219
1,235
LT
1,612
1,626
1,641
1,655
1,670
LUPIN
1,437
1,459
1,472
1,493
1,506
M&M
1,283
1,303
1,316
1,336
1,348
MARUTI
3,244
3,295
3,327
3,379
3,411
NMDC
138
139
141
142
143
NTPC
140
141
142
144
145
ONGC
370
375
382
387
394
PNB
978
1,025
1,054
1,101
1,130
POWERGRID
138
140
142
144
146
RELIANCE
963
977
997
1,012
1,032
SBIN
303
312
317
327
332
SSLT
224
227
234
238
244
SUNPHARMA
831
836
842
846
853
TATAMOTORS
514
524
531
541
549
TATAPOWER
91
92
93
94
95
TATASTEEL
456
465
470
479
484
TCS
2,600
2,622
2,657
2,678
2,713
TECHM
2,609
2,624
2,647
2,662
2,685
ULTRACEMCO
2,448
2,466
2,490
2,508
2,532
WIPRO
575
581
585
590
595
ZEEL
369
376
381
388
393
3
Daily Technical Report
December 01, 2014
Research Team Tel: 022 - 30940000
DISCLAIMER
This document is solely for the personal information of the recipient, and must not be singularly used as the basis of any investment
decision. Nothing in this document should be construed as investment or financial advice. Each recipient of this document should make
such investigations as they deem necessary to arrive at an independent evaluation of an investment in the securities of the companies
referred to in this document (including the merits and risks involved), and should consult their own advisors to determine the merits and
risks of such an investment.
Angel Broking Pvt. Limited, its affiliates, directors, its proprietary trading and investment businesses may, from time to time, make
investment decisions that are inconsistent with or contradictory to the recommendations expressed herein. The views contained in this
document are those of the analyst, and the company may or may not subscribe to all the views expressed within.
Reports based on technical and derivative analysis center on studying charts of a stock's price movement, outstanding positions and
trading volume, as opposed to focusing on a company's fundamentals and, as such, may not match with a report on a company's
fundamentals.
The information in this document has been printed on the basis of publicly available information, internal data and other reliable
sources believed to be true, but we do not represent that it is accurate or complete and it should not be relied on as such, as this
document is for general guidance only. Angel Broking Pvt. Limited or any of its affiliates/ group companies shall not be in any way
responsible for any loss or damage that may arise to any person from any inadvertent error in the information contained in this report.
Angel Broking Pvt. Limited has not independently verified all the information contained within this document. Accordingly, we cannot
testify, nor make any representation or warranty, express or implied, to the accuracy, contents or data contained within this document.
While Angel Broking Pvt. Limited endeavors to update on a reasonable basis the information discussed in this material, there may be
regulatory, compliance, or other reasons that prevent us from doing so.
This document is being supplied to you solely for your information, and its contents, information or data may not be reproduced,
redistributed or passed on, directly or indirectly.
Angel Broking Pvt. Limited and its affiliates may seek to provide or have engaged in providing corporate finance, investment banking
or other advisory services in a merger or specific transaction to the companies referred to in this report, as on the date of this report or
in the past.
Neither Angel Broking Pvt. Limited, nor its directors, employees or affiliates shall be liable for any loss or damage that may arise from
or in connection with the use of this information.
Note: Please refer to the important `Stock Holding Disclosure' report on the Angel website (Research Section). Also, please refer to the
latest update on respective stocks for the disclosure status in respect of those stocks. Angel Broking Pvt. Limited and its affiliates may
have investment positions in the stocks recommended in this report.
Research Team
Sameet Chavan
-
Technical Analyst
Angel Broking Pvt. Ltd.
Registered Office: G-1, Ackruti Trade Centre, Rd. No. 7, MIDC, Andheri (E), Mumbai - 400 093.
Corporate Office: 6th Floor, Ackruti Star, MIDC, Andheri (E), Mumbai - 400 093. Tel: (022) 30940000
Sebi Registration No: INB 010996539
4