Daily Technical Report
August 22, 2013
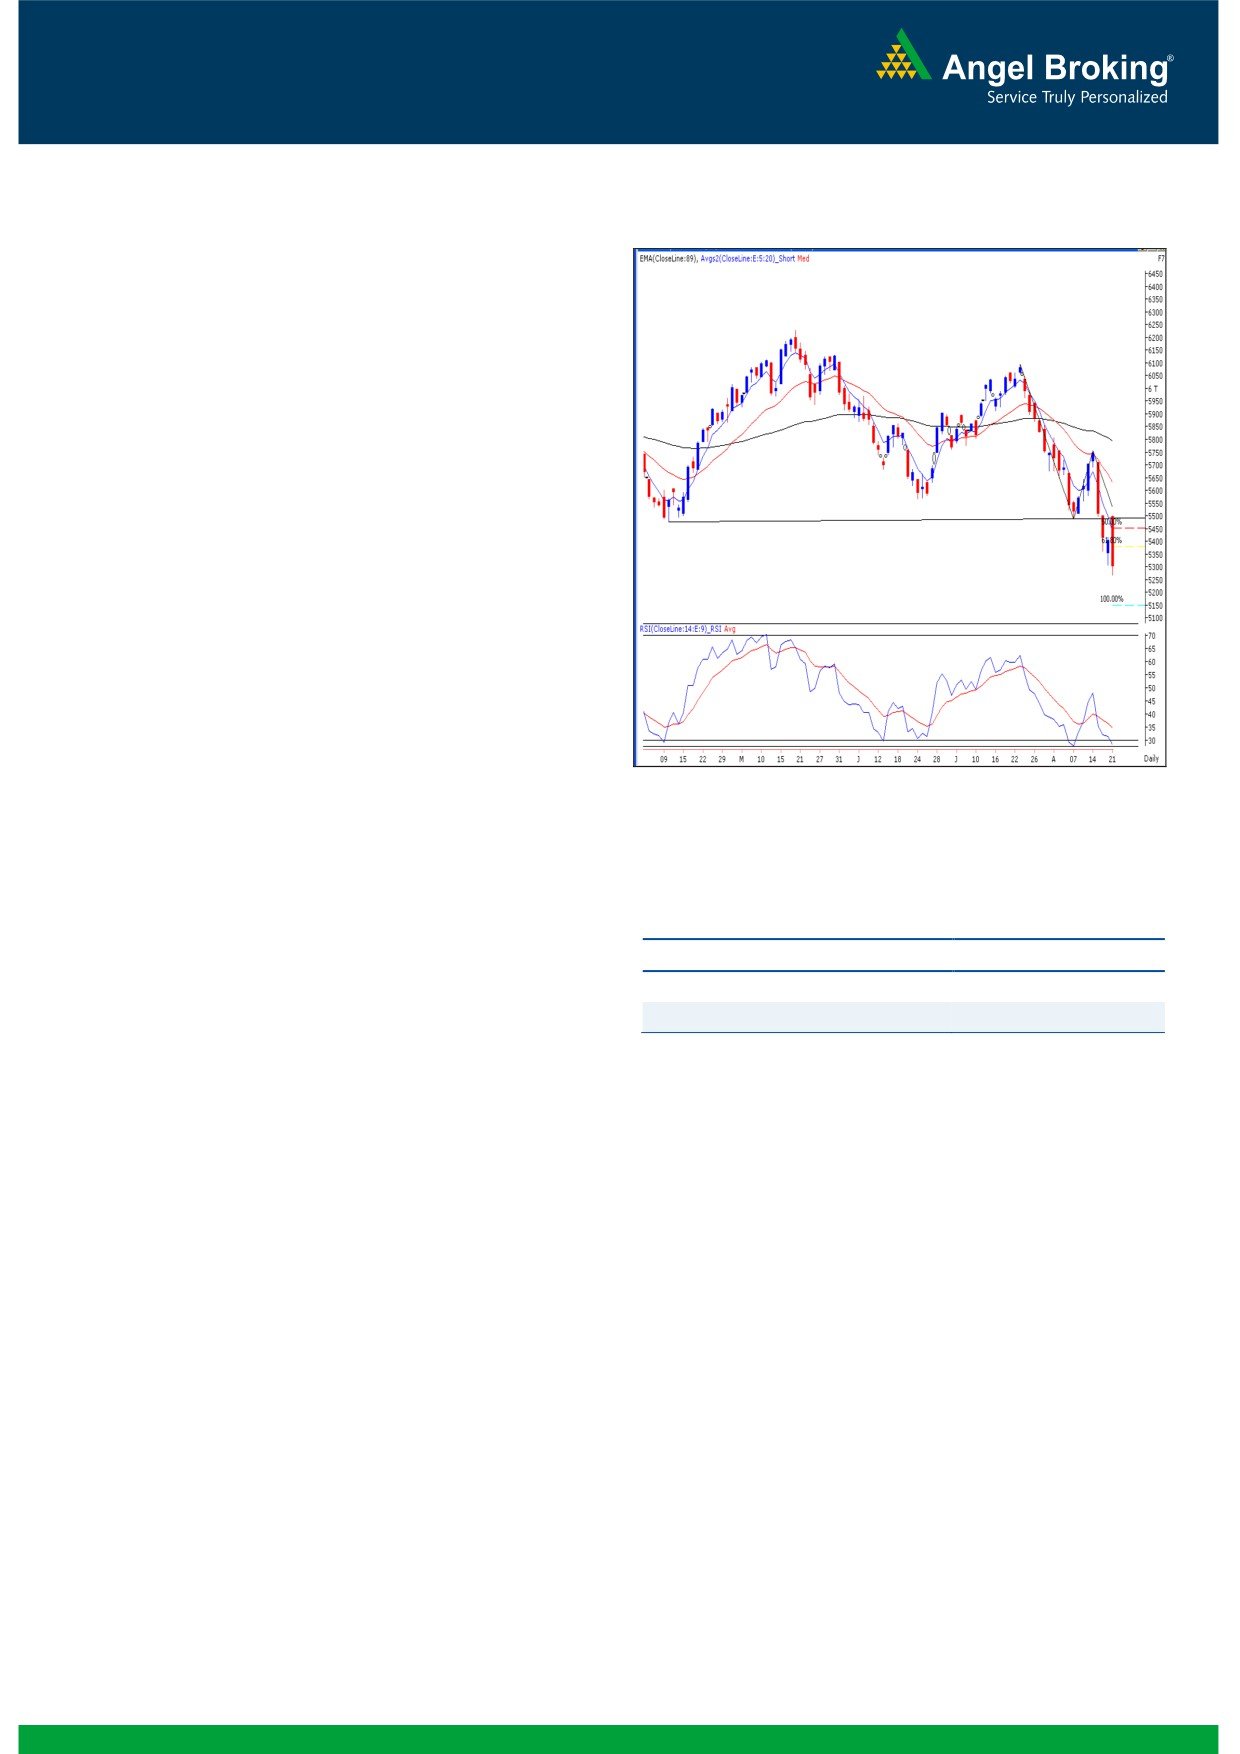
Exhibit 1: Nifty Daily Chart
Sensex (17906) / NIFTY (5303)
Yesterday, our market opened with more than a percent upside
gap as the measures from the RBI helped to calm the storm in
the bond markets. However, indices failed to sustain at higher
levels on the back of massive selling pressure in few
heavyweight constituents and significant rupee depreciation. As
a result, Nifty eventually slipped well inside the negative
territory. The Metal, Oil & Gas, Realty and FMCG counters
plunged during the session; whereas the Consumer Durables
and Banking sector somehow managed to close in the positive
territory with very nominal gains. The Advance to Decline ratio
was strongly in favor of declining counters. (A=886 D=1372)
Formation
The ’89-day EMA’ and the ’89-week EMA’ are placed at
19304/ 5795 and 18595/ 5613 levels, respectively.
The ’20-day EMA’ and the ‘20-week EMA’ are placed at
Source: Falcon:
18954 / 5630 and 19184 / 5755, respectively.
The monthly ‘RSI-Smoothened’ oscillator is signaling a
negative crossover.
Actionable points:
The weekly ‘Lower Top - Lower Bottom’ formation in Nifty
is still intact.
View
Neutral
The 50% and 61.8% Fibonacci retracement levels of the
Support levels
5268 - 5180
rise from 4531 (low of December 2011 candle) to 6230
Resistance Levels
5306 - 5355
(high of May 2013 candle) are placed at 5380 and 5180,
respectively.
Trading strategy:
Yet another trading session turned out to be the nightmare for
the bulls. The benchmark index opened substantially higher as
the RBI on Tuesday late evening issued another set of steps to
shield banks from incurring financial losses due to declining
bond prices. However, this optimism was very short lived as the
index took a u-turn after testing strong resistance zone of
5486. This was mainly on the back of ongoing weakness in
INR. Considering ongoing pessimism and weak chart structure,
if Nifty stays below 5268 then we expect the index to test the
5180 level, which is the 61.8% Fibonacci retracement level of
the rise in monthly chart. On the upside, the intraday resistance
is seen around 5355 - 5400 levels. Traders are advised to note
that the momentum oscillators on the daily and the weekly
chart are extremely oversold and fresh positional short
positions at current levels are not advisable.
1
Daily Technical Report
August 22, 2013
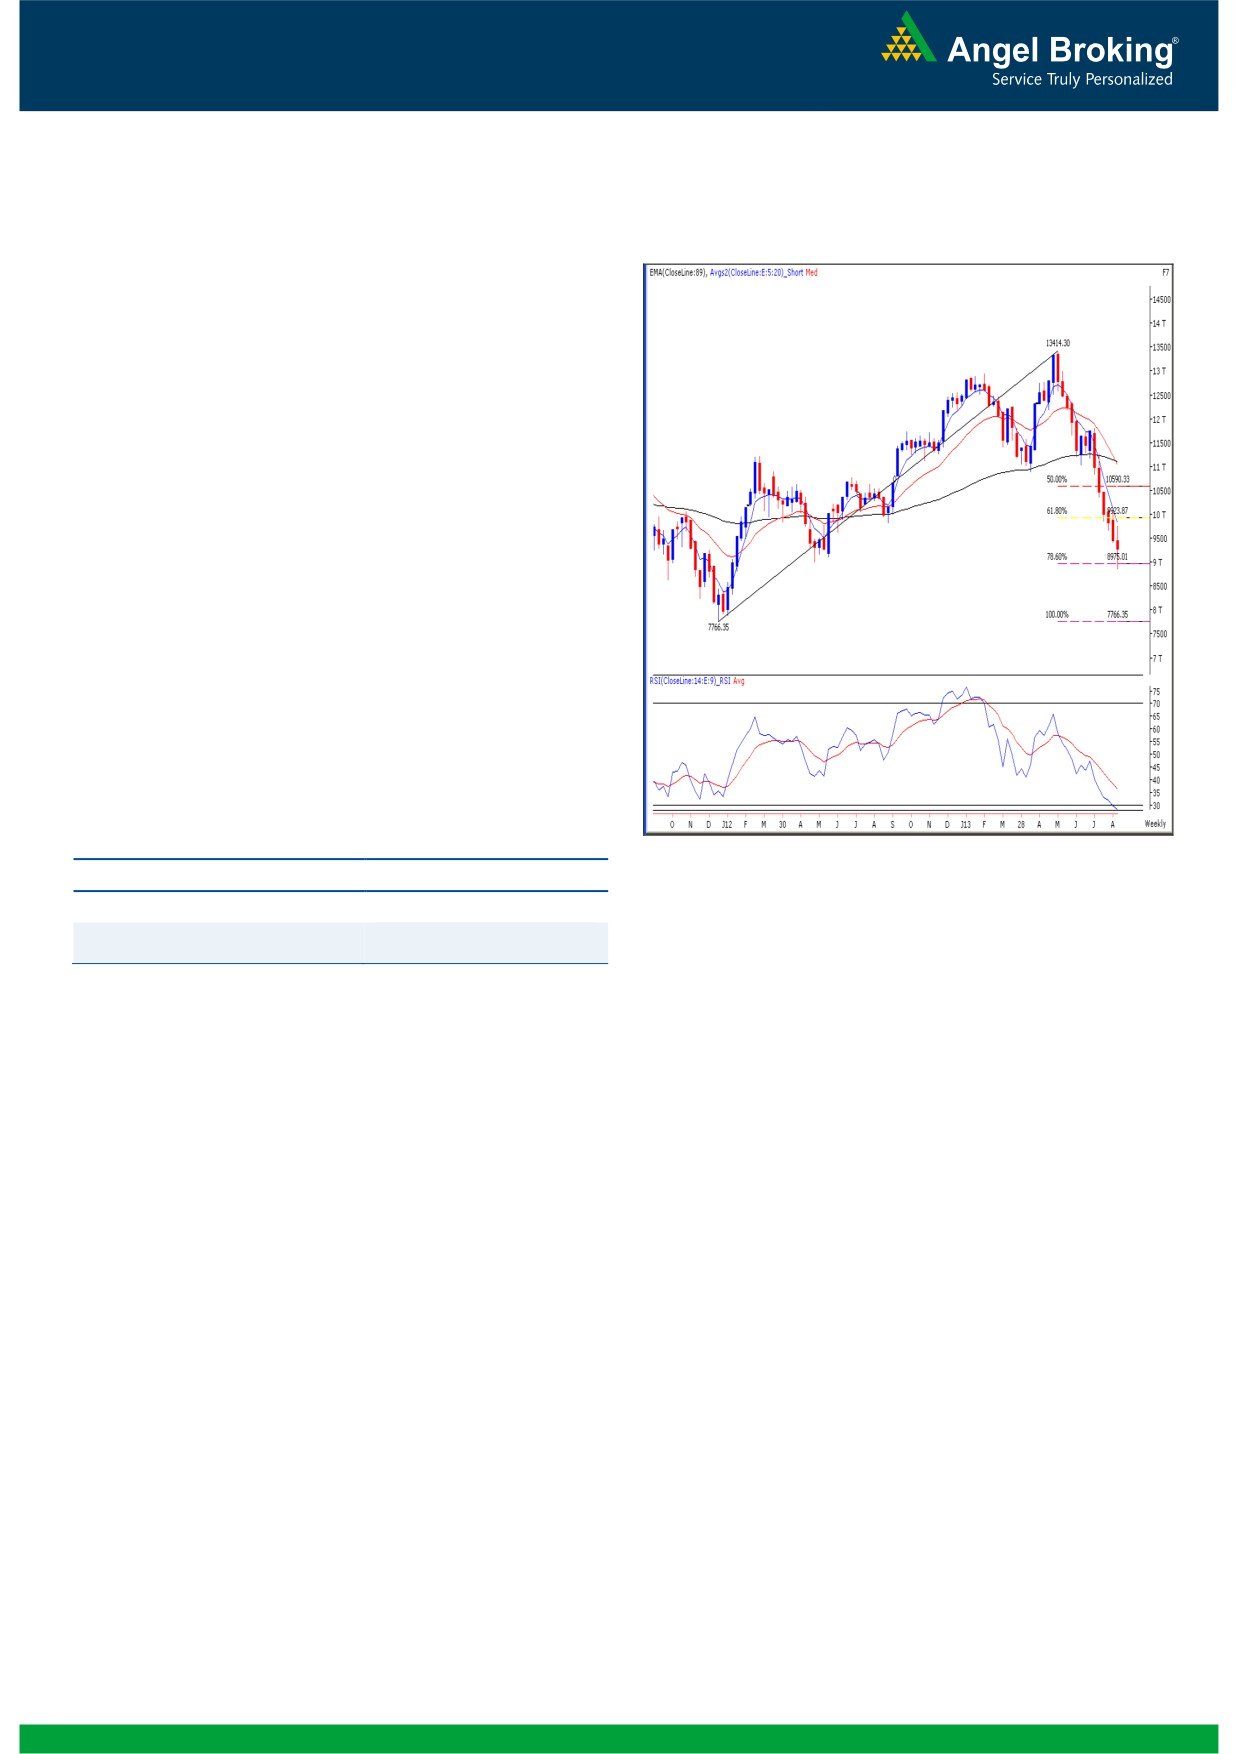
Bank Nifty Outlook - (9264)
Exhibit 2: Bank Nifty Weekly Chart
Yesterday, the Bank Nifty opened with a whooping five
percent upside gap on account of RBI's announcement
post the market hours on Tuesday. However, Rupee
depreciation caused mayhem on the street and the Bank
Nifty experienced massive selling pressure near day's high
and trimmed a major part of their early morning gains.
The high of 9767 precisely coincided with the hourly
resistance of '89 EMA'. Going forward, if the Bank Nifty
sustains below yesterday’s low of 9219 then we may
expect further lower levels of 9096 - 8995 to be tested.
On the flipside, 9277-9425 would act as an immediate
Resistance level. Similar to the chart of the Benchmark
indices, here too the oversold condition of momentum
oscillators on the daily and weekly chart does not give
comfort in creating fresh short positions on the Banking Index.
Actionable points:
Source: Falcon:
View
Neutral
Support levels
9096 - 8995
9277 - 9425
Resistance levels
2
Daily Technical Report
August 22, 2013
Daily Pivot Levels for Nifty 50 Stocks
SCRIPS
S2
S1
PIVOT
R1
R2
SENSEX
17,333
17,620
18,094
18,380
18,854
NIFTY
5,123
5,213
5,358
5,448
5,594
BANKNIFTY
8,750
9,007
9,387
9,644
10,023
ACC
938
972
1,034
1,069
1,131
AMBUJACEM
147
152
158
162
169
ASIANPAINT
401
408
418
425
435
AXISBANK
892
935
1,001
1,044
1,111
BAJAJ-AUTO
1,658
1,696
1,751
1,789
1,843
BANKBARODA
411
432
463
484
515
BHARTIARTL
276
287
306
317
336
BHEL
99
102
106
108
112
BPCL
265
275
289
299
313
CAIRN
281
290
304
313
327
CIPLA
381
387
397
402
412
COALINDIA
251
256
261
265
270
DLF
135
143
153
161
171
DRREDDY
1,961
2,004
2,070
2,113
2,179
GAIL
288
293
298
303
309
GRASIM
2,265
2,290
2,319
2,344
2,374
HCLTECH
861
874
894
906
926
HDFC
721
734
747
760
772
HDFCBANK
572
582
601
612
630
HEROMOTOCO
1,807
1,839
1,892
1,924
1,977
HINDALCO
87
90
95
98
103
HINDUNILVR
570
579
593
603
617
ICICIBANK
761
796
838
872
914
IDFC
93
97
103
107
114
INDUSINDBK
336
347
366
377
395
INFY
2,886
2,922
2,959
2,995
3,031
ITC
281
291
306
316
331
JINDALSTEL
211
216
223
228
234
JPASSOCIAT
27
29
31
33
36
KOTAKBANK
583
604
639
660
695
LT
663
686
728
752
794
LUPIN
742
755
775
788
809
M&M
751
767
792
808
832
MARUTI
1,245
1,265
1,295
1,315
1,345
NMDC
104
107
111
113
117
NTPC
124
127
132
135
140
ONGC
240
246
255
260
270
PNB
445
462
492
510
540
POWERGRID
96
97
98
99
100
RANBAXY
278
305
346
373
414
RELIANCE
745
764
800
819
854
RELINFRA
291
304
325
338
360
SBIN
1,446
1,497
1,574
1,625
1,702
SESAGOA
122
130
143
151
165
SUNPHARMA
452
467
491
507
531
TATAMOTORS
269
276
286
292
302
TATAPOWER
70
72
74
76
79
TATASTEEL
233
241
252
259
270
TCS
1,678
1,698
1,721
1,741
1,763
ULTRACEMCO
1,573
1,599
1,632
1,658
1,691
3
Daily Technical Report
August 22, 2013
Research Team Tel: 022 - 30940000
DISCLAIMER
This document is solely for the personal information of the recipient, and must not be singularly used as the basis of any investment
decision. Nothing in this document should be construed as investment or financial advice. Each recipient of this document should make
such investigations as they deem necessary to arrive at an independent evaluation of an investment in the securities of the companies
referred to in this document (including the merits and risks involved), and should consult their own advisors to determine the merits and
risks of such an investment.
Angel Broking Pvt. Limited, its affiliates, directors, its proprietary trading and investment businesses may, from time to time, make
investment decisions that are inconsistent with or contradictory to the recommendations expressed herein. The views contained in this
document are those of the analyst, and the company may or may not subscribe to all the views expressed within.
Reports based on technical and derivative analysis center on studying charts of a stock's price movement, outstanding positions and
trading volume, as opposed to focusing on a company's fundamentals and, as such, may not match with a report on a company's
fundamentals.
The information in this document has been printed on the basis of publicly available information, internal data and other reliable
sources believed to be true, but we do not represent that it is accurate or complete and it should not be relied on as such, as this
document is for general guidance only. Angel Broking Pvt. Limited or any of its affiliates/ group companies shall not be in any way
responsible for any loss or damage that may arise to any person from any inadvertent error in the information contained in this report.
Angel Broking Pvt. Limited has not independently verified all the information contained within this document. Accordingly, we cannot
testify, nor make any representation or warranty, express or implied, to the accuracy, contents or data contained within this document.
While Angel Broking Pvt. Limited endeavors to update on a reasonable basis the information discussed in this material, there may be
regulatory, compliance, or other reasons that prevent us from doing so.
This document is being supplied to you solely for your information, and its contents, information or data may not be reproduced,
redistributed or passed on, directly or indirectly.
Angel Broking Pvt. Limited and its affiliates may seek to provide or have engaged in providing corporate finance, investment banking
or other advisory services in a merger or specific transaction to the companies referred to in this report, as on the date of this report or
in the past.
Neither Angel Broking Pvt. Limited, nor its directors, employees or affiliates shall be liable for any loss or damage that may arise from
or in connection with the use of this information.
Note: Please refer to the important `Stock Holding Disclosure' report on the Angel website (Research Section). Also, please refer to the
latest update on respective stocks for the disclosure status in respect of those stocks. Angel Broking Pvt. Limited and its affiliates may
have investment positions in the stocks recommended in this report.
Research Team
Shardul Kulkarni
-
Head - Technicals
Sameet Chavan
-
Technical Analyst
Sacchitanand Uttekar
-
Technical Analyst
Angel Broking Pvt. Ltd.
Registered Office: G-1, Ackruti Trade Centre, Rd. No. 7, MIDC, Andheri (E), Mumbai - 400 093.
Corporate Office: 6th Floor, Ackruti Star, MIDC, Andheri (E), Mumbai - 400 093. Tel: (022) 30940000
Sebi Registration No: INB 010996539
4