Daily Technical Report
March 06, 2014
Sensex (21277) / Nifty (6329)
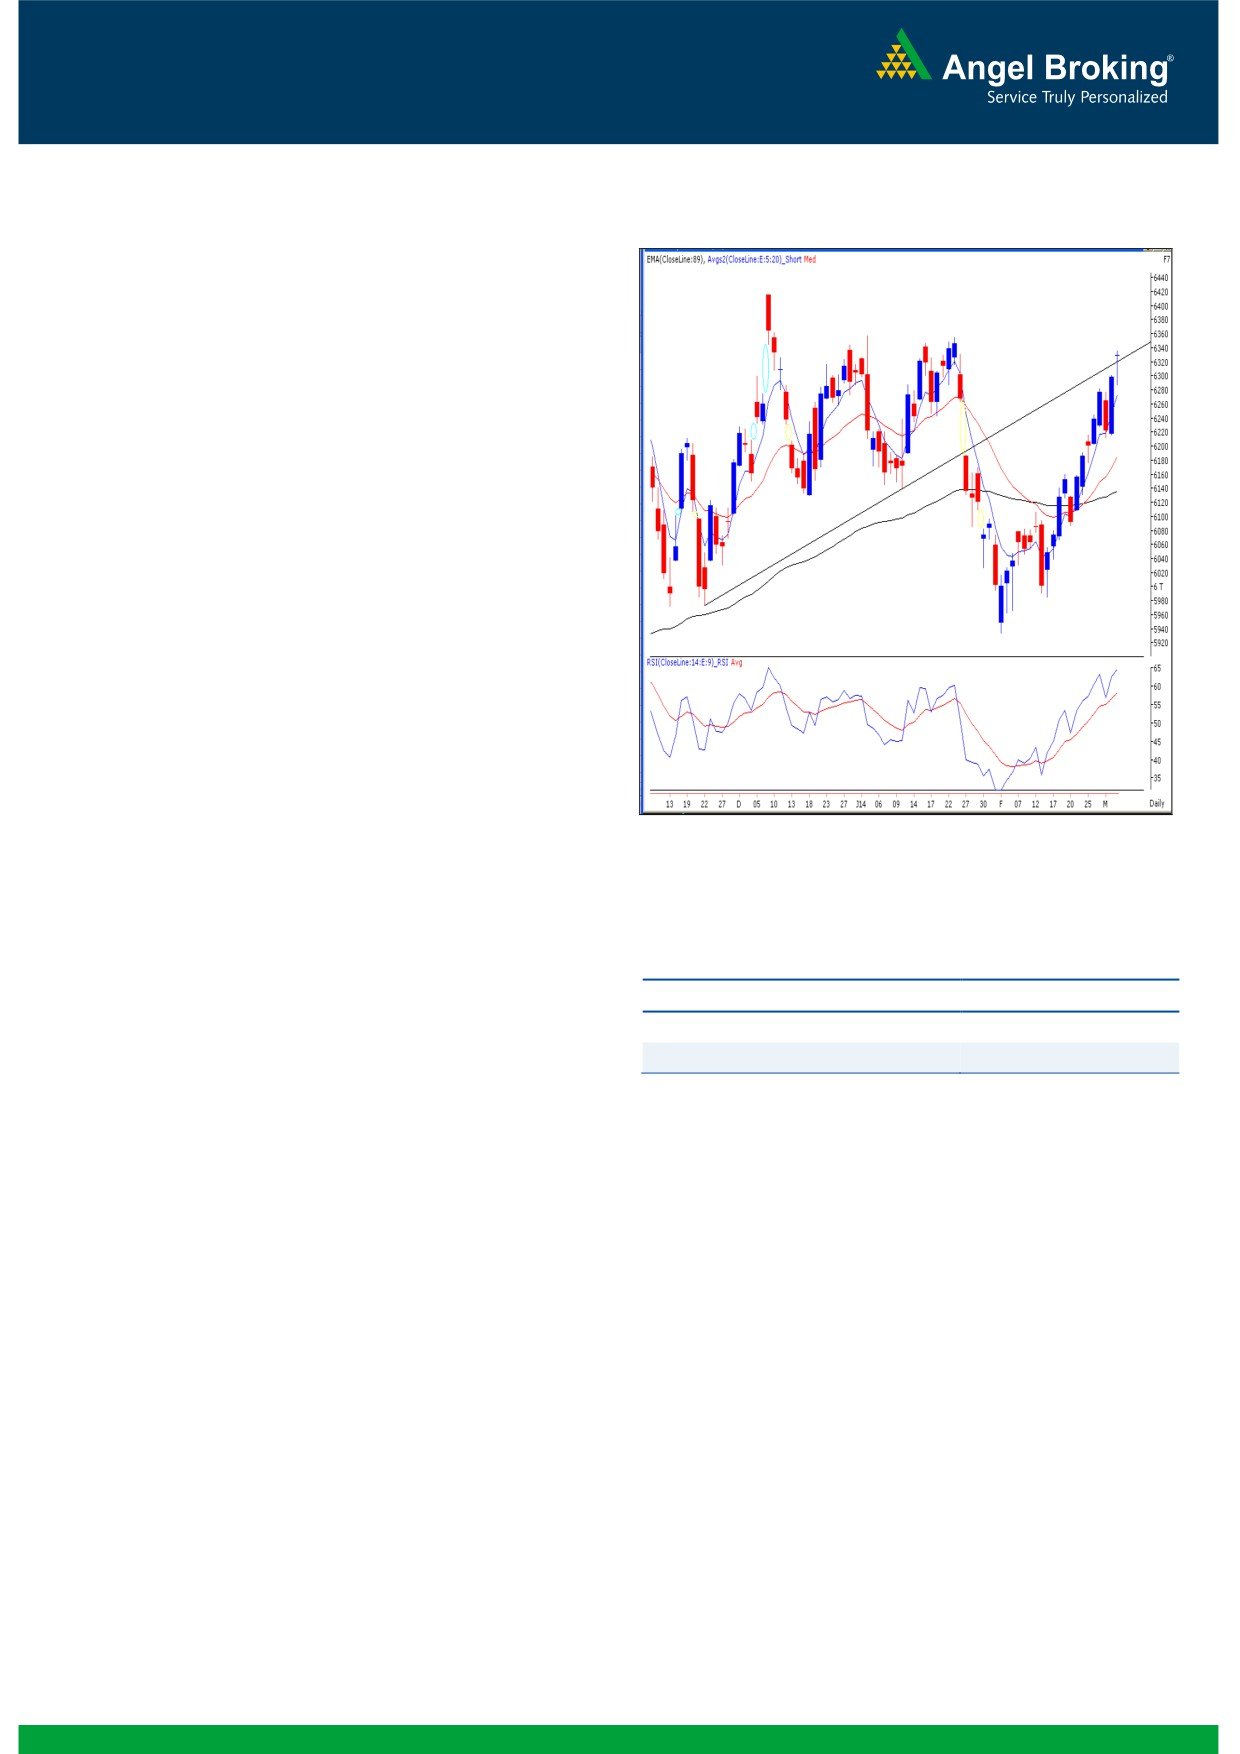
Exhibit 1: Nifty Daily Chart
Yesterday, our market opened higher as indicated by the SGX
Nifty early in the morning. After a slight correction at the
midsession, Nifty managed to recover sharply to post the
closing well above the 6300 mark. On the sectoral front, the
Consumer durables and Auto counters underperformed the
benchmark indices; whereas Banking, Realty and Capital
goods sectors were the major gainers. The advance to decline
ratio was in favor of advancing counters. (A=1461
Formation
The ’89-day EMA’ and the ’89-week EMA’ are placed at
20641 / 6136 and 19542 / 5852 levels, respectively.
The ’20-day EMA’ and the ‘20-week EMA’ are placed at
20814 / 6185 and 20675 / 6148 levels, respectively.
The 78.6% Fibonacci retracement level of the fall from
6355.60 (high on January 23, 2014) to 5933.30 (low on
February 04, 2014) is placed at 6265.
Source: Falcon
Trading strategy:
The market continued their optimism as they managed to
Actionable points:
recover smartly after sneaking marginally inside the negative
territory. The overall intraday movement was narrow as
View
Neutral
compared to the massive rally seen in many individual stocks.
Support Levels
6287 - 6220
Also, the daily chart now exhibits 'Long Legged Doji' Japanese
Resistance Levels
6356 - 6415
candlestick pattern near the important resistance level 6356
and 'Trend Line' resistance of 6320. The said pattern will get
activated below the yesterday’s low of 6287. In this scenario,
we can expect a correction towards 6220 - 6200 levels. On
the flipside, 6356 remains to be an importance resistance level
for the index.
1
Daily Technical Report
March 06, 2014
Bank Nifty Outlook - (11099)
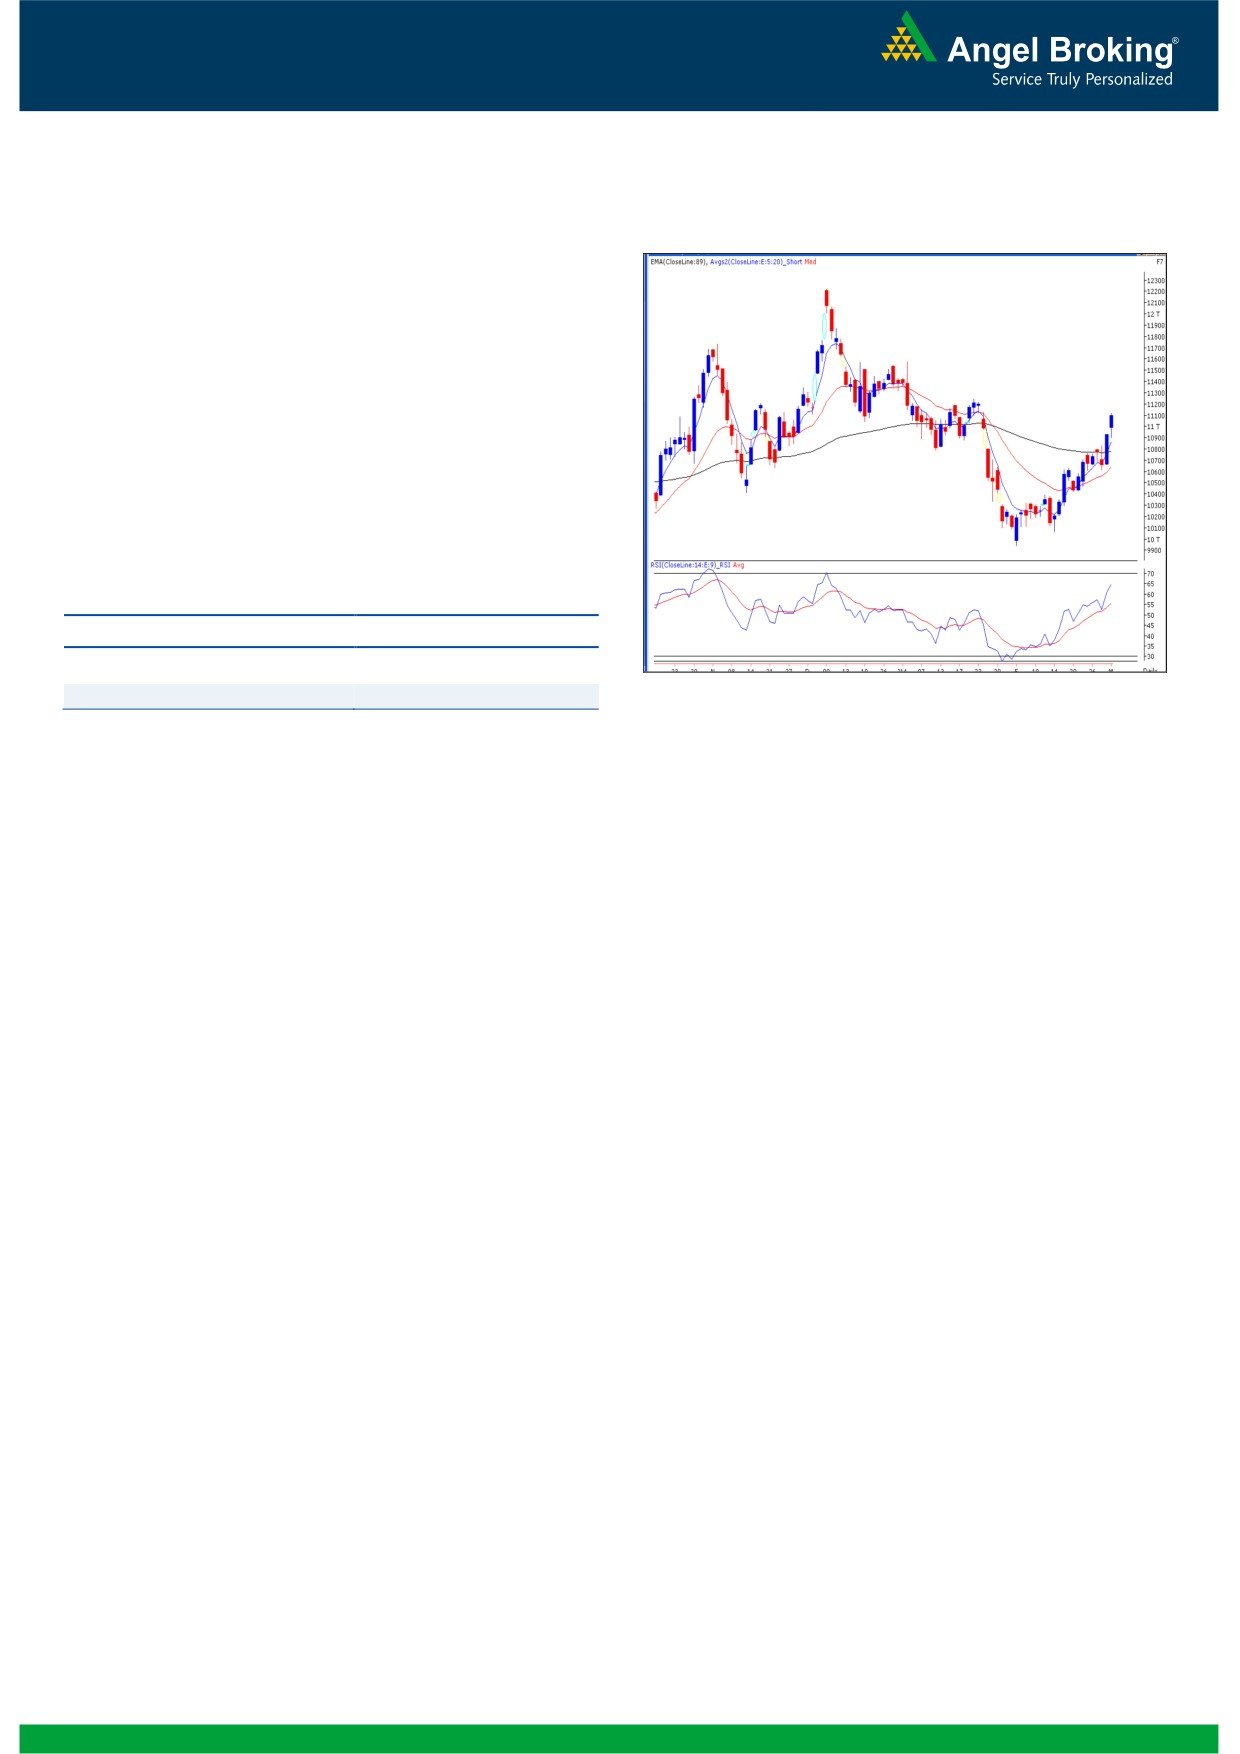
Exhibit 2: Bank Nifty Daily Chart
On Tuesday, the Bank Nifty too opened slightly higher in
line with the benchmark index. Once again it was the
banking counters who kept the benchmark index in the
positive territory. If the persistent buying interest continues
then the Bank Nifty may test 11200 - 11250 levels in the
coming trading session. On the other hand, 10899 would
act as a key support level for the index in coming trading
sessions.
Actionable points:
View
Neutral
Support Level
10899 - 10800
Source: Falcon
Resistance levels
11200 - 11250
2
Daily Technical Report
March 06, 2014
Research Team Tel: 022 - 30940000
DISCLAIMER
This document is solely for the personal information of the recipient, and must not be singularly used as the basis of any investment
decision. Nothing in this document should be construed as investment or financial advice. Each recipient of this document should make
such investigations as they deem necessary to arrive at an independent evaluation of an investment in the securities of the companies
referred to in this document (including the merits and risks involved), and should consult their own advisors to determine the merits and
risks of such an investment.
Angel Broking Pvt. Limited, its affiliates, directors, its proprietary trading and investment businesses may, from time to time, make
investment decisions that are inconsistent with or contradictory to the recommendations expressed herein. The views contained in this
document are those of the analyst, and the company may or may not subscribe to all the views expressed within.
Reports based on technical and derivative analysis center on studying charts of a stock's price movement, outstanding positions and
trading volume, as opposed to focusing on a company's fundamentals and, as such, may not match with a report on a company's
fundamentals.
The information in this document has been printed on the basis of publicly available information, internal data and other reliable
sources believed to be true, but we do not represent that it is accurate or complete and it should not be relied on as such, as this
document is for general guidance only. Angel Broking Pvt. Limited or any of its affiliates/ group companies shall not be in any way
responsible for any loss or damage that may arise to any person from any inadvertent error in the information contained in this report.
Angel Broking Pvt. Limited has not independently verified all the information contained within this document. Accordingly, we cannot
testify, nor make any representation or warranty, express or implied, to the accuracy, contents or data contained within this document.
While Angel Broking Pvt. Limited endeavors to update on a reasonable basis the information discussed in this material, there may be
regulatory, compliance, or other reasons that prevent us from doing so.
This document is being supplied to you solely for your information, and its contents, information or data may not be reproduced,
redistributed or passed on, directly or indirectly.
Angel Broking Pvt. Limited and its affiliates may seek to provide or have engaged in providing corporate finance, investment banking
or other advisory services in a merger or specific transaction to the companies referred to in this report, as on the date of this report or
in the past.
Neither Angel Broking Pvt. Limited, nor its directors, employees or affiliates shall be liable for any loss or damage that may arise from
or in connection with the use of this information.
Note: Please refer to the important `Stock Holding Disclosure' report on the Angel website (Research Section). Also, please refer to the
latest update on respective stocks for the disclosure status in respect of those stocks. Angel Broking Pvt. Limited and its affiliates may
have investment positions in the stocks recommended in this report.
Research Team
Sameet Chavan
-
Technical Analyst
Angel Broking Pvt. Ltd.
Registered Office: G-1, Ackruti Trade Centre, Rd. No. 7, MIDC, Andheri (E), Mumbai - 400 093.
Corporate Office: 6th Floor, Ackruti Star, MIDC, Andheri (E), Mumbai - 400 093. Tel: (022) 30940000
Sebi Registration No: INB 010996539
4