Daily Technical Report
February 06, 2014
Sensex (20261) / Nifty (6022)
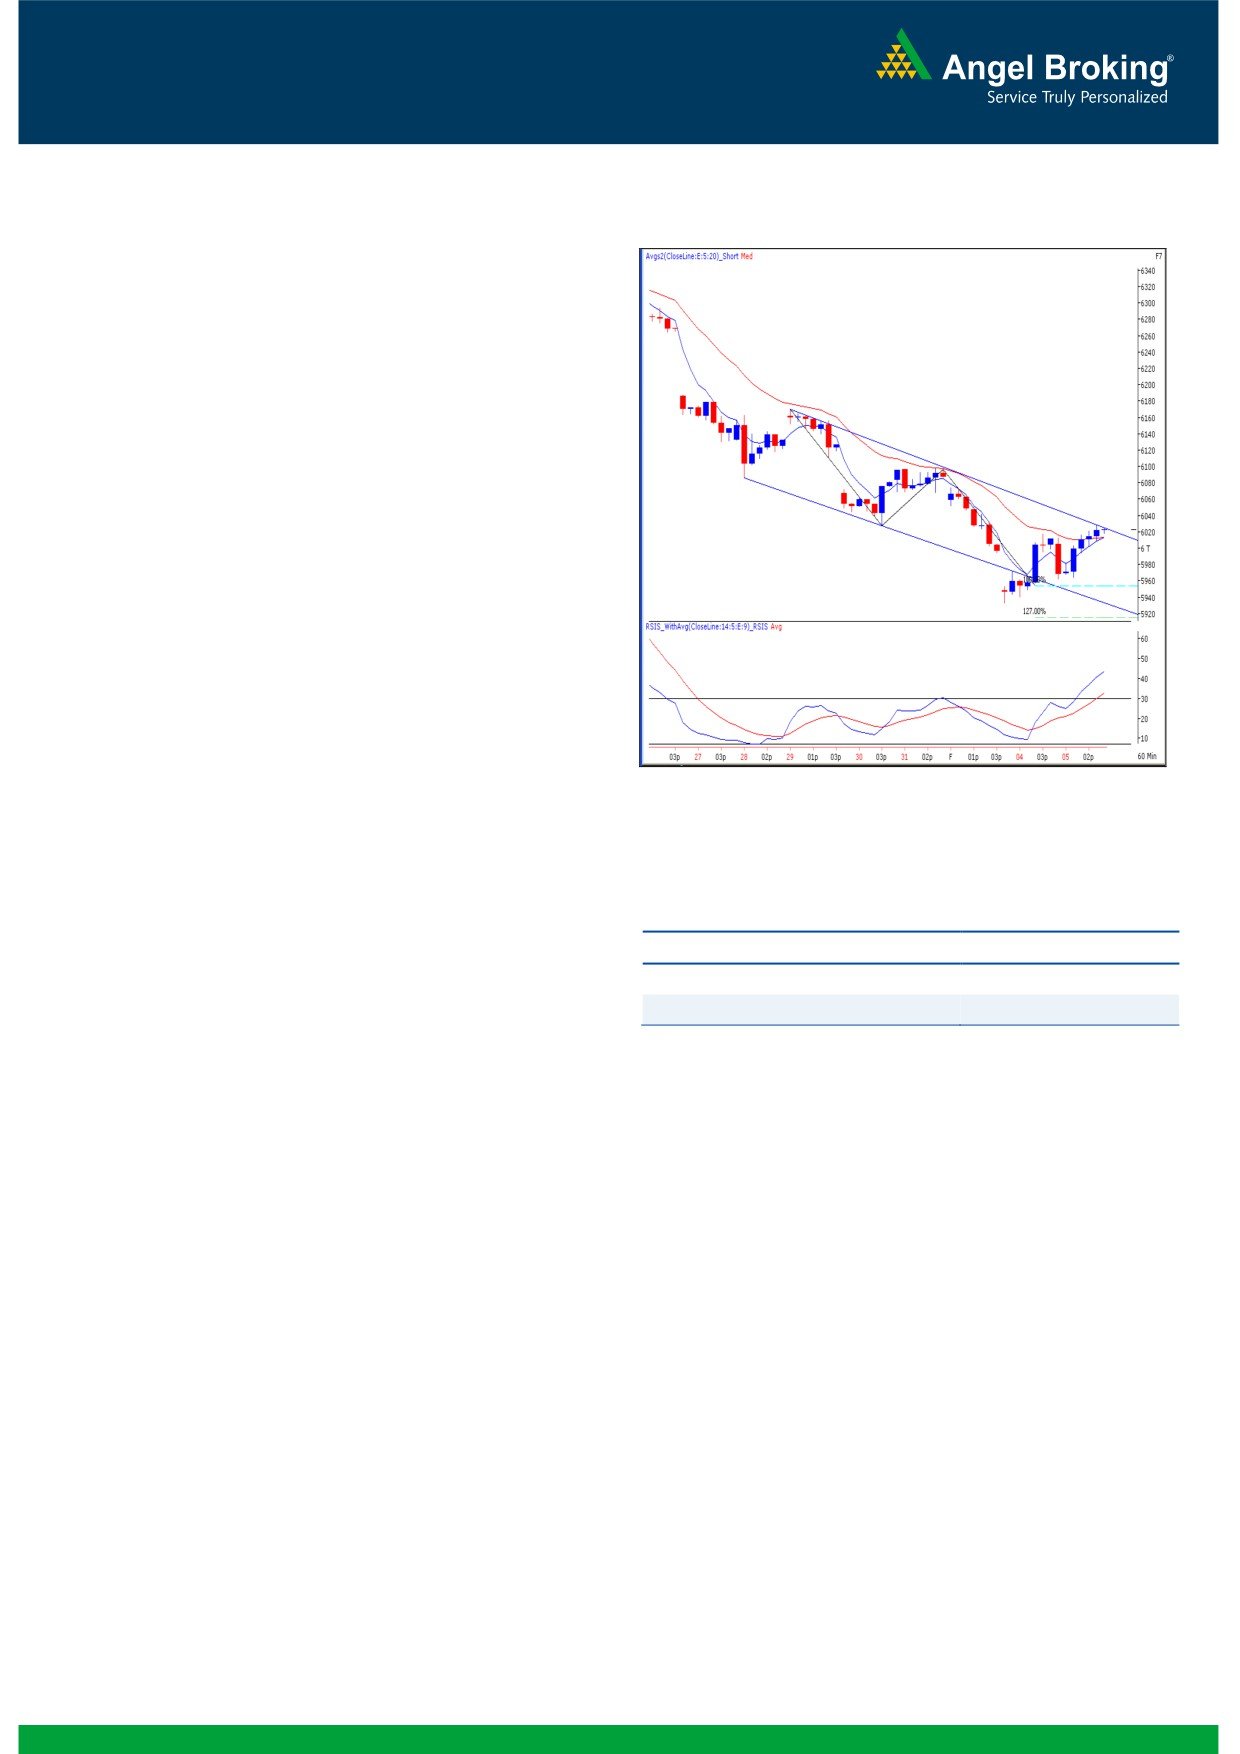
Exhibit 1: Nifty Hourly Chart
Yesterday, we witnessed a flat opening considering quiet
trading mood across the globe. Once again, our benchmark
index faced tremendous selling pressure during the initial hour;
but the Nifty found decent buying interest near day’s low,
which pushed the index higher to close at the highest point of
the day. On the sectoral front, the FMCG and Oil & Gas
counters closed in the red; whereas the Metal and Realty
counters were among the major gainers. The advance to
decline ratio was strongly in favor of the advancing counters.
Formation
The ’89-day EMA’ and the ’89-week EMA’ are placed at
20607 / 6127 and 19414 / 5817 levels, respectively.
The ’20-day EMA’ and the ‘20-week EMA’ are placed at
20724 / 6154 and 20551 / 6111 levels, respectively.
The ‘Shooting Star’ pattern on the weekly chart has now
been confirmed.
Source: Falcon
The Weekly ‘RSI-Smoothened’ and the ‘ADX (9)’ indicator
are now signaling a negative crossover
Actionable points:
View
Neutral
Trading strategy:
Support Levels
5970 - 5933
A volatile session on Tuesday was followed by a muted
Resistance Levels
6075 - 6100
opening in our market. The bears then completely dominated
the initial hour and in the process, our benchmark index
trimmed nearly half a percent. However, the bulls successfully
managed to defend the market around the 61.8% Fibonacci
retracement level of Tuesday's entire range. In the process, we
witnessed a gradual recovery to close almost at the highest
point of the day. The Nifty has now traversed an hourly '20
EMA' level of 6013. This price action confirmed a 'Higher Top
Higher Bottom' formation on the hourly chart, which is a sign
of strength and hence, increases the possibility of an expected
bounce towards 6075 - 6100 levels. On the flip-side, 5970 -
5930 levels remains to be a key support zone for our
benchmark index.
1
Daily Technical Report
February 06, 2014
Bank Nifty Outlook - (10232)
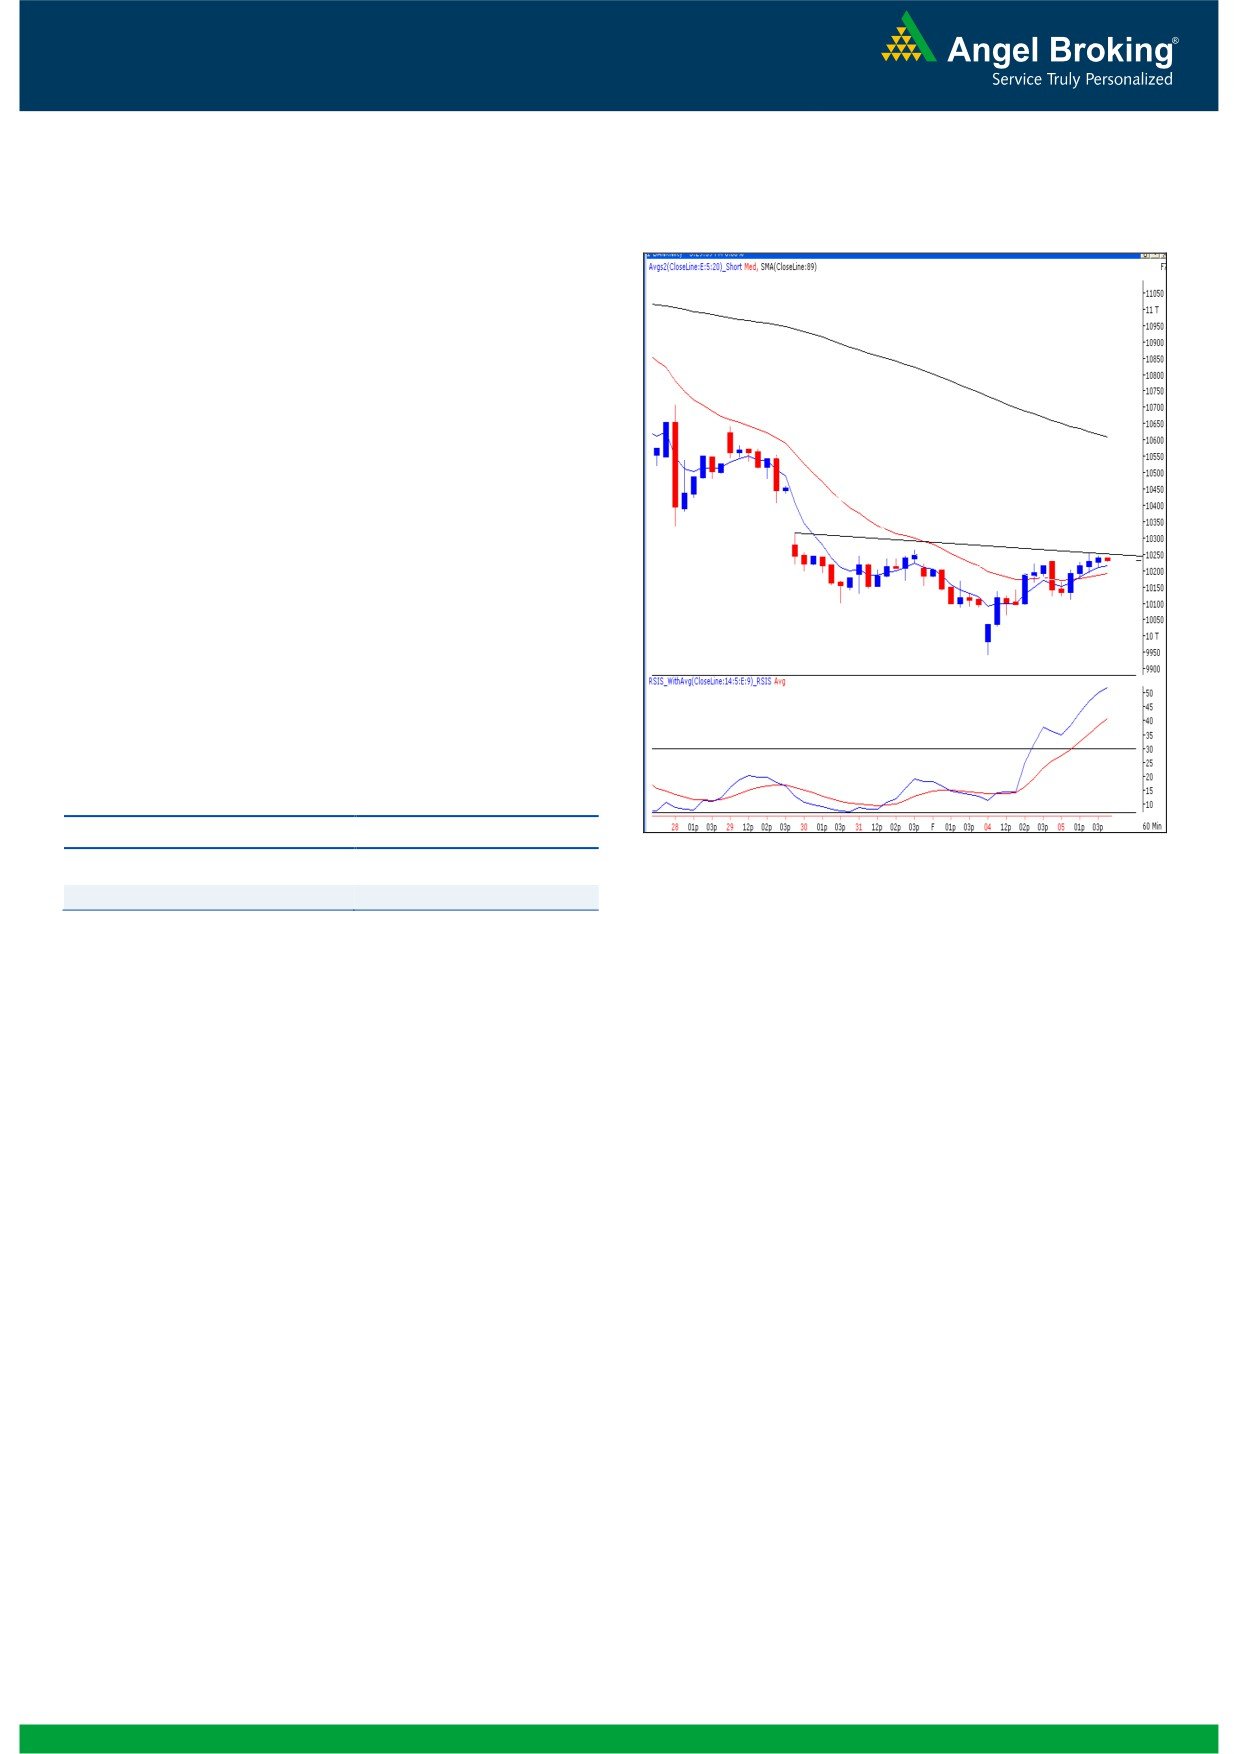
Exhibit 2: Bank Nifty Hourly Chart
Yesterday, the Bank Nifty too opened quietly in-line with
our benchmark index and immediately shed nearly a
percent in the initial trades. As mentioned in our previous
report, the Bank Nifty found a decent support slightly
above the 10100 mark. The buying interest picked up as
the day progressed, which led the banking index to close
marginally below the hourly swing high of
10267.
Looking at the hourly chart, it is clearly seen that the Bank
Nifty has formed a 'Bullish Inverse Head & Shoulder'
pattern. The said pattern would be confirmed once the
index sustains above 10267 level. In this scenario, we
may expect the index to rally towards the theoretical
target of the pattern i.e. 10400 - 10450 levels. On the
flip-side, 10100 - 9944 levels would act as key supports
in coming trading session.
Actionable points:
View
Neutral
Support Levels
10100 - 9944
Source: Falcon
Resistance levels
10400 - 10450
2
Daily Technical Report
February 06, 2014
Research Team Tel: 022 - 30940000
DISCLAIMER
This document is solely for the personal information of the recipient, and must not be singularly used as the basis of any investment
decision. Nothing in this document should be construed as investment or financial advice. Each recipient of this document should make
such investigations as they deem necessary to arrive at an independent evaluation of an investment in the securities of the companies
referred to in this document (including the merits and risks involved), and should consult their own advisors to determine the merits and
risks of such an investment.
Angel Broking Pvt. Limited, its affiliates, directors, its proprietary trading and investment businesses may, from time to time, make
investment decisions that are inconsistent with or contradictory to the recommendations expressed herein. The views contained in this
document are those of the analyst, and the company may or may not subscribe to all the views expressed within.
Reports based on technical and derivative analysis center on studying charts of a stock's price movement, outstanding positions and
trading volume, as opposed to focusing on a company's fundamentals and, as such, may not match with a report on a company's
fundamentals.
The information in this document has been printed on the basis of publicly available information, internal data and other reliable
sources believed to be true, but we do not represent that it is accurate or complete and it should not be relied on as such, as this
document is for general guidance only. Angel Broking Pvt. Limited or any of its affiliates/ group companies shall not be in any way
responsible for any loss or damage that may arise to any person from any inadvertent error in the information contained in this report.
Angel Broking Pvt. Limited has not independently verified all the information contained within this document. Accordingly, we cannot
testify, nor make any representation or warranty, express or implied, to the accuracy, contents or data contained within this document.
While Angel Broking Pvt. Limited endeavors to update on a reasonable basis the information discussed in this material, there may be
regulatory, compliance, or other reasons that prevent us from doing so.
This document is being supplied to you solely for your information, and its contents, information or data may not be reproduced,
redistributed or passed on, directly or indirectly.
Angel Broking Pvt. Limited and its affiliates may seek to provide or have engaged in providing corporate finance, investment banking
or other advisory services in a merger or specific transaction to the companies referred to in this report, as on the date of this report or
in the past.
Neither Angel Broking Pvt. Limited, nor its directors, employees or affiliates shall be liable for any loss or damage that may arise from
or in connection with the use of this information.
Note: Please refer to the important `Stock Holding Disclosure' report on the Angel website (Research Section). Also, please refer to the
latest update on respective stocks for the disclosure status in respect of those stocks. Angel Broking Pvt. Limited and its affiliates may
have investment positions in the stocks recommended in this report.
Research Team
Sameet Chavan
-
Technical Analyst
Angel Broking Pvt. Ltd.
Registered Office: G-1, Ackruti Trade Centre, Rd. No. 7, MIDC, Andheri (E), Mumbai - 400 093.
Corporate Office: 6th Floor, Ackruti Star, MIDC, Andheri (E), Mumbai - 400 093. Tel: (022) 30940000
Sebi Registration No: INB 010996539
4