Daily Technical Report
September 05, 2013
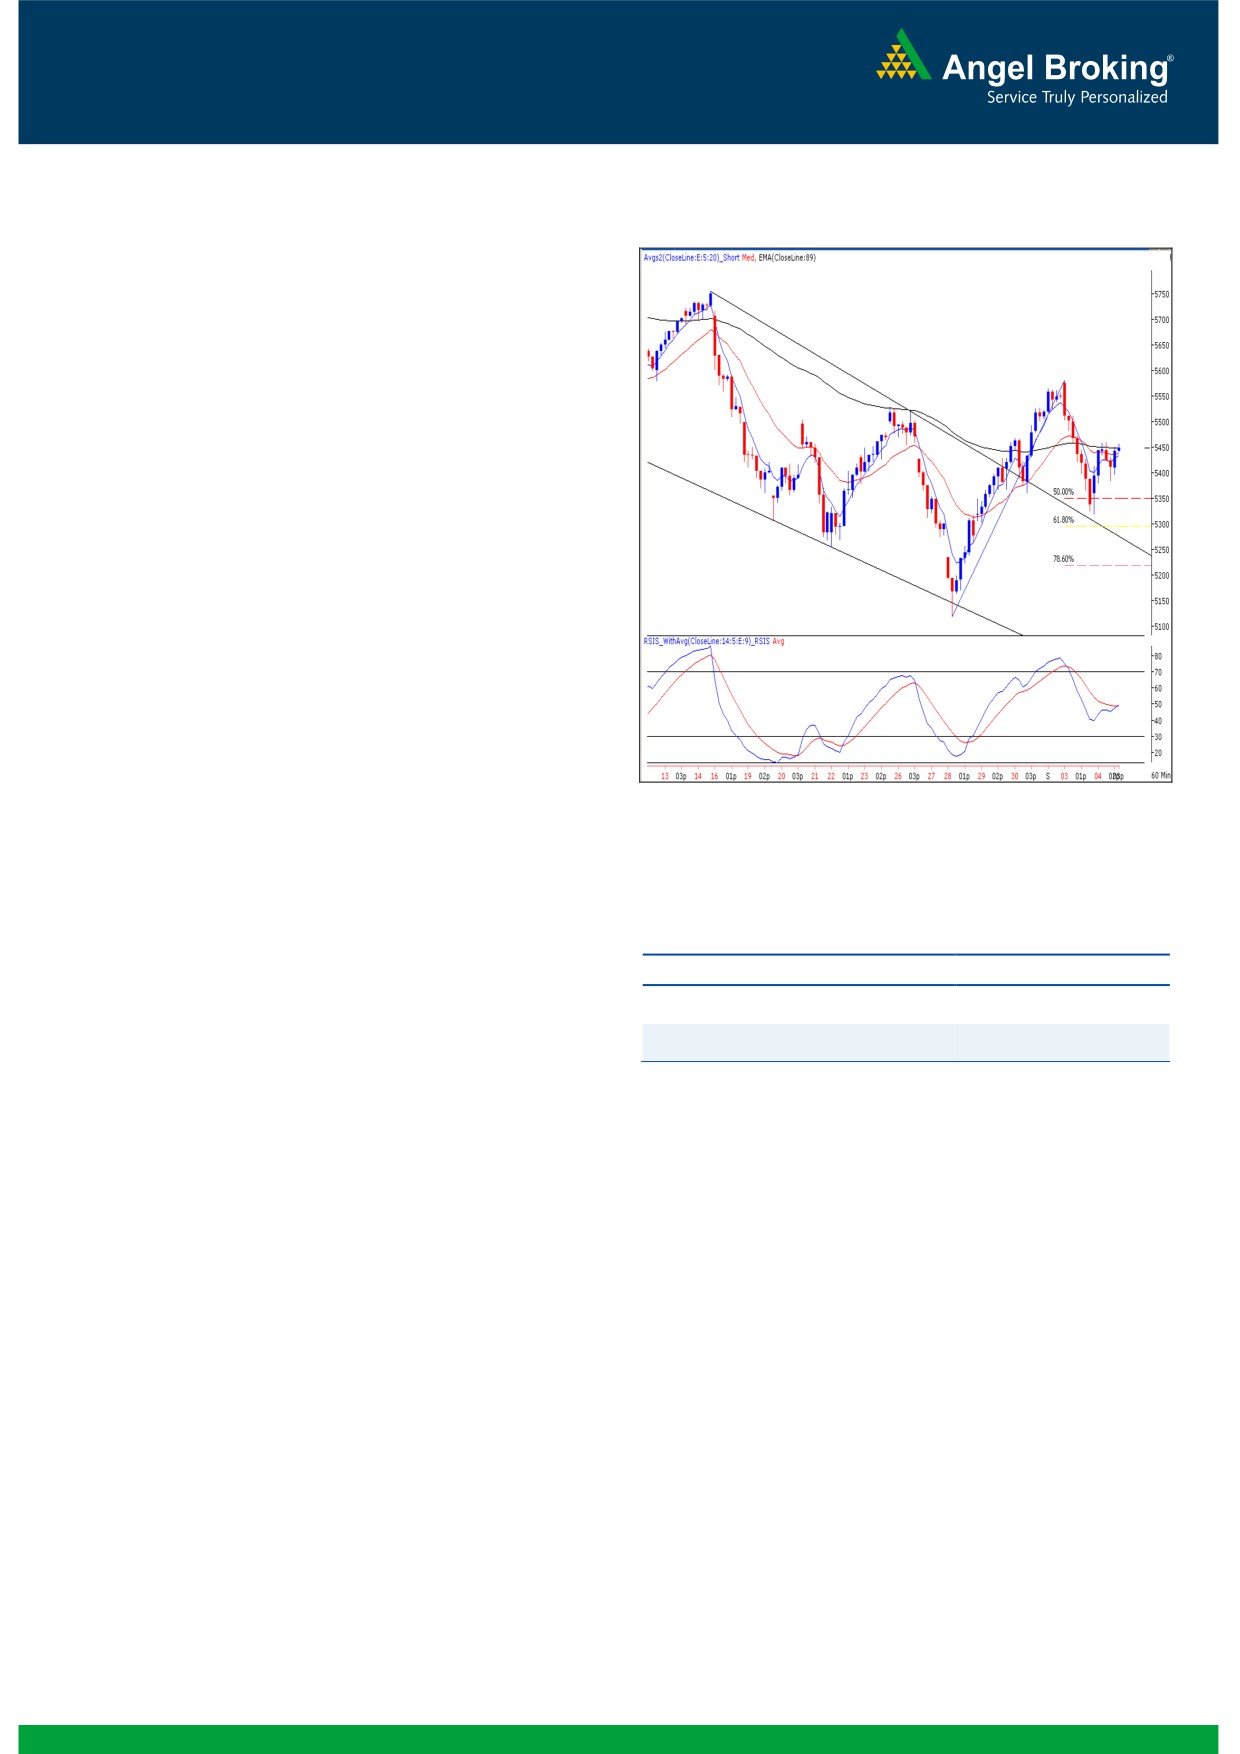
Exhibit 1: Nifty Hourly Chart
Sensex (18568) / NIFTY (5448)
Yesterday, our benchmark indices opened on a flat note and
rallied during the first half. Subsequently, post a small
correction during the mid session, the market surged higher to
close at the highest point of the day. Apart from Realty, all the
other sectors ended in the positive territory. The Metal,
Healthcare and Auto counters dominated the rally. The
advance to decline ratio was strongly in favor of advancing
Formation
The ’89-day EMA’ and the ’89-week EMA’ are placed at
19124 / 5719 and 18608 / 5610 levels, respectively.
The ’20-day EMA’ and the ‘20-week EMA’ are placed at
18622/ 5496 and 19125 / 5715 levels, respectively.
The monthly ‘RSI-Smoothened’ oscillator is still negatively
poised; whereas the weekly ‘Stochastic’ momentum
oscillator has given a positive crossover.
Source: Falcon:
The weekly chart depicts yet another ‘Bullish Hammer’
Japanese candlestick pattern.
The ‘Lower Top - Lower Bottom’ formation in weekly chart
Actionable points:
is still intact.
View
Bullish above 5461
Expected targets
5500 - 5565
Trading strategy:
Support levels
5383 - 5318
As expected and mentioned in yesterdays report, the Nifty
found a decent support around 5295 level, which is the upper
trend line level of the ‘Channel’ pattern formed in an hourly
chart. This level also coincides with the 61.8% Fibonacci
retracement level of rise from
5118 to
5581. At this
juncture, the hourly “89 EMA” is the immediate resistance
level for the Index. This level is near to the 5450 mark.
Going forward, we are of the opinion that if Nifty manages
to stay above yesterdays high of 5461, then we may witness
a surge towards 5500 - 5565 levels. On the flipside, 5383
- 5318 remains to be an immediate support for the index.
1
Daily Technical Report
September 05, 2013
Bank Nifty Outlook - (8846)
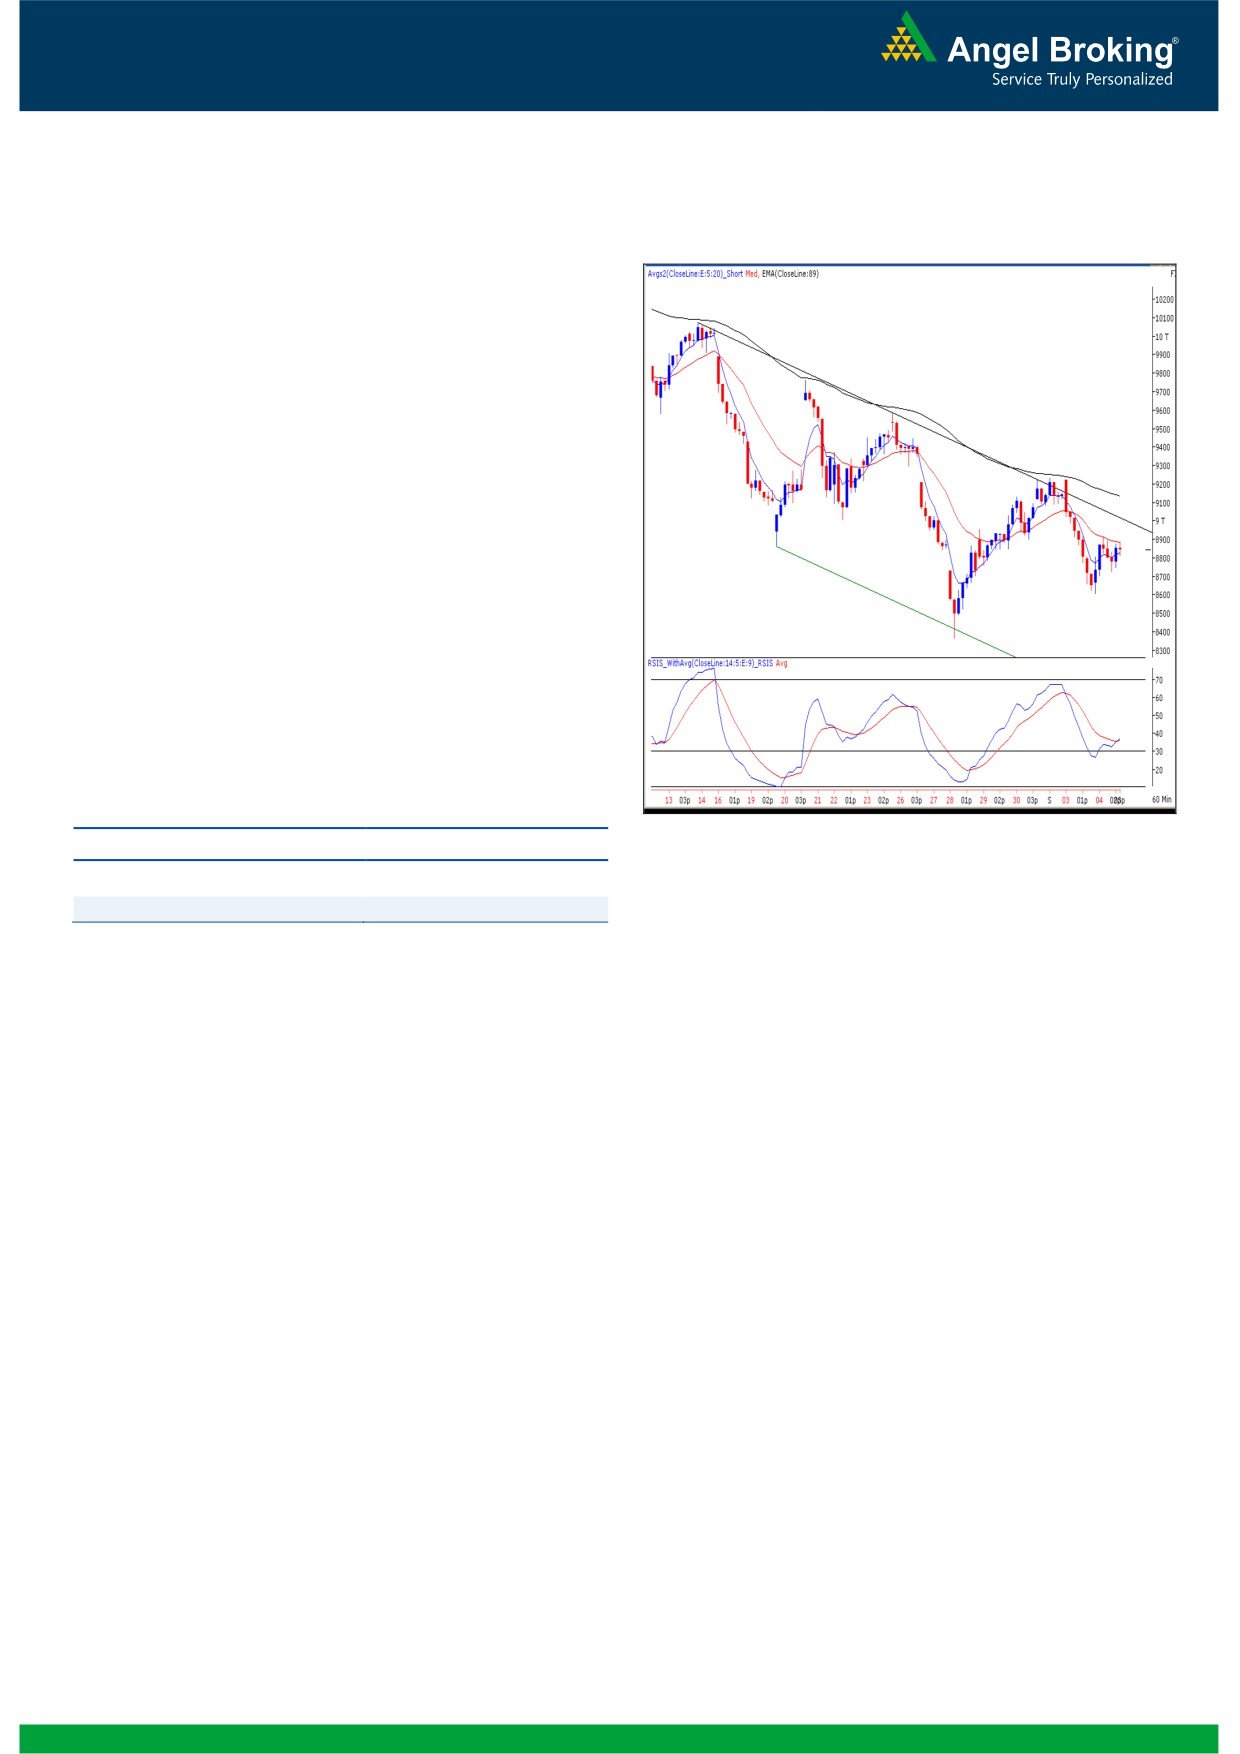
Exhibit 2: Bank Nifty Hourly Chart
Yesterday, unlike our benchmark indices the Bank Nifty
opened on a quiet note. The 78.6% Fibonacci retracement
level of 8552 provided significant support for the index and
buying interest around this support eventually led to a closing
at the highest point of the session. Considering the price
action in hourly chart, we are of the view that if index sustains
above 8917 then we may expect a rally towards 9000 - 9100
levels. These levels coincide with the upper band of the'
Channel' (please refer the exhibit) pattern formed in an hourly
chart. A move and close beyond the 9100 would result in a
strong breakout on the higher degree charts and would signal
a reversal of the ongoing downtrend. On the flipside, 8728 -
8606 levels would act as important supports in coming
trading session.
Actionable points:
View
Bullish above 8917
Source: Falcon:
Expected targets
9000 - 9100
Support Levels
8728 - 8606
2
Daily Technical Report
September 05, 2013
Research Team Tel: 022 - 30940000
DISCLAIMER
This document is solely for the personal information of the recipient, and must not be singularly used as the basis of any investment
decision. Nothing in this document should be construed as investment or financial advice. Each recipient of this document should make
such investigations as they deem necessary to arrive at an independent evaluation of an investment in the securities of the companies
referred to in this document (including the merits and risks involved), and should consult their own advisors to determine the merits and
risks of such an investment.
Angel Broking Pvt. Limited, its affiliates, directors, its proprietary trading and investment businesses may, from time to time, make
investment decisions that are inconsistent with or contradictory to the recommendations expressed herein. The views contained in this
document are those of the analyst, and the company may or may not subscribe to all the views expressed within.
Reports based on technical and derivative analysis center on studying charts of a stock's price movement, outstanding positions and
trading volume, as opposed to focusing on a company's fundamentals and, as such, may not match with a report on a company's
fundamentals.
The information in this document has been printed on the basis of publicly available information, internal data and other reliable
sources believed to be true, but we do not represent that it is accurate or complete and it should not be relied on as such, as this
document is for general guidance only. Angel Broking Pvt. Limited or any of its affiliates/ group companies shall not be in any way
responsible for any loss or damage that may arise to any person from any inadvertent error in the information contained in this report.
Angel Broking Pvt. Limited has not independently verified all the information contained within this document. Accordingly, we cannot
testify, nor make any representation or warranty, express or implied, to the accuracy, contents or data contained within this document.
While Angel Broking Pvt. Limited endeavors to update on a reasonable basis the information discussed in this material, there may be
regulatory, compliance, or other reasons that prevent us from doing so.
This document is being supplied to you solely for your information, and its contents, information or data may not be reproduced,
redistributed or passed on, directly or indirectly.
Angel Broking Pvt. Limited and its affiliates may seek to provide or have engaged in providing corporate finance, investment banking
or other advisory services in a merger or specific transaction to the companies referred to in this report, as on the date of this report or
in the past.
Neither Angel Broking Pvt. Limited, nor its directors, employees or affiliates shall be liable for any loss or damage that may arise from
or in connection with the use of this information.
Note: Please refer to the important `Stock Holding Disclosure' report on the Angel website (Research Section). Also, please refer to the
latest update on respective stocks for the disclosure status in respect of those stocks. Angel Broking Pvt. Limited and its affiliates may
have investment positions in the stocks recommended in this report.
Research Team
Shardul Kulkarni
-
Head - Technicals
Sameet Chavan
-
Technical Analyst
Sacchitanand Uttekar
-
Technical Analyst
Angel Broking Pvt. Ltd.
Registered Office: G-1, Ackruti Trade Centre, Rd. No. 7, MIDC, Andheri (E), Mumbai - 400 093.
Corporate Office: 6th Floor, Ackruti Star, MIDC, Andheri (E), Mumbai - 400 093. Tel: (022) 30940000
Sebi Registration No: INB 010996539
4