Daily Technical Report
December 04, 2013
Sensex (20855) / Nifty (6202)
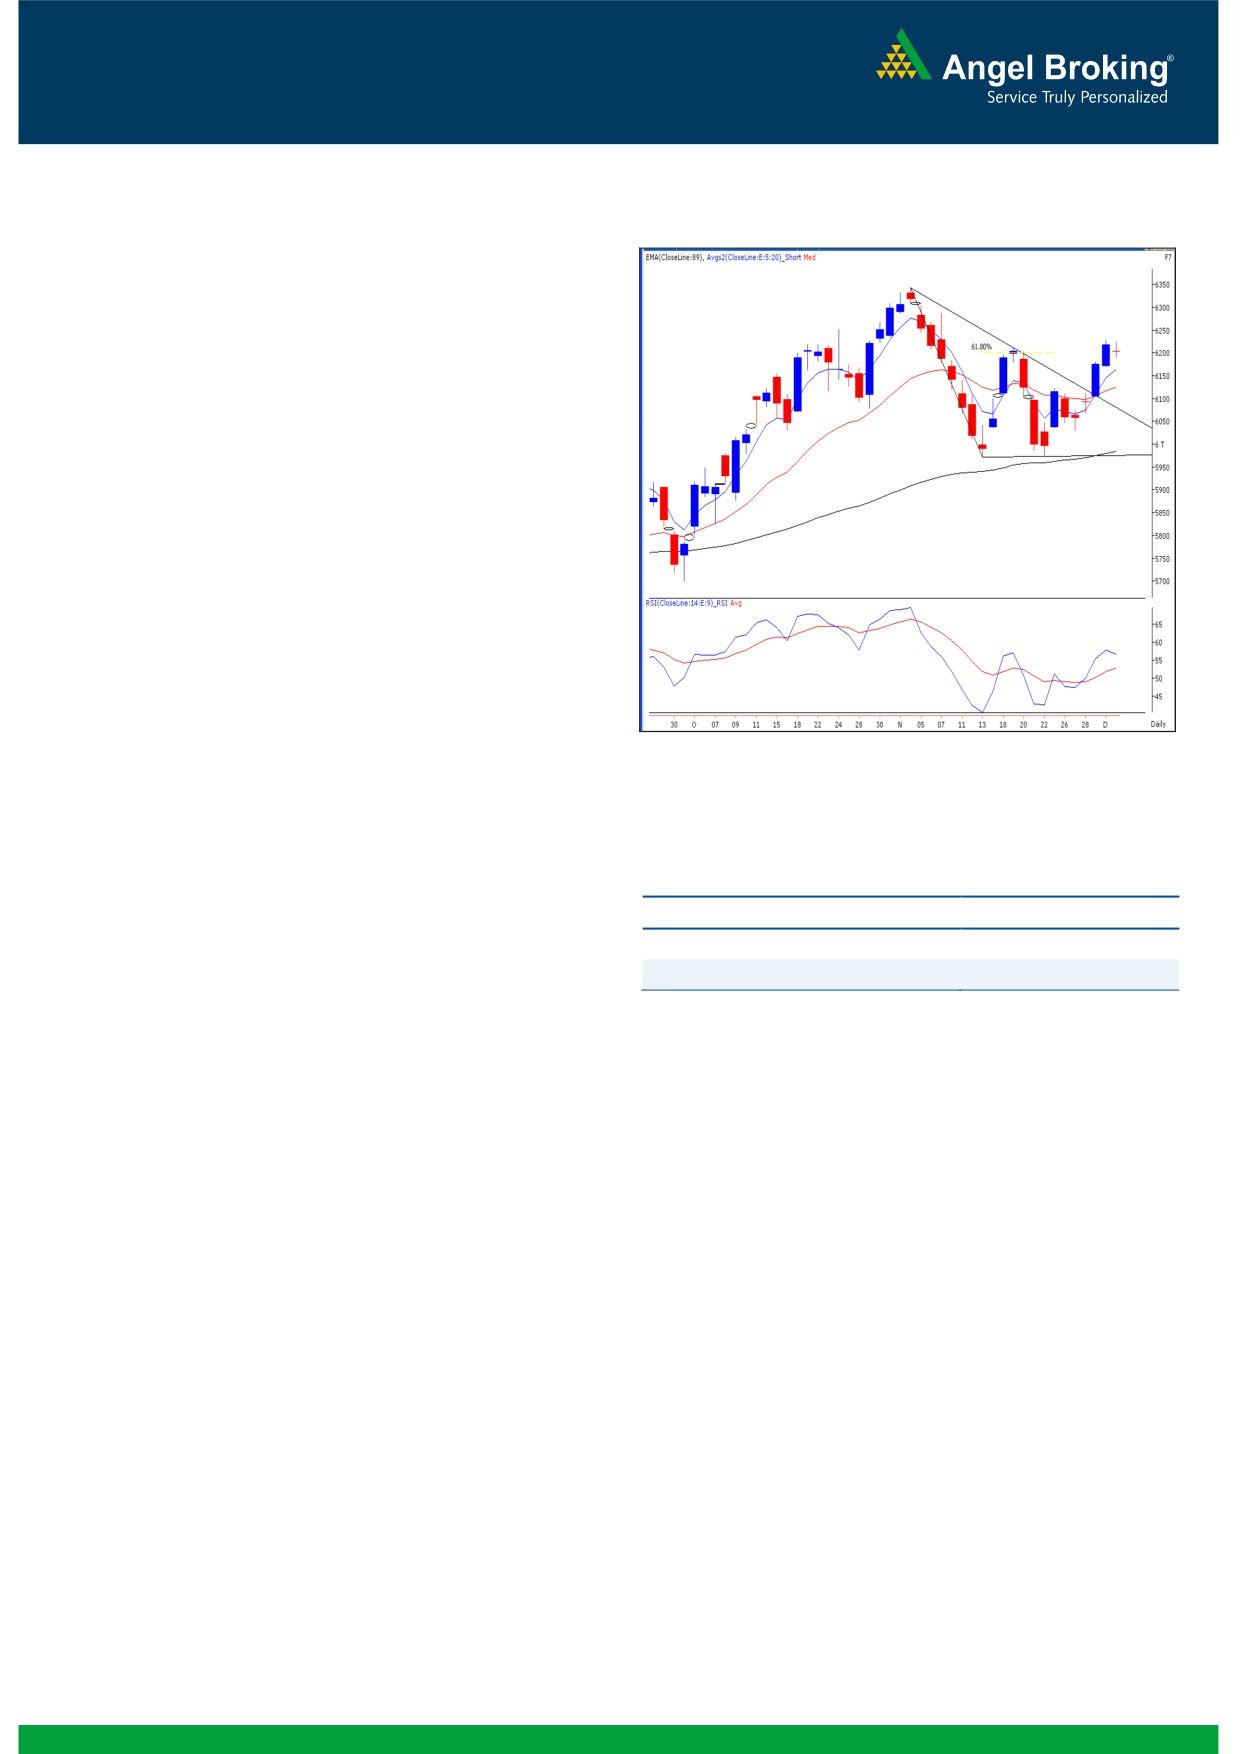
Exhibit 1: Nifty Daily Chart
On Tuesday, our benchmark indices opened tad lower on the
back of negative global cues. The entire day's price action was
a replica of Monday’s second half, where the Nifty traded in a
very narrow range to close with minor losses. The Realty, Oil &
Gas and Metal sectors outperformed our benchmark index;
whereas the FMCG, Consumer Durables and Banking counters
closed with nominal losses. The advance to decline ratio was
marginally in favor of the advancing counters. (A=1244
Formation
The ’89-day EMA’ and the ’89-week EMA’ are placed at
20129 / 5985 and 19093 / 5732 levels, respectively.
The ’20-day EMA’ and the ‘20-week EMA’ are placed at
20625 / 6125 and 20177 / 6001 levels, respectively.
The monthly momentum oscillators are still positively
poised.
Source: Falcon
On the daily chart, we are now observing a breakout from
the ‘Triangular’ pattern.
Actionable points:
Trading strategy:
View
Bearish below 6165
After a decent up move seen over the past couple of trading
Expected Targets
6103 - 6068
sessions, the market is consolidating. Yesterday the index
Resistance Levels
6229 - 6289
oscillated within the minor trading range of half a percent
throughout the session. As a result, the daily chart now depicts
a 'Bearish Harami' Japanese candlestick pattern. More
importantly, the placement of this pattern can be seen precisely
at the 61.8% Fibonacci retracement level of the recent fall
(6342 - 5972). An occurrence of such pattern near a strong
resistance indicates significant uncertainty among market
participants. Although, the theoretical target of 'Triangular
Pattern' is still valid, we may witness loss of near term positive
momentum if the index sustains below 6171 level. In this
scenario, we expect a correction towards 6103 level. On the
flipside, the bearish Japanese candlestick pattern will get
negated above 6226 and we can then expect further up move
towards 6289 - 6357 levels.
1
Daily Technical Report
December 04, 2013
Bank Nifty Outlook - (11211)
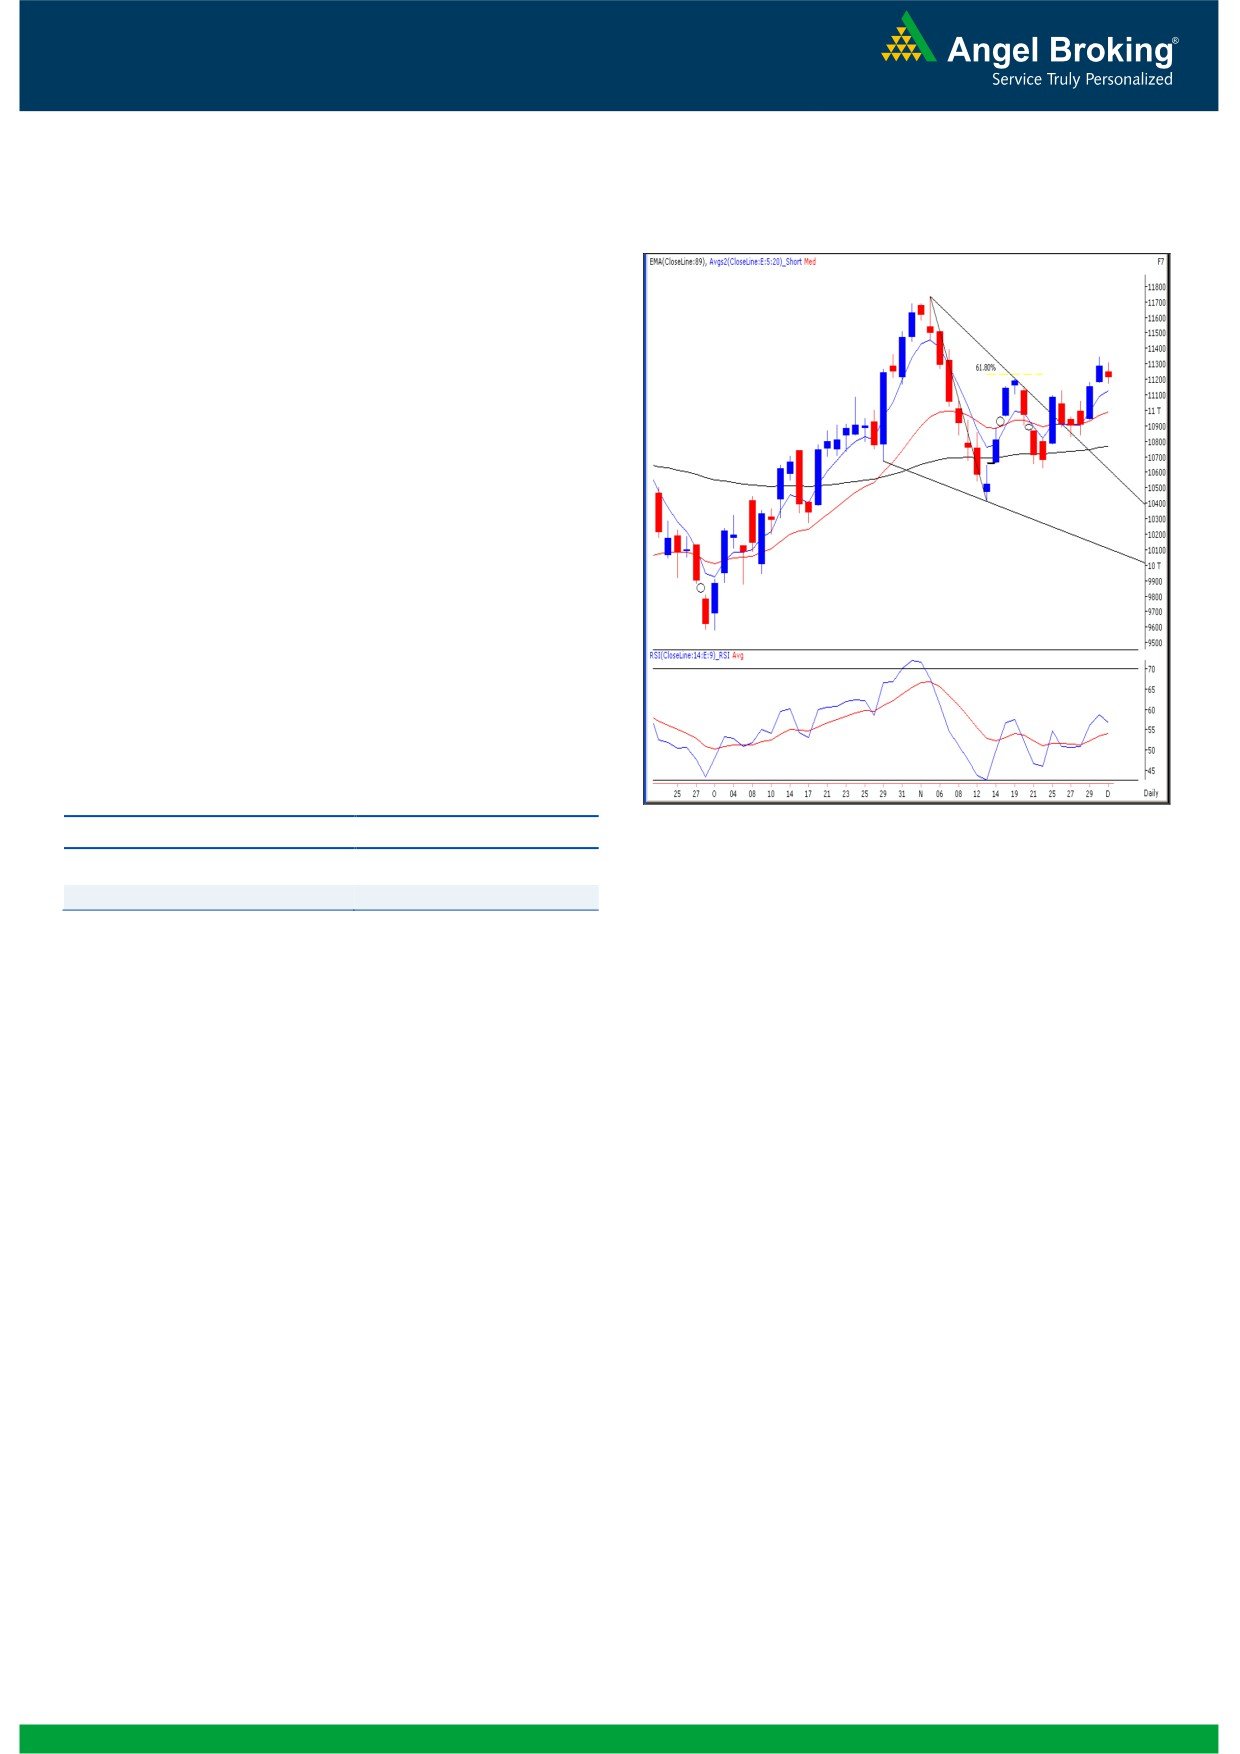
Exhibit 2: Bank Nifty Daily Chart
On Tuesday, in-line with our benchmark index, the Bank
Nifty too opened marginally lower and remained in a
sideways trading range throughout the session. In the last
couple of sessions the Bank Nifty has exactly replicated
the moves in the benchmark index and yesterday too we
are seeing a 'Bearish Harami' pattern in the daily charts of
this index. At present, the Bank Nifty is trading at the 61.8
% retracement level of the previous fall (11736 to 10412).
Hence, going forward, any sustainable move below
11174 may result in some weakness in the index. As a
result, we may witness a further correction towards 11100
- 10940 levels. On the flipside, any closing above 11348
would negate the said pattern and open up the
possibilities of further upside towards 11510 - 11600
levels.
Actionable points:
View
Bearish below 11174
Source: Falcon
Expected Targets
11100 - 10940
Resistance Levels
11348 - 11510
2
Daily Technical Report
December 04, 2013
Daily Pivot Levels for Nifty 50 Stocks
SCRIPS
S2
S1
PIVOT
R1
R2
SENSEX
20,757
20,806
20,867
20,915
20,976
NIFTY
6,172
6,187
6,206
6,221
6,240
BANKNIFTY
11,096
11,154
11,232
11,290
11,368
ACC
1,071
1,086
1,096
1,110
1,120
AMBUJACEM
181
183
186
189
191
ASIANPAINT
495
500
507
512
519
AXISBANK
1,166
1,180
1,190
1,204
1,214
BAJAJ-AUTO
1,932
1,943
1,954
1,964
1,975
BANKBARODA
637
642
650
656
663
BHARTIARTL
328
329
331
333
335
BHEL
156
160
162
167
169
BPCL
337
344
348
354
358
CAIRN
316
318
320
322
325
CIPLA
385
388
391
394
397
COALINDIA
266
268
272
274
277
DLF
148
152
155
158
161
DRREDDY
2,425
2,446
2,473
2,493
2,520
GAIL
330
336
340
347
350
GRASIM
2,609
2,636
2,663
2,690
2,716
HCLTECH
1,094
1,106
1,123
1,135
1,152
HDFC
810
816
821
827
832
HDFCBANK
647
652
657
661
666
HEROMOTOCO
2,007
2,029
2,054
2,076
2,102
HINDALCO
118
121
124
127
130
HINDUNILVR
574
577
580
583
586
ICICIBANK
1,067
1,076
1,088
1,097
1,109
IDFC
104
106
107
109
110
INDUSINDBK
418
422
428
431
437
INFY
3,303
3,326
3,343
3,366
3,382
ITC
315
317
320
322
324
JINDALSTEL
262
269
276
283
290
JPASSOCIAT
52
53
54
55
55
KOTAKBANK
747
753
760
766
774
LT
1,033
1,044
1,064
1,075
1,095
LUPIN
855
862
875
883
896
M&M
934
942
951
958
967
MARUTI
1,633
1,648
1,667
1,683
1,702
NMDC
131
134
136
139
141
NTPC
144
145
146
147
148
ONGC
288
290
293
295
297
PNB
543
550
556
562
568
POWERGRID
93
93
94
94
94
RANBAXY
438
446
451
458
463
RELIANCE
845
853
859
868
874
RELINFRA
422
426
431
435
440
SBIN
1,792
1,803
1,816
1,827
1,841
SESAGOA
177
179
183
185
188
SUNPHARMA
579
586
594
601
609
TATAMOTORS
391
395
399
403
408
TATAPOWER
78
79
80
81
82
TATASTEEL
402
406
409
413
415
TCS
1,999
2,010
2,026
2,037
2,053
ULTRACEMCO
1,867
1,882
1,898
1,913
1,929
3
Daily Technical Report
December 04, 2013
Research Team Tel: 022 - 30940000
DISCLAIMER
This document is solely for the personal information of the recipient, and must not be singularly used as the basis of any investment
decision. Nothing in this document should be construed as investment or financial advice. Each recipient of this document should make
such investigations as they deem necessary to arrive at an independent evaluation of an investment in the securities of the companies
referred to in this document (including the merits and risks involved), and should consult their own advisors to determine the merits and
risks of such an investment.
Angel Broking Pvt. Limited, its affiliates, directors, its proprietary trading and investment businesses may, from time to time, make
investment decisions that are inconsistent with or contradictory to the recommendations expressed herein. The views contained in this
document are those of the analyst, and the company may or may not subscribe to all the views expressed within.
Reports based on technical and derivative analysis center on studying charts of a stock's price movement, outstanding positions and
trading volume, as opposed to focusing on a company's fundamentals and, as such, may not match with a report on a company's
fundamentals.
The information in this document has been printed on the basis of publicly available information, internal data and other reliable
sources believed to be true, but we do not represent that it is accurate or complete and it should not be relied on as such, as this
document is for general guidance only. Angel Broking Pvt. Limited or any of its affiliates/ group companies shall not be in any way
responsible for any loss or damage that may arise to any person from any inadvertent error in the information contained in this report.
Angel Broking Pvt. Limited has not independently verified all the information contained within this document. Accordingly, we cannot
testify, nor make any representation or warranty, express or implied, to the accuracy, contents or data contained within this document.
While Angel Broking Pvt. Limited endeavors to update on a reasonable basis the information discussed in this material, there may be
regulatory, compliance, or other reasons that prevent us from doing so.
This document is being supplied to you solely for your information, and its contents, information or data may not be reproduced,
redistributed or passed on, directly or indirectly.
Angel Broking Pvt. Limited and its affiliates may seek to provide or have engaged in providing corporate finance, investment banking
or other advisory services in a merger or specific transaction to the companies referred to in this report, as on the date of this report or
in the past.
Neither Angel Broking Pvt. Limited, nor its directors, employees or affiliates shall be liable for any loss or damage that may arise from
or in connection with the use of this information.
Note: Please refer to the important `Stock Holding Disclosure' report on the Angel website (Research Section). Also, please refer to the
latest update on respective stocks for the disclosure status in respect of those stocks. Angel Broking Pvt. Limited and its affiliates may
have investment positions in the stocks recommended in this report.
Research Team
Shardul Kulkarni
-
Head - Technicals
Sameet Chavan
-
Technical Analyst
Angel Broking Pvt. Ltd.
Registered Office: G-1, Ackruti Trade Centre, Rd. No. 7, MIDC, Andheri (E), Mumbai - 400 093.
Corporate Office: 6th Floor, Ackruti Star, MIDC, Andheri (E), Mumbai - 400 093. Tel: (022) 30940000
Sebi Registration No: INB 010996539
4