Daily Technical Report
September 04, 2013
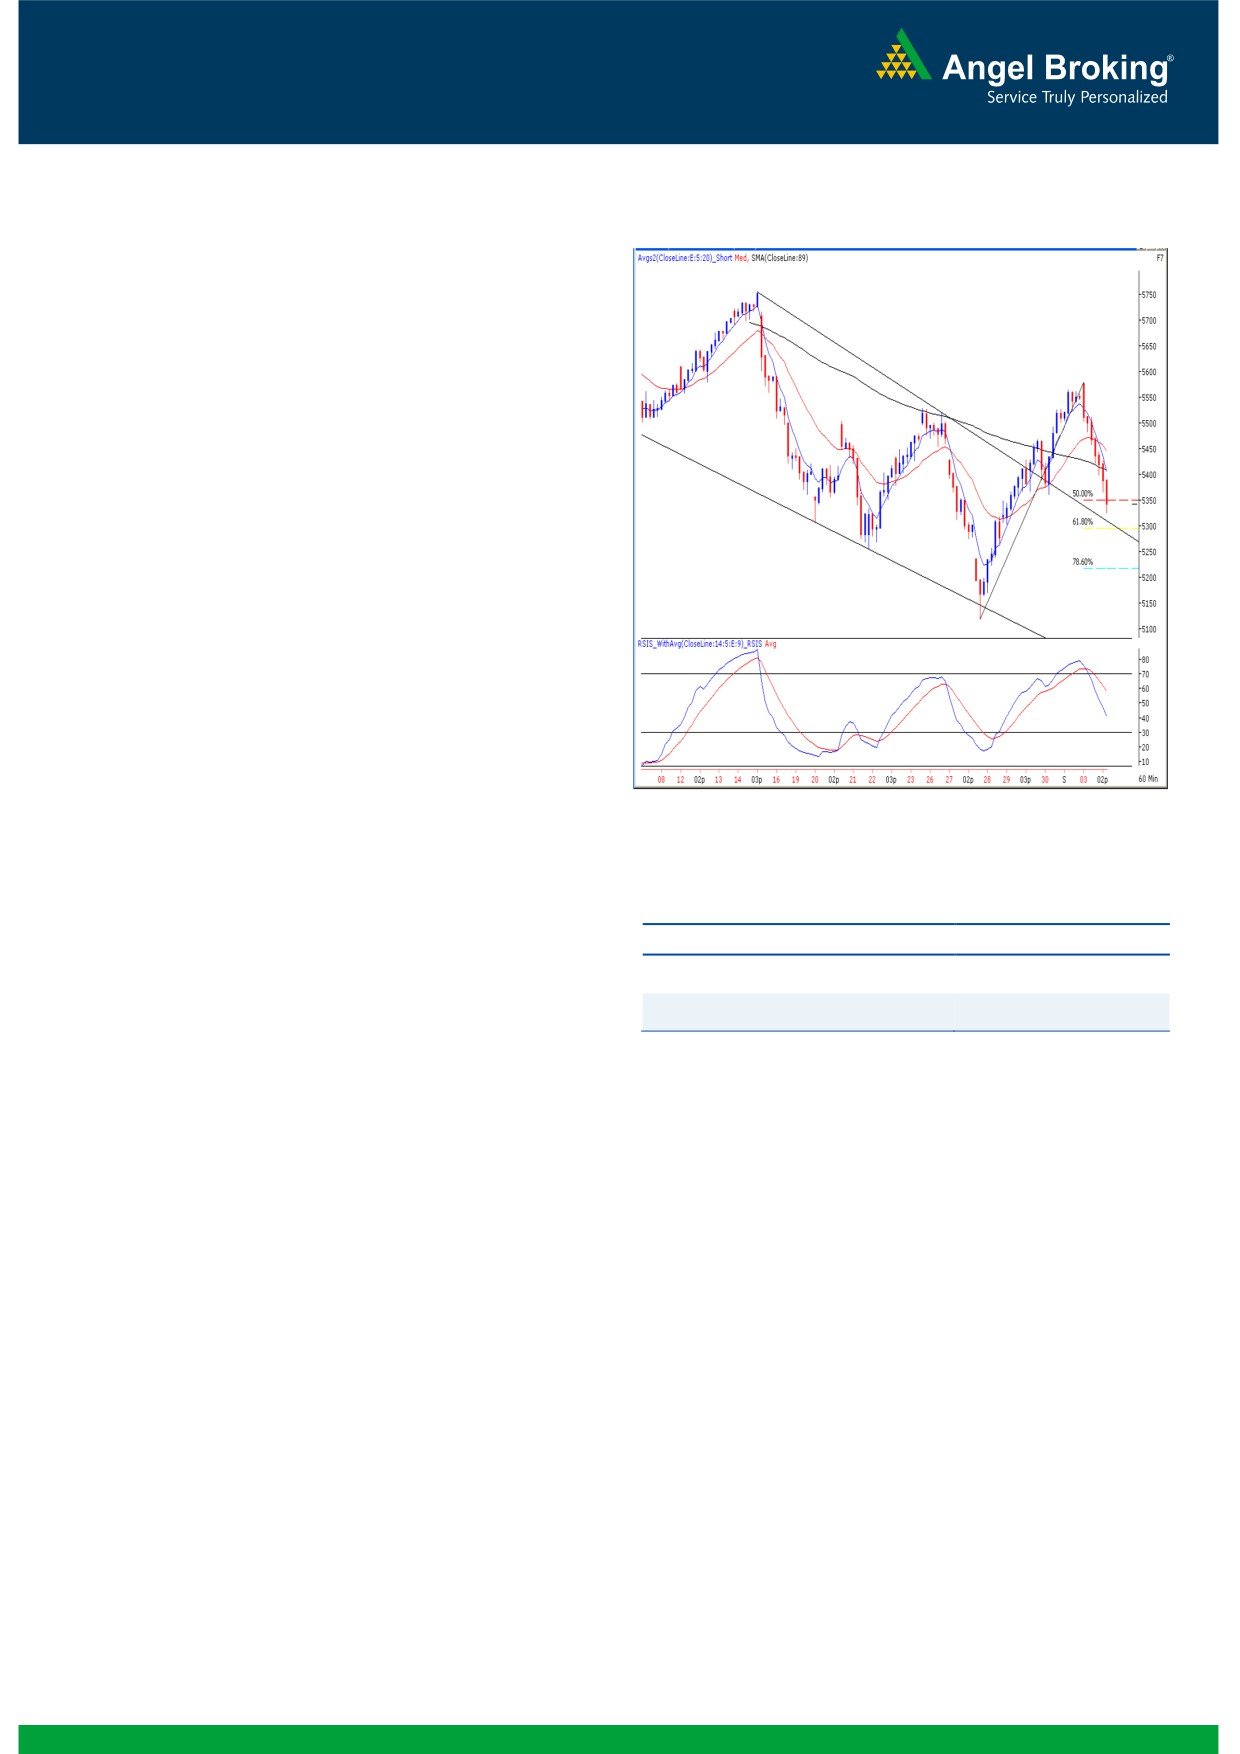
Exhibit 1: Nifty Hourly Chart
Sensex (18235) / NIFTY (5341)
Yesterday, our benchmark indices opened on a flat note as
indicated by the SGX Nifty. However, the index failed to sustain
at higher levels on the back of enormous selling pressure in
some of the heavyweights. Rumors of missile attacks in Syria
added to the woes of the bulls and the market crashed nearly 4
%. All sectors ended in the negative territory with the Banking,
Realty, Consumer Durables, FMCG and Oil & Gas counters
leading the decline. The advance to decline ratio was strongly
in favor of declining counters. (A=766 D=1509) (Source-
Formation
The ’89-day EMA’ and the ’89-week EMA’ are placed at
19137 / 5725 and 18601 / 5607 levels, respectively.
The ’20-day EMA’ and the ‘20-week EMA’ are placed at
18628/ 5501 and 19093 / 5705 levels, respectively.
The monthly ‘RSI-Smoothened’ oscillator is still negatively
Source: Falcon:
poised; whereas the weekly ‘Stochastic’ momentum
oscillator has given a positive crossover.
Actionable points:
The weekly chart depicts yet another ‘Bullish Hammer’
Japanese candlestick pattern.
View
Neutral
The ‘Lower Top - Lower Bottom’ formation in weekly chart
Resistance Levels
5420 - 5450
is still intact.
Support levels
5290 - 5250
Trading strategy:
This was the third session in last 15 trading sessions where the
Nifty posted a mammoth intraday fall of nearly four percent on
closing basis. At this juncture, the Nifty is hovering around the
strong support of 61.8% Fibonacci retracement level of rise
from 5118 to 5581. This level is placed at 5295 and also
coincides with trend line support of 'Channel' (please refer the
exhibit). Hence, this level can be considered as a strong
support for our market. Only a sustainable move below 5290
would augment the bear’s dominance in the market. In this
scenario, we may expect a fall towards 5250 - 5200 levels. On
the flipside, 5420 - 5450 levels would act as immediate
resistance in coming trading session.
1
Daily Technical Report
September 04, 2013
Bank Nifty Outlook - (8664)
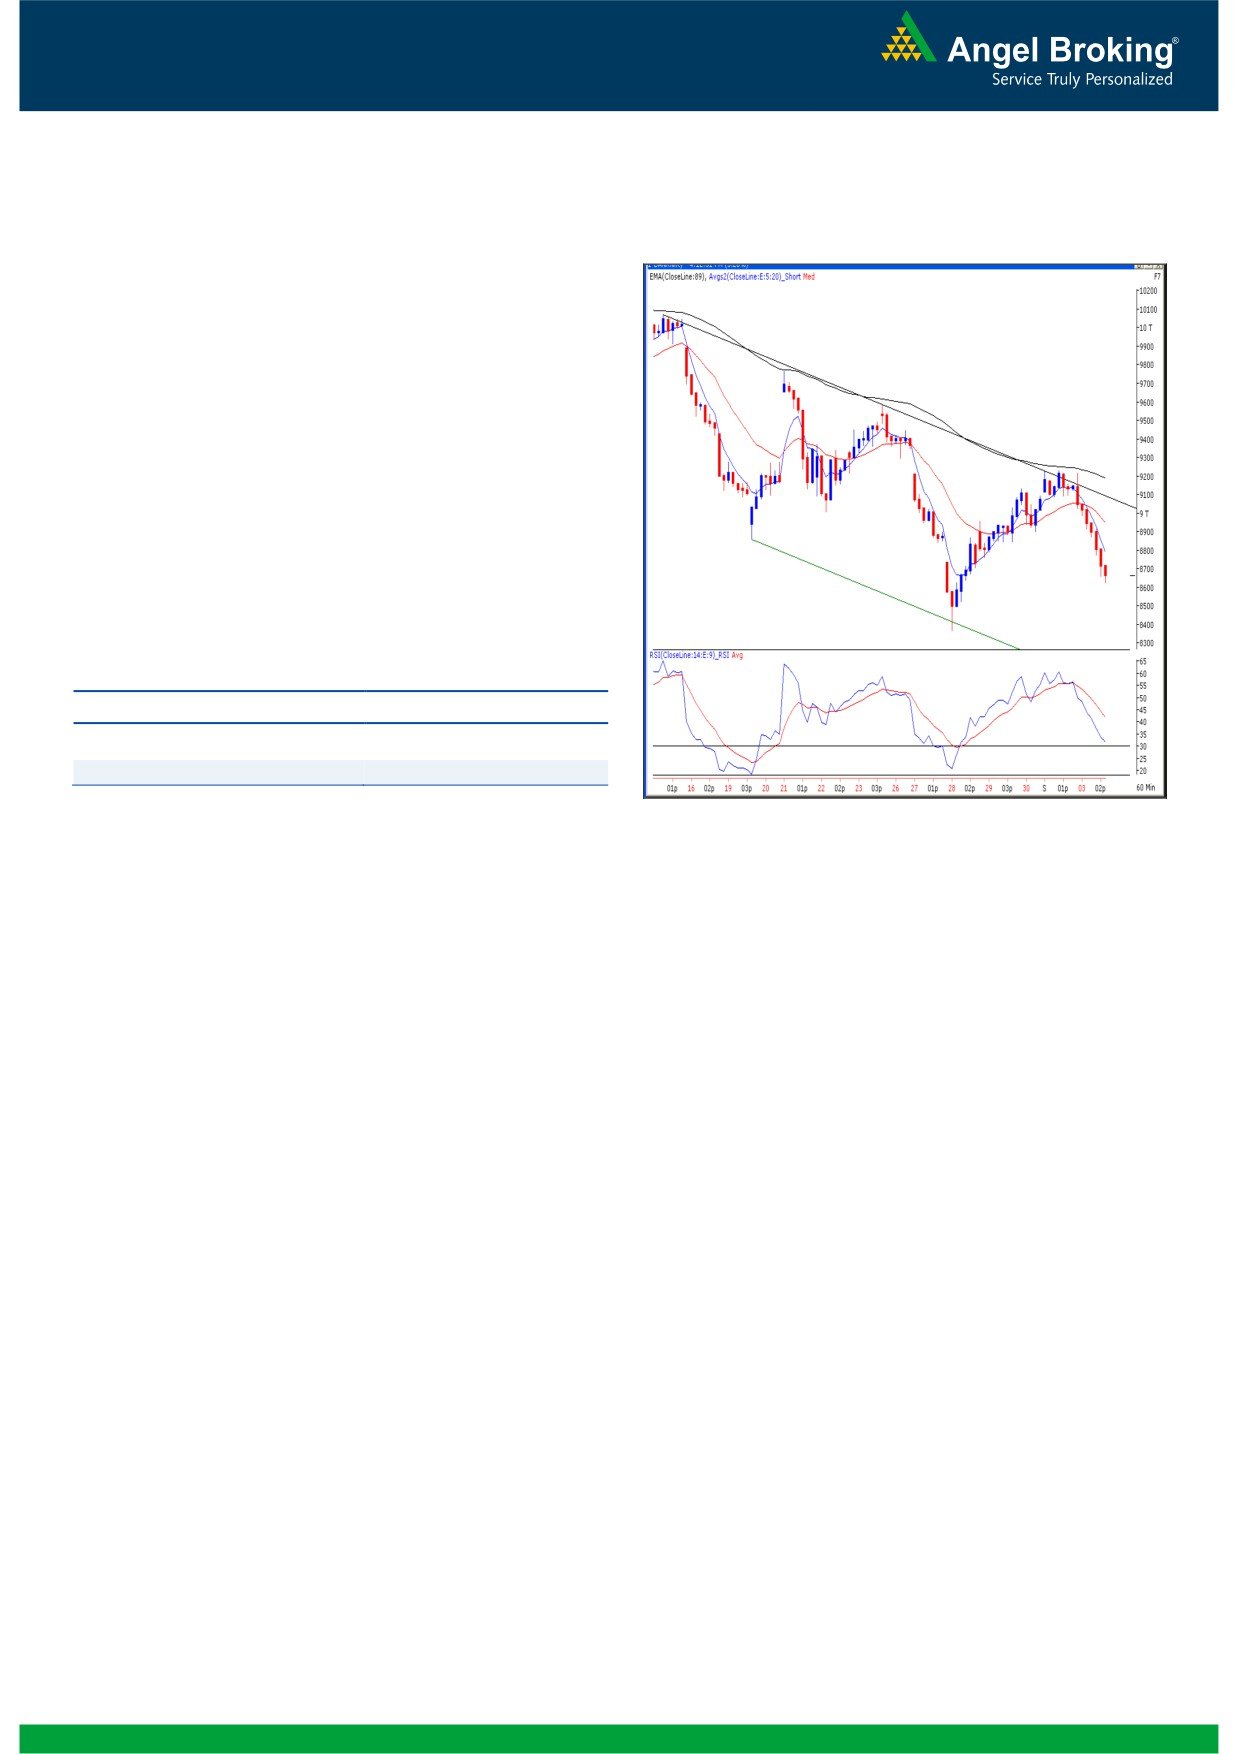
Exhibit 2: Bank Nifty Hourly Chart
Yesterday, the Bank nifty opened with minor gains, but the
bulls once again failed to mark their existence at higher
levels. The hourly' 89 EMA' and “upper trend line” of the
Channel pattern proved to be major obstacles for the index.
As a result, the index declined towards the 78.6% Fibonacci
retracement level of the rise from 8366 to 9234. This level is
seen around 8552 and may provide some support in the near
term. A fall below 8552 may result in the Bank Nifty sliding
further towards the 8366 mark. On the flipside 8712 - 8878
levels would act as strong resistance in coming trading
session.
Actionable points:
View
Neutral
Support levels
8552 -
8366
Resistance Levels
8712 -
8807
Source: Falcon:
2
Daily Technical Report
September 04, 2013
Research Team Tel: 022 - 30940000
DISCLAIMER
This document is solely for the personal information of the recipient, and must not be singularly used as the basis of any investment
decision. Nothing in this document should be construed as investment or financial advice. Each recipient of this document should make
such investigations as they deem necessary to arrive at an independent evaluation of an investment in the securities of the companies
referred to in this document (including the merits and risks involved), and should consult their own advisors to determine the merits and
risks of such an investment.
Angel Broking Pvt. Limited, its affiliates, directors, its proprietary trading and investment businesses may, from time to time, make
investment decisions that are inconsistent with or contradictory to the recommendations expressed herein. The views contained in this
document are those of the analyst, and the company may or may not subscribe to all the views expressed within.
Reports based on technical and derivative analysis center on studying charts of a stock's price movement, outstanding positions and
trading volume, as opposed to focusing on a company's fundamentals and, as such, may not match with a report on a company's
fundamentals.
The information in this document has been printed on the basis of publicly available information, internal data and other reliable
sources believed to be true, but we do not represent that it is accurate or complete and it should not be relied on as such, as this
document is for general guidance only. Angel Broking Pvt. Limited or any of its affiliates/ group companies shall not be in any way
responsible for any loss or damage that may arise to any person from any inadvertent error in the information contained in this report.
Angel Broking Pvt. Limited has not independently verified all the information contained within this document. Accordingly, we cannot
testify, nor make any representation or warranty, express or implied, to the accuracy, contents or data contained within this document.
While Angel Broking Pvt. Limited endeavors to update on a reasonable basis the information discussed in this material, there may be
regulatory, compliance, or other reasons that prevent us from doing so.
This document is being supplied to you solely for your information, and its contents, information or data may not be reproduced,
redistributed or passed on, directly or indirectly.
Angel Broking Pvt. Limited and its affiliates may seek to provide or have engaged in providing corporate finance, investment banking
or other advisory services in a merger or specific transaction to the companies referred to in this report, as on the date of this report or
in the past.
Neither Angel Broking Pvt. Limited, nor its directors, employees or affiliates shall be liable for any loss or damage that may arise from
or in connection with the use of this information.
Note: Please refer to the important `Stock Holding Disclosure' report on the Angel website (Research Section). Also, please refer to the
latest update on respective stocks for the disclosure status in respect of those stocks. Angel Broking Pvt. Limited and its affiliates may
have investment positions in the stocks recommended in this report.
Research Team
Shardul Kulkarni
-
Head - Technicals
Sameet Chavan
-
Technical Analyst
Sacchitanand Uttekar
-
Technical Analyst
Angel Broking Pvt. Ltd.
Registered Office: G-1, Ackruti Trade Centre, Rd. No. 7, MIDC, Andheri (E), Mumbai - 400 093.
Corporate Office: 6th Floor, Ackruti Star, MIDC, Andheri (E), Mumbai - 400 093. Tel: (022) 30940000
Sebi Registration No: INB 010996539
4