Daily Technical Report
March 04, 2014
Sensex (20947) / Nifty (6221)
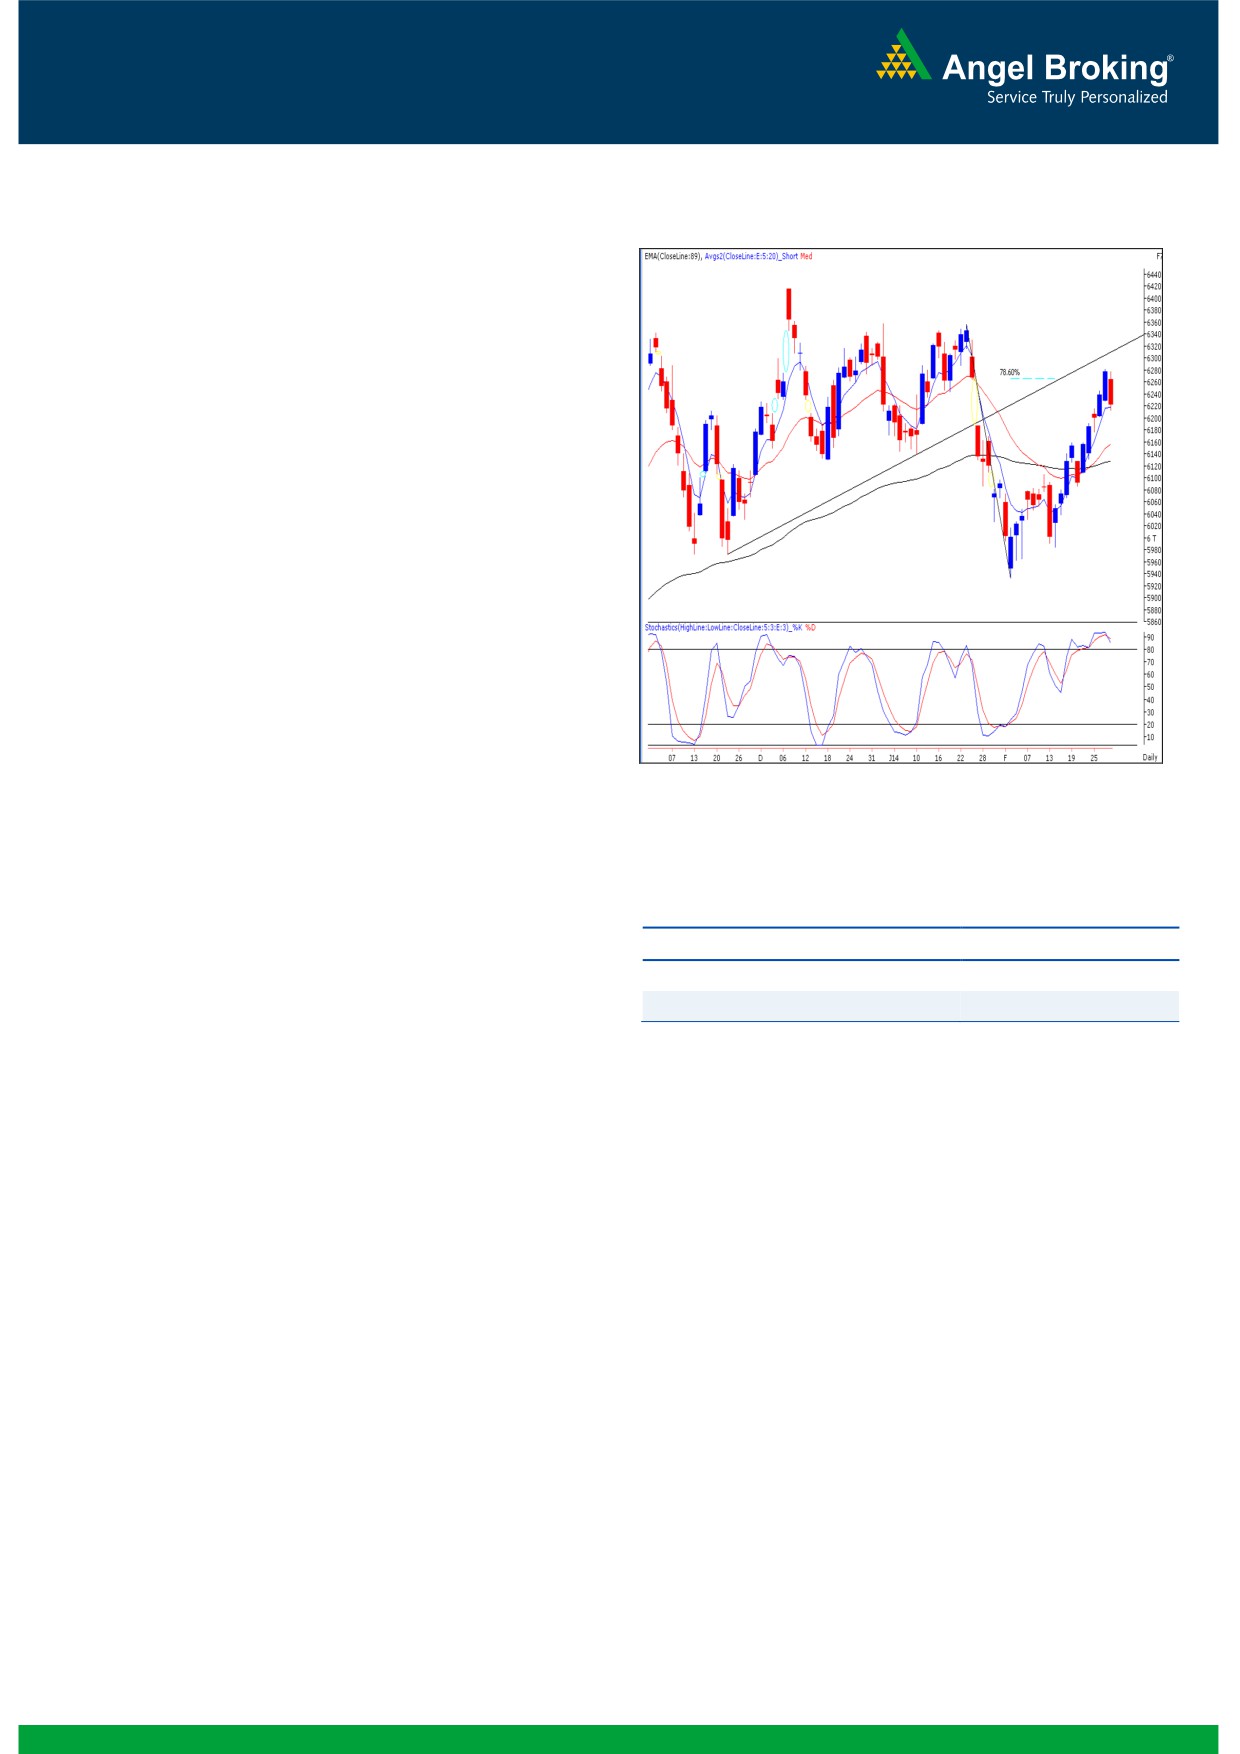
Exhibit 1: Nifty Daily Chart
The opening session of the week started slightly on the
pessimistic note in line with the negative sentiments across the
globe. After a sharp recovery in the initial hour, the skeptical
bulls chose to book their profits. But, the bears took the charge
and pulled the Nifty significantly lower from early morning high
to eventually end the session almost at the lowest point of the
day. On the sectoral front, Consumer durables and Oil & Gas
sectors outperformed the benchmark indices; whereas
Healthcare, IT and Auto counters were under pressure. The
advance to decline ratio was in favor of the declining counters.
Formation
The ’89-day EMA’ and the ’89-week EMA’ are placed at
20613 / 6128 and 19535 / 5850 levels, respectively.
The ’20-day EMA’ and the ‘20-week EMA’ are placed at
20718 / 6156 and 20644 / 6138 levels, respectively.
The 78.6% Fibonacci retracement level of the fall from
Source: Falcon
6355.60 (high on January 23, 2014) to 5933.30 (low on
February 04, 2014) is placed at 6265.
Actionable points:
Trading strategy:
View
Neutral
Support Levels
6176 - 6160
Our market opened tad lower on the back of global
Resistance Levels
6283 - 6300
uncertainty. Initially, index managed to neglect it; but post
mid session bears came back strongly and displayed their
dominance till the closing point of the day. In the process,
the Nifty shed nearly one percent as compared to the
previous close. As mentioned in our previous report, the
strong resistance zone of
6280
-
6300 showed its
importance as the selling triggered after posting a high of
6278. The Nifty has now closed below Friday's low of 6228,
which is a first sign of weakness. Considering negative
placement of daily ' Stochastic' oscillator and hourly '5 & 20
EMA', we expect the index to test 6176 - 6160 levels. On
the flipside, 6280 - 6300 remains to be a strong resistance
zone for the index.
1
Daily Technical Report
March 04, 2014
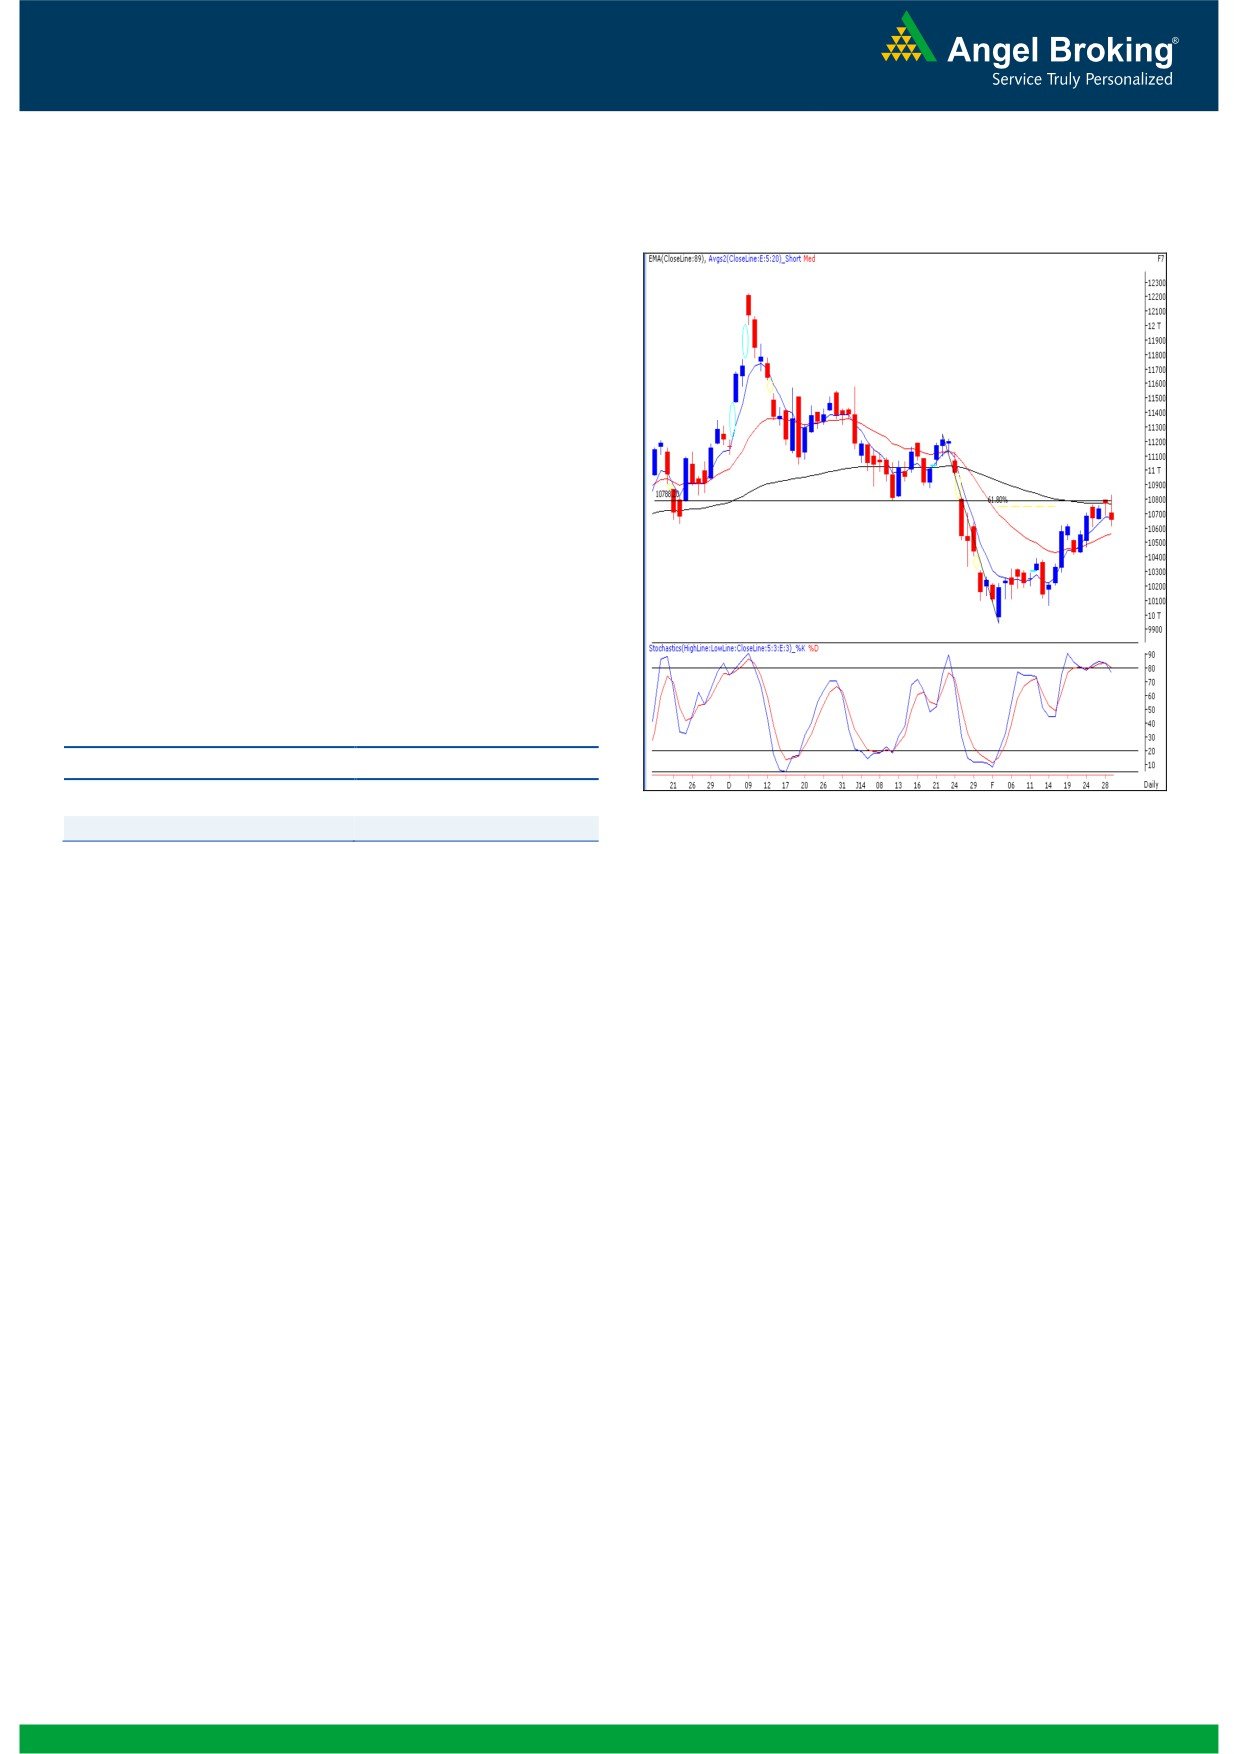
Bank Nifty Outlook - (10652)
Exhibit 2: Bank Nifty Daily Chart
On Monday, the Bank Nifty opened half a percent lower
and instantly recovered one and half a percent from the
early morning lows. However, post midsession; we
observed a strong selling pressure in some of the
heavyweight constituents around daily
‘89EMA’. This
resulted in a confirmation of the ‘Hanging Man’ Japanese
candlestick pattern mentioned in our previous report.
Going forward, looking at the intraday pessimism and the
placement of Daily momentum oscillators, we expect the
banking index to remain under pressure. In this scenario,
the Bank Nifty may continue its slide towards the next
support zone of 10550 - 10471. On the flipside, 10803
- 10850 levels remain to be strong supply zone for the
index.
Actionable points:
View
Bearish Below 10600
Expected Target
10550 - 10471
Source: Falcon
Resistance levels
10803 - 10850
2
Daily Technical Report
March 04, 2014
Research Team Tel: 022 - 30940000
DISCLAIMER
This document is solely for the personal information of the recipient, and must not be singularly used as the basis of any investment
decision. Nothing in this document should be construed as investment or financial advice. Each recipient of this document should make
such investigations as they deem necessary to arrive at an independent evaluation of an investment in the securities of the companies
referred to in this document (including the merits and risks involved), and should consult their own advisors to determine the merits and
risks of such an investment.
Angel Broking Pvt. Limited, its affiliates, directors, its proprietary trading and investment businesses may, from time to time, make
investment decisions that are inconsistent with or contradictory to the recommendations expressed herein. The views contained in this
document are those of the analyst, and the company may or may not subscribe to all the views expressed within.
Reports based on technical and derivative analysis center on studying charts of a stock's price movement, outstanding positions and
trading volume, as opposed to focusing on a company's fundamentals and, as such, may not match with a report on a company's
fundamentals.
The information in this document has been printed on the basis of publicly available information, internal data and other reliable
sources believed to be true, but we do not represent that it is accurate or complete and it should not be relied on as such, as this
document is for general guidance only. Angel Broking Pvt. Limited or any of its affiliates/ group companies shall not be in any way
responsible for any loss or damage that may arise to any person from any inadvertent error in the information contained in this report.
Angel Broking Pvt. Limited has not independently verified all the information contained within this document. Accordingly, we cannot
testify, nor make any representation or warranty, express or implied, to the accuracy, contents or data contained within this document.
While Angel Broking Pvt. Limited endeavors to update on a reasonable basis the information discussed in this material, there may be
regulatory, compliance, or other reasons that prevent us from doing so.
This document is being supplied to you solely for your information, and its contents, information or data may not be reproduced,
redistributed or passed on, directly or indirectly.
Angel Broking Pvt. Limited and its affiliates may seek to provide or have engaged in providing corporate finance, investment banking
or other advisory services in a merger or specific transaction to the companies referred to in this report, as on the date of this report or
in the past.
Neither Angel Broking Pvt. Limited, nor its directors, employees or affiliates shall be liable for any loss or damage that may arise from
or in connection with the use of this information.
Note: Please refer to the important `Stock Holding Disclosure' report on the Angel website (Research Section). Also, please refer to the
latest update on respective stocks for the disclosure status in respect of those stocks. Angel Broking Pvt. Limited and its affiliates may
have investment positions in the stocks recommended in this report.
Research Team
Sameet Chavan
-
Technical Analyst
Angel Broking Pvt. Ltd.
Registered Office: G-1, Ackruti Trade Centre, Rd. No. 7, MIDC, Andheri (E), Mumbai - 400 093.
Corporate Office: 6th Floor, Ackruti Star, MIDC, Andheri (E), Mumbai - 400 093. Tel: (022) 30940000
Sebi Registration No: INB 010996539
4