Daily Technical Report
October 03, 2013
Sensex (19517) / NIFTY (5780)
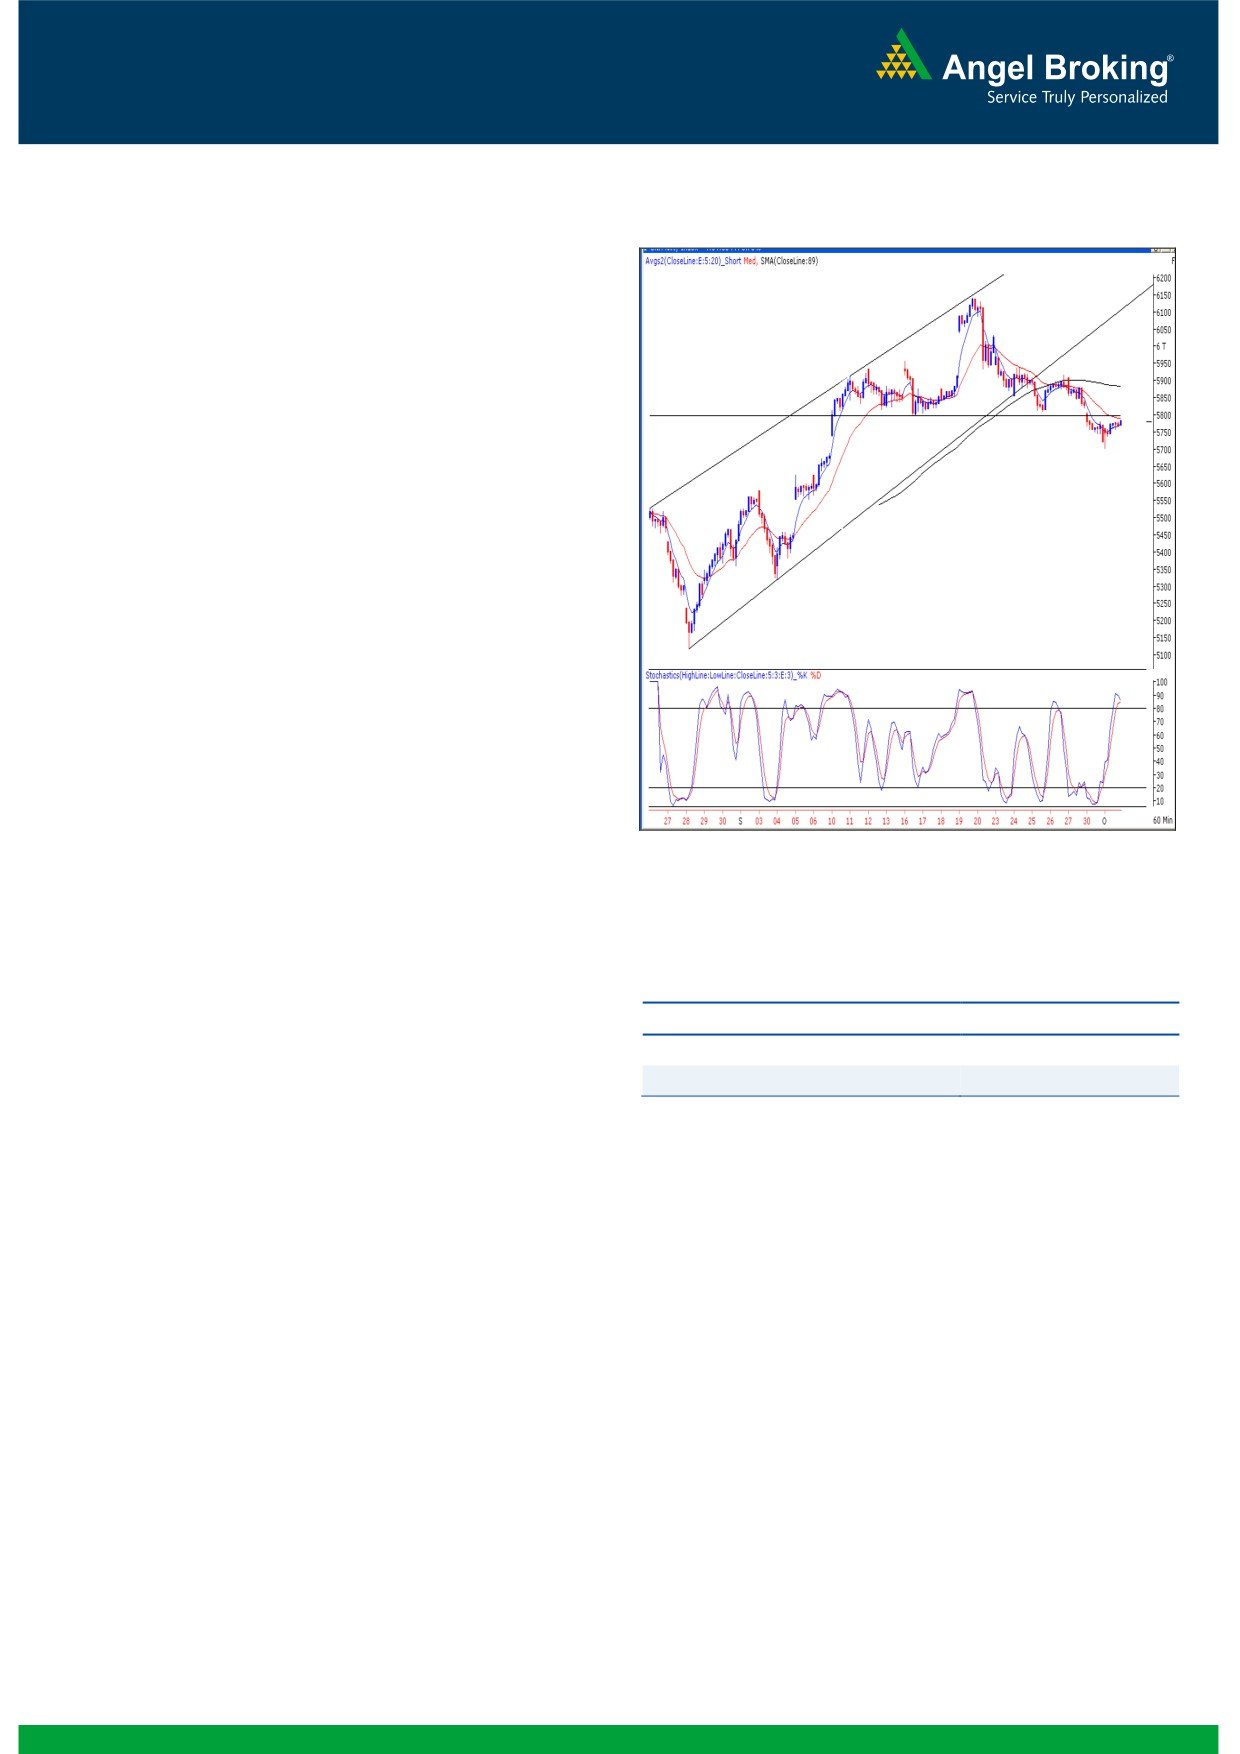
Exhibit 1: Nifty Hourly Chart
On Tuesday, our benchmark indices opened half a percent
higher as indicated by the SGX Nifty. Despite the early morning
dip, the index managed to recover sharply and posted a close
well inside the positive territory. Banking counters contributed
significantly in the pullback along with the Realty, Capital
goods and Auto stocks. The Oil & Gas and power counters
ended with minor losses. The advance to decline ratio was
strongly in the favor of the advancing counters. (A=1317
Formation
The ’89-day EMA’ and the ’89-week EMA’ are placed at
19350 / 5765 and 18725 / 5636 levels, respectively.
The ’20-day EMA’ and the ‘20-week EMA’ are placed at
19604 / 5797 and 19390 / 5779 levels, respectively.
The daily and monthly ‘RSI-Smoothened’ oscillator is
negatively poised.
The previous week’s candle resembles a ‘Spinning Top’
Japanese candlestick pattern.
Source: Falcon
On a closing basis, the ‘Lower Top - Lower Bottom’
formation on the weekly chart is still intact (Nifty).
The 38.2% and 50% Fibonacci retracement levels of the
Actionable points:
rise from 5118 (weekly low of August 30, 2013) to 6143
(weekly high of September 20, 2013) are placed at 5750
View
Bearish below 5756
and 5630, respectively.
Resistance Level
5810 - 5825
Trading strategy:
Expected Targets
5700 - 5630
The overall price action seen during Tuesday's session can be
termed as a 'Tug of war' as the bulls managed to pull the index
from early morning lows and eventually, posted a close on
optimistic note. However the Nifty continues to trade below the
20 day EMA and the hourly 89 bar EMA. Also, the Head and
Shoulder pattern mentioned in our previous reports is still very
much intact. Considering the hourly chart, the up move can be
construed as a pull back and any weakness around 5790 -
5798 may drag the index to retest 5700 or lower levels. On
the upside, 5798 - 5877 would remain to act as a strong
resistance zone for our market in coming trading sessions.
1
Daily Technical Report
October 03, 2013
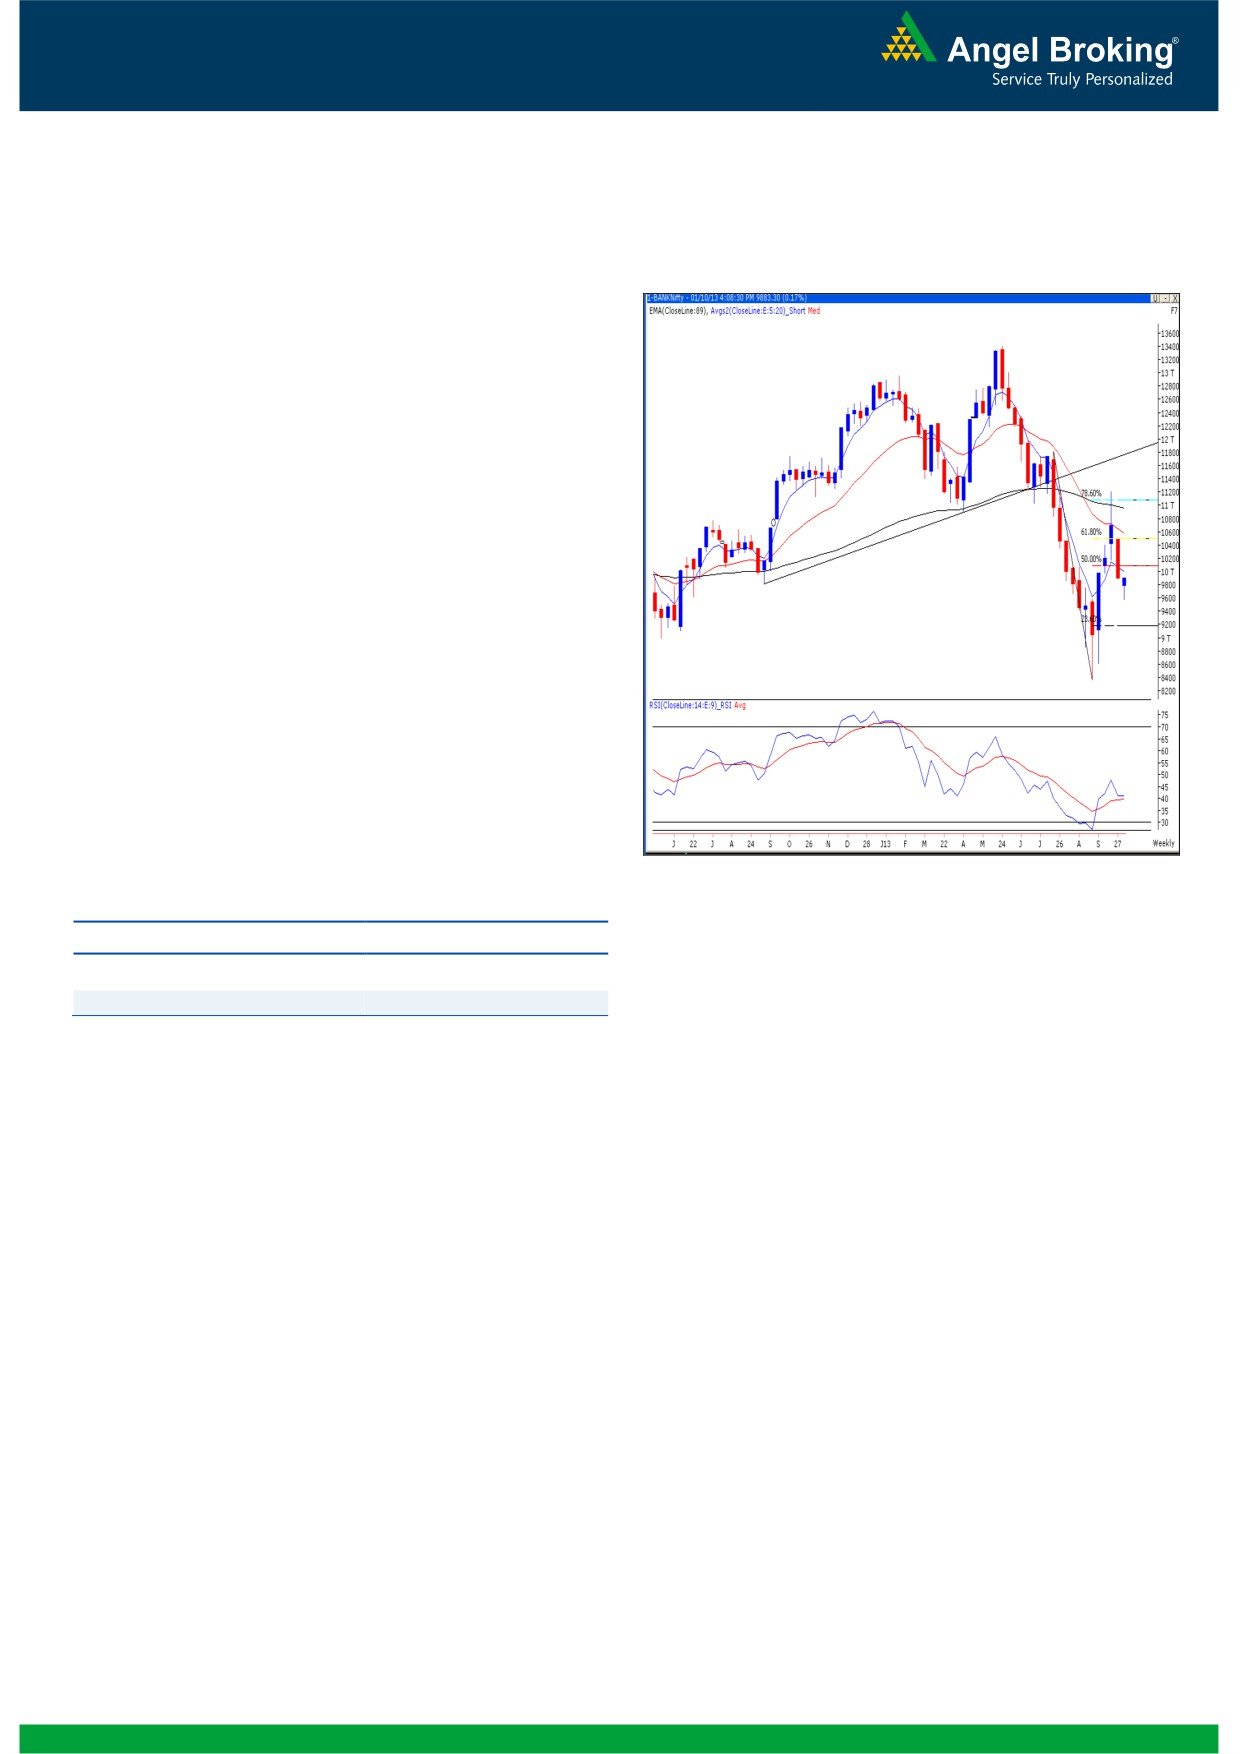
Bank Nifty Outlook - (9883)
Exhibit 2: Bank Nifty Weekly Chart
On Tuesday, in-line with our benchmark index, the Bank
Nifty too opened half a percent higher. However, barring
some early morning down ticks, the index gained
significantly as we witnessed single day gain of more than
two percent. Despite this price action, the overall higher
degree chart remains bearish and hence, the up move can
also be termed as a relief rally. We reiterate our view that
hourly ‘89 EMA’ (10034) level is a strong resistance for the
Bank Nifty. Also the lower top lower bottom structure on
the daily chart still continues to exist. On the downside,
9713 - 9580 are key support levels in coming trading
session. Any weakness around these levels would resume
the downtrend and in this scenario, the index may test
9400 - 9300 levels. On the flipside, if the index manages
to sustain above 10034 levels, than we may witness an
extended bounce up to 10190-10290 levels
Actionable points:
Source: Falcon
View
Neutral
Support Levels
9713 - 9580
Resistance Levels
10034 - 10190
2
Daily Technical Report
October 03, 2013
Daily Pivot Levels for Nifty 50 Stocks
SCRIPS
S2
S1
PIVOT
R1
R2
SENSEX z
19,174
19,351
19,442
19,619
19,710
NIFTY
5,670
5,725
5,756
5,811
5,841
BANKNIFTY
9,463
9,673
9,793
10,003
10,123
ACC
1,076
1,088
1,104
1,115
1,131
AMBUJACEM
174
177
181
184
188
ASIANPAINT
443
449
456
462
469
AXISBANK
999
1,021
1,036
1,058
1,072
BAJAJ-AUTO
1,958
1,989
2,013
2,044
2,068
BANKBARODA
481
490
496
505
512
BHARTIARTL
303
313
319
328
334
BHEL
137
139
141
144
146
BPCL
317
322
325
330
333
CAIRN
314
316
318
320
322
CIPLA
428
430
433
435
438
COALINDIA
291
294
297
300
302
DLF
124
130
134
140
144
DRREDDY
2,347
2,377
2,403
2,433
2,459
GAIL
318
321
325
328
332
GRASIM
2,583
2,605
2,638
2,661
2,694
HCLTECH
1,049
1,060
1,075
1,086
1,101
HDFC
751
768
779
797
807
HDFCBANK
580
596
605
621
630
HEROMOTOCO
1,952
1,976
2,004
2,027
2,055
HINDALCO
107
109
111
112
114
HINDUNILVR
595
607
619
631
643
ICICIBANK
872
892
903
923
934
IDFC
87
89
90
92
93
INDUSINDBK
359
371
379
391
399
INFY
2,983
2,999
3,019
3,035
3,054
ITC
336
340
342
345
347
JINDALSTEL
225
229
232
236
239
JPASSOCIAT
34
34
35
36
36
KOTAKBANK
658
672
681
694
703
LT
766
783
794
810
821
LUPIN
836
844
854
862
872
M&M
808
820
833
845
858
MARUTI
1,339
1,359
1,385
1,405
1,431
NMDC
116
117
119
121
123
NTPC
140
142
145
147
150
ONGC
255
259
264
268
274
PNB
451
457
462
468
473
POWERGRID
97
98
99
100
100
RANBAXY
322
336
346
360
370
RELIANCE
811
816
823
828
835
RELINFRA
358
367
372
381
387
SBIN
1,601
1,622
1,635
1,656
1,670
SESAGOA
169
172
176
180
184
SUNPHARMA
582
586
592
596
602
TATAMOTORS
326
331
335
340
345
TATAPOWER
75
76
79
81
83
TATASTEEL
265
270
274
280
284
TCS
1,902
1,926
1,940
1,964
1,978
ULTRACEMCO
1,779
1,796
1,808
1,825
1,837
3
Daily Technical Report
October 03, 2013
Research Team Tel: 022 - 30940000
DISCLAIMER
This document is solely for the personal information of the recipient, and must not be singularly used as the basis of any investment
decision. Nothing in this document should be construed as investment or financial advice. Each recipient of this document should make
such investigations as they deem necessary to arrive at an independent evaluation of an investment in the securities of the companies
referred to in this document (including the merits and risks involved), and should consult their own advisors to determine the merits and
risks of such an investment.
Angel Broking Pvt. Limited, its affiliates, directors, its proprietary trading and investment businesses may, from time to time, make
investment decisions that are inconsistent with or contradictory to the recommendations expressed herein. The views contained in this
document are those of the analyst, and the company may or may not subscribe to all the views expressed within.
Reports based on technical and derivative analysis center on studying charts of a stock's price movement, outstanding positions and
trading volume, as opposed to focusing on a company's fundamentals and, as such, may not match with a report on a company's
fundamentals.
The information in this document has been printed on the basis of publicly available information, internal data and other reliable
sources believed to be true, but we do not represent that it is accurate or complete and it should not be relied on as such, as this
document is for general guidance only. Angel Broking Pvt. Limited or any of its affiliates/ group companies shall not be in any way
responsible for any loss or damage that may arise to any person from any inadvertent error in the information contained in this report.
Angel Broking Pvt. Limited has not independently verified all the information contained within this document. Accordingly, we cannot
testify, nor make any representation or warranty, express or implied, to the accuracy, contents or data contained within this document.
While Angel Broking Pvt. Limited endeavors to update on a reasonable basis the information discussed in this material, there may be
regulatory, compliance, or other reasons that prevent us from doing so.
This document is being supplied to you solely for your information, and its contents, information or data may not be reproduced,
redistributed or passed on, directly or indirectly.
Angel Broking Pvt. Limited and its affiliates may seek to provide or have engaged in providing corporate finance, investment banking
or other advisory services in a merger or specific transaction to the companies referred to in this report, as on the date of this report or
in the past.
Neither Angel Broking Pvt. Limited, nor its directors, employees or affiliates shall be liable for any loss or damage that may arise from
or in connection with the use of this information.
Note: Please refer to the important `Stock Holding Disclosure' report on the Angel website (Research Section). Also, please refer to the
latest update on respective stocks for the disclosure status in respect of those stocks. Angel Broking Pvt. Limited and its affiliates may
have investment positions in the stocks recommended in this report.
Research Team
Shardul Kulkarni
-
Head - Technicals
Sameet Chavan
-
Technical Analyst
Sacchitanand Uttekar
-
Technical Analyst
Angel Broking Pvt. Ltd.
Registered Office: G-1, Ackruti Trade Centre, Rd. No. 7, MIDC, Andheri (E), Mumbai - 400 093.
Corporate Office: 6th Floor, Ackruti Star, MIDC, Andheri (E), Mumbai - 400 093. Tel: (022) 30940000
Sebi Registration No: INB 010996539
4