Daily Technical Report
December 02, 2014
Sensex (28560) / Nifty (8556)
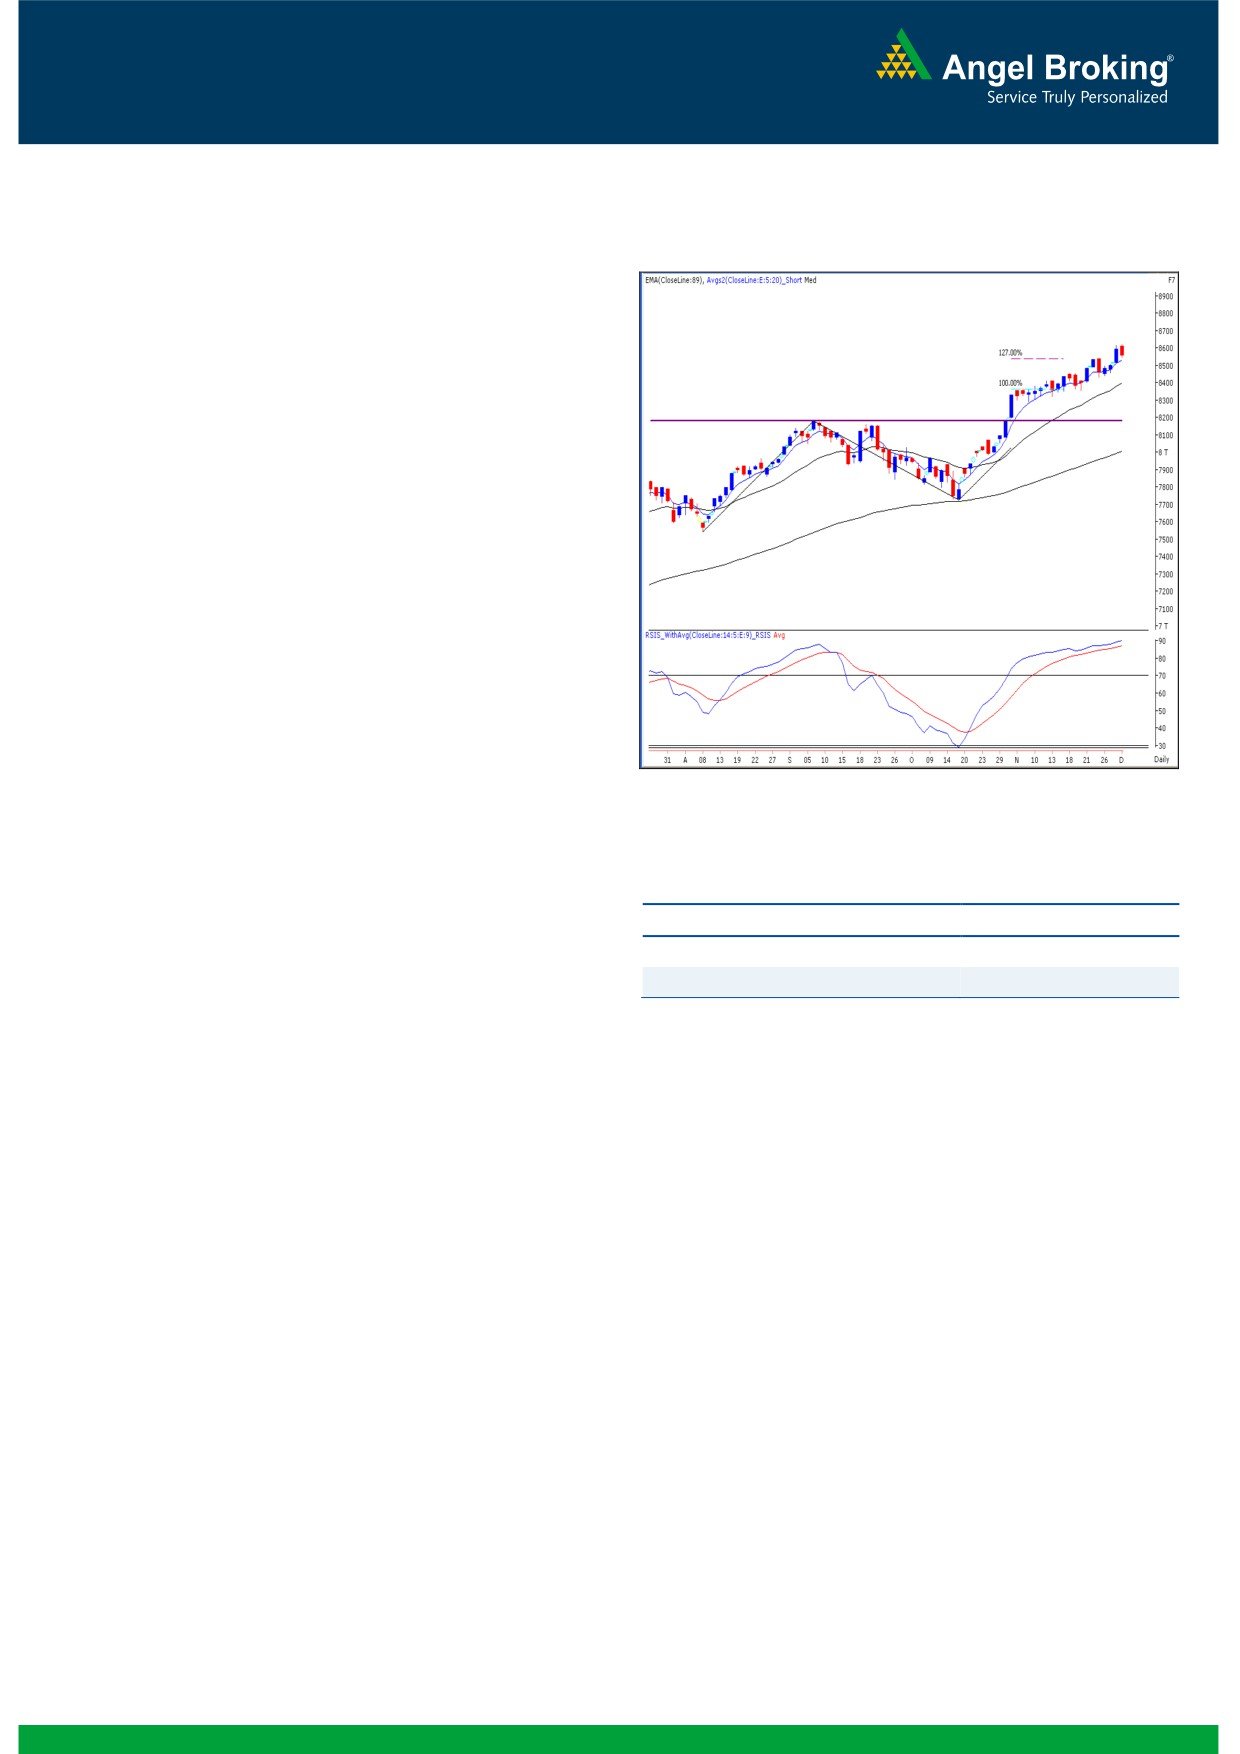
Exhibit 1: Nifty Daily Chart
The trading for the week started on a subdued note owing
quiet cues from other Asian bourses. The index remained
under pressure throughout the remaining session after
posting a new high of 8623 in the initial trades. As a result,
the index closed almost at the lowest point of the day with a
loss of nearly half a percent. The Consumer Durables, IT
and FMCG sectors managed to close in the green; whereas
the Oil & Gas, Metal, Power and Capital Goods counters
witnessed a fair bit of correction. The advance to decline
ratio was in favor of the declining counters. (A=1218
Formations
The ’89-day EMA’ and the ’89-week EMA’ are placed
at 26746 / 7994 and 23128 / 6918 levels, respectively.
The ’20-day EMA’ and the ‘20-week EMA’ are placed
at 28020 / 8378 and 26784 / 8007 levels, respectively.
Source: Falcon
Actionable points:
Trading strategy:
Although, the index corrected by nearly 70 points from the
View
Neutral
morning highs; the overall movement was quite lethargic
Support Level
8500
across the broader market. Hence, the chart structure still
Resistance Levels
8620 - 8650
remains unchanged. We reiterate that despite having a
strong trend on the upside, we would not provide any trade
set up until we get a clear development on the charts.
Meanwhile, it's advisable to stick to a stock centric approach
and trade with a proper exit strategy. If the momentum
persists in the market then we may see an extended move
towards 8650 - 8680 levels on the Nifty. On the flipside,
8500 - 8420 are seen as immediate support levels for the
index.
1
Daily Technical Report
December 02, 2014
Bank Nifty Outlook - (18525)
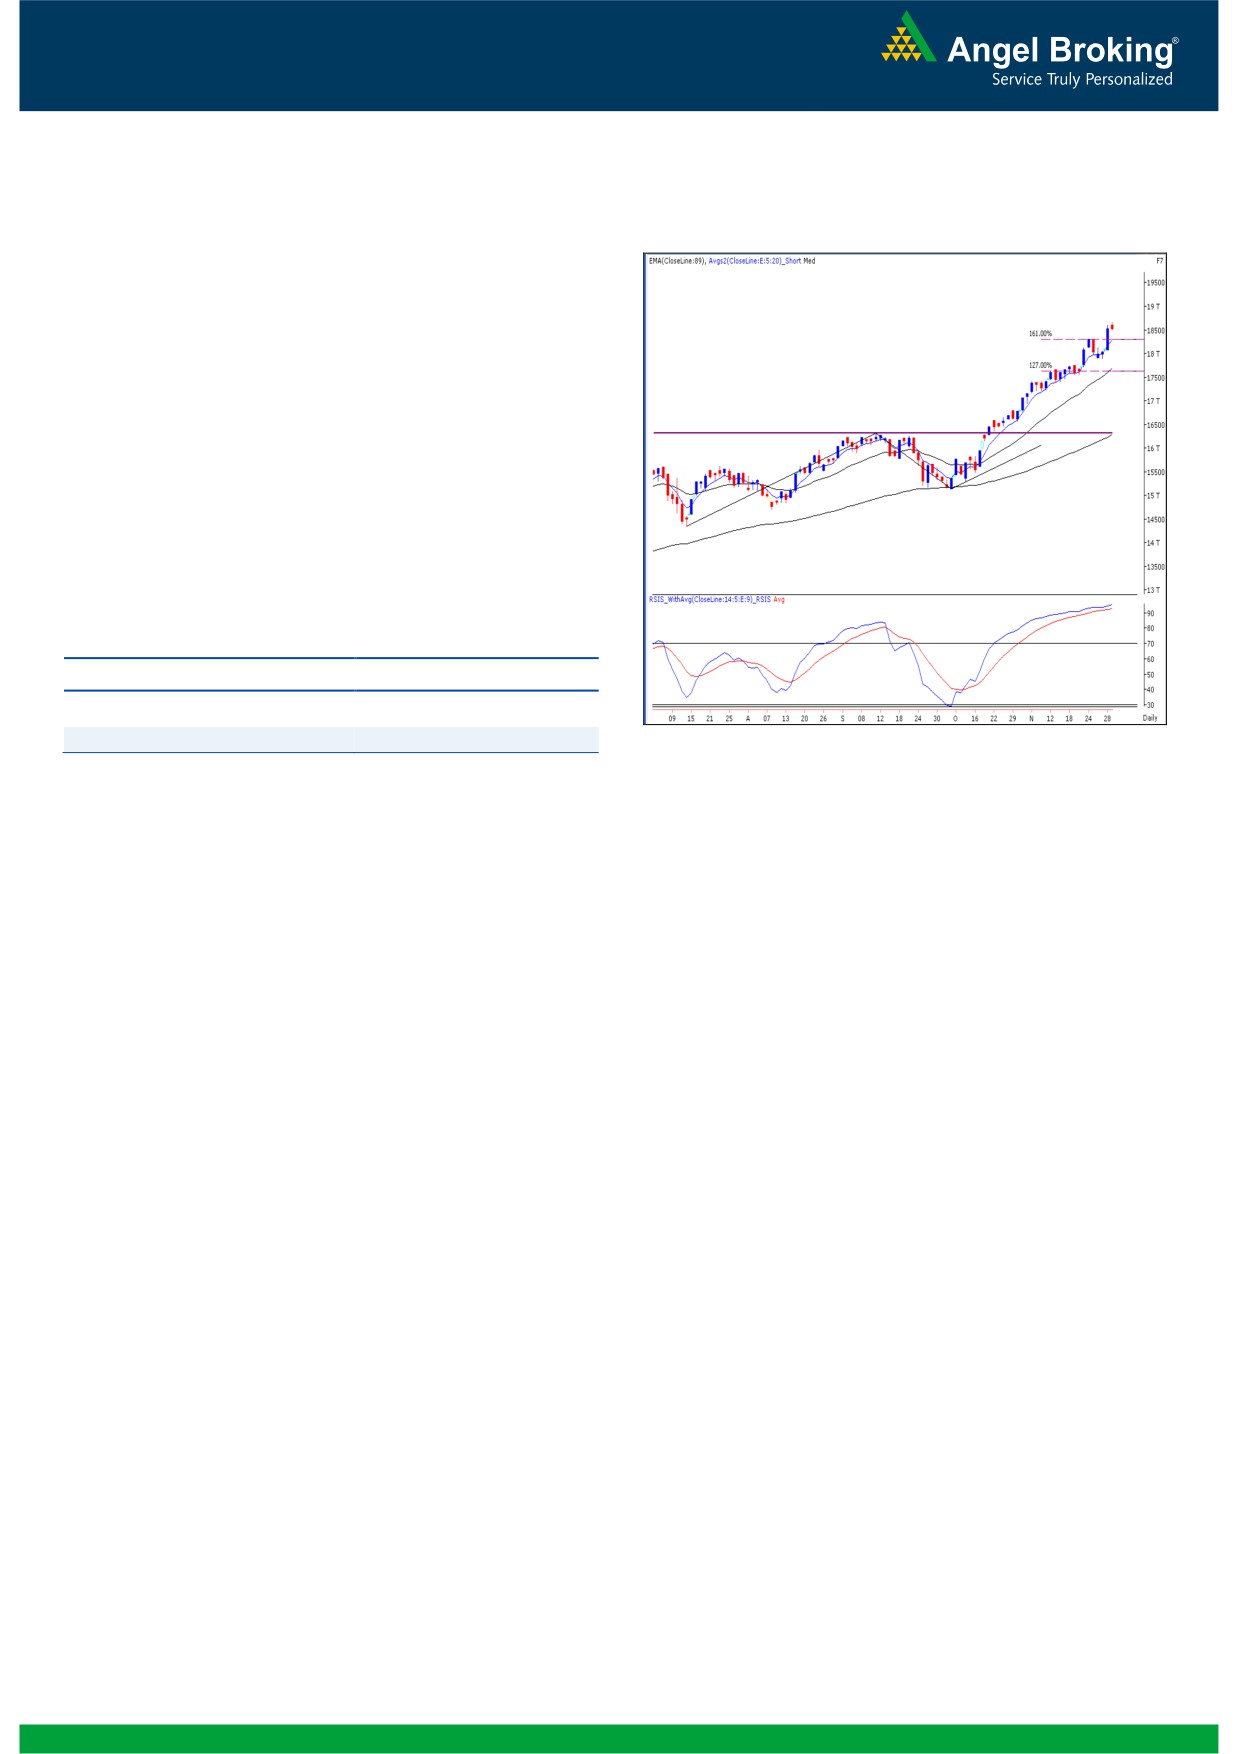
Exhibit 2: Bank Nifty Daily Chart
Yesterday, the Bank Nifty too had a quiet start of the week
and then the overall intraday movement was much
narrower than the benchmark index. The Bank Nifty
somehow managed to close in the green with very
nominal loss. Going forward, the immediate resistance
zone is seen around 18700 - 18800. However, we do
not advise any trade set up in the Bank Nifty too due to
lack of technical indications. It’s advisable for the traders
to focus on its constituents and trade with a proper exit
strategy. On the flipside, 18400 - 18300 are seen as
immediate support levels for the index.
Actionable points:
View
Neutral
Resistance Levels
18700 - 18800
Support Levels
18400 - 18300
Source: Falcon
2
Daily Technical Report
December 02, 2014
Research Team Tel: 022 - 30940000
DISCLAIMER
This document is solely for the personal information of the recipient, and must not be singularly used as the basis of any investment
decision. Nothing in this document should be construed as investment or financial advice. Each recipient of this document should make
such investigations as they deem necessary to arrive at an independent evaluation of an investment in the securities of the companies
referred to in this document (including the merits and risks involved), and should consult their own advisors to determine the merits and
risks of such an investment.
Angel Broking Pvt. Limited, its affiliates, directors, its proprietary trading and investment businesses may, from time to time, make
investment decisions that are inconsistent with or contradictory to the recommendations expressed herein. The views contained in this
document are those of the analyst, and the company may or may not subscribe to all the views expressed within.
Reports based on technical and derivative analysis center on studying charts of a stock's price movement, outstanding positions and
trading volume, as opposed to focusing on a company's fundamentals and, as such, may not match with a report on a company's
fundamentals.
The information in this document has been printed on the basis of publicly available information, internal data and other reliable
sources believed to be true, but we do not represent that it is accurate or complete and it should not be relied on as such, as this
document is for general guidance only. Angel Broking Pvt. Limited or any of its affiliates/ group companies shall not be in any way
responsible for any loss or damage that may arise to any person from any inadvertent error in the information contained in this report.
Angel Broking Pvt. Limited has not independently verified all the information contained within this document. Accordingly, we cannot
testify, nor make any representation or warranty, express or implied, to the accuracy, contents or data contained within this document.
While Angel Broking Pvt. Limited endeavors to update on a reasonable basis the information discussed in this material, there may be
regulatory, compliance, or other reasons that prevent us from doing so.
This document is being supplied to you solely for your information, and its contents, information or data may not be reproduced,
redistributed or passed on, directly or indirectly.
Angel Broking Pvt. Limited and its affiliates may seek to provide or have engaged in providing corporate finance, investment banking
or other advisory services in a merger or specific transaction to the companies referred to in this report, as on the date of this report or
in the past.
Neither Angel Broking Pvt. Limited, nor its directors, employees or affiliates shall be liable for any loss or damage that may arise from
or in connection with the use of this information.
Note: Please refer to the important `Stock Holding Disclosure' report on the Angel website (Research Section). Also, please refer to the
latest update on respective stocks for the disclosure status in respect of those stocks. Angel Broking Pvt. Limited and its affiliates may
have investment positions in the stocks recommended in this report.
Research Team
Sameet Chavan
-
Technical Analyst
Angel Broking Pvt. Ltd.
Registered Office: G-1, Ackruti Trade Centre, Rd. No. 7, MIDC, Andheri (E), Mumbai - 400 093.
Corporate Office: 6th Floor, Ackruti Star, MIDC, Andheri (E), Mumbai - 400 093. Tel: (022) 30940000
Sebi Registration No: INB 010996539
4