Daily Technical Report
December 02, 2013
Sensex (20792) / Nifty (6176)
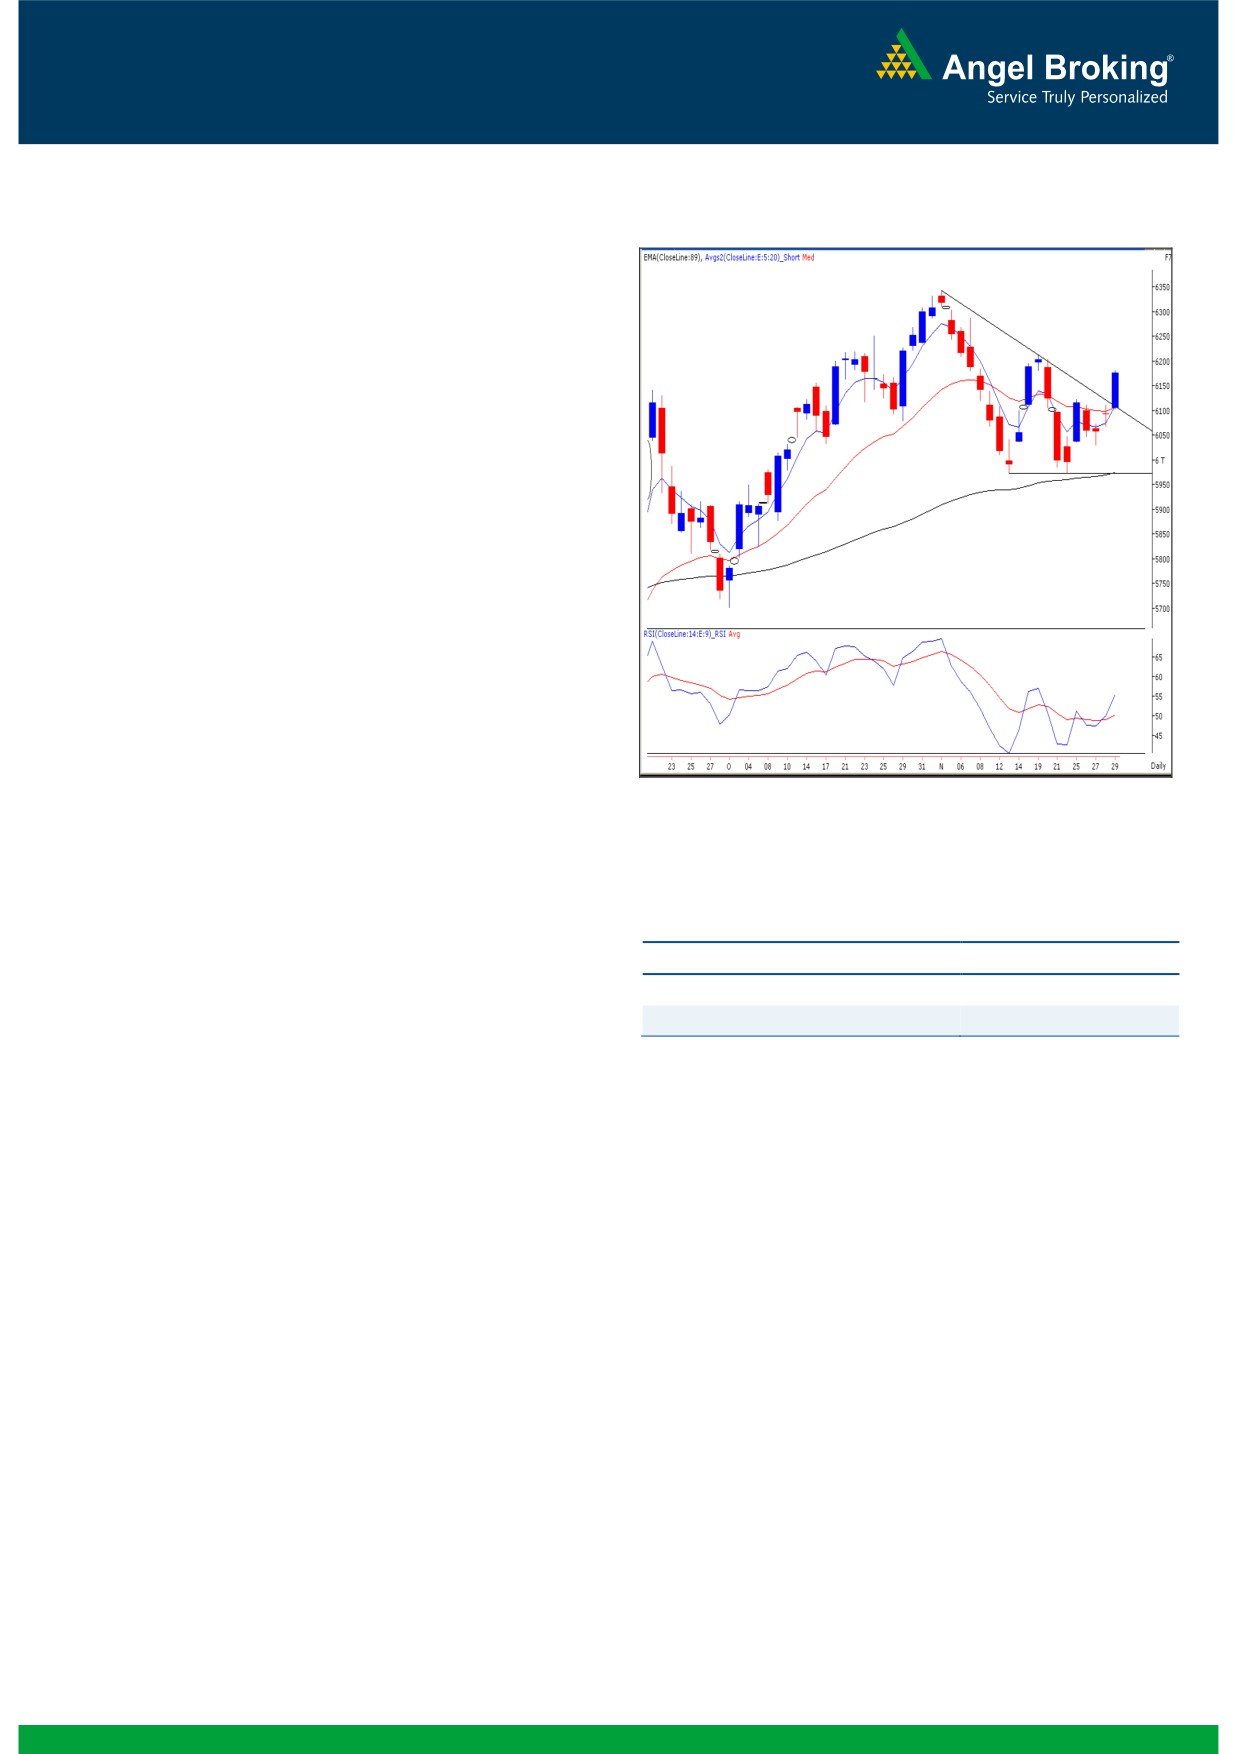
Exhibit 1: Nifty Daily Chart
On Friday, the market opened on a positive note as indicated
by the SGX Nifty and then continued its upward momentum to
post significant intra day gains of nearly one and half a
percent. On the sectoral front, all the sectors closed on positive
note. Banking, PSUs, and Capital goods counters were the
major gainers and the advance to decline ratio was strongly in
favor of the advancing counters. (A=1455 D=1043)(Source-
Formation
The ’89-day EMA’ and the ’89-week EMA’ are placed at
20095 / 5975 and 19053 / 5721 levels, respectively.
The ’20-day EMA’ and the ‘20-week EMA’ are placed at
20570 / 6106 and 20105 / 5980 levels, respectively.
The monthly momentum oscillators are still positively
poised.
On the daily chart, we are now observing a breakout from
the ‘Triangular’ pattern.
Source: Falcon
Trading strategy:
Actionable points:
The bulls have bounced back strongly to conclude the week as
well as month on a cheerful note. As mentioned in our
View
Bullish above 6183
previous report, the ’89 EMA’ on daily chart played a sheet
Expected Targets
6213 - 6289
anchor role for our market. After a decent consolidation, the
Support Levels
6103 - 6070
bulls finally managed to impose their might and surpassed
6100 mark with ease during the concluding session of the
week. As a result, the daily chart now depicts a breakout from
the ‘Triangular Pattern’ (please refer the exhibit). The
theoretical target of this pattern is around 6400; but we would
like to respect the all time high of 6357 and hence, would
initially consider conservative targets of 6275 - 6342. The
above "bullish" hypothesis would be negated if the index closes
below 6070 level. In this scenario, the crucial support of 5970
would then act as a key support for the index. Any sustainable
move below 5970 may bring back the pessimism in our market
and the lower levels of 5875 - 5800 can be then expected.
1
Daily Technical Report
December 02, 2013
Bank Nifty Outlook - (11154)
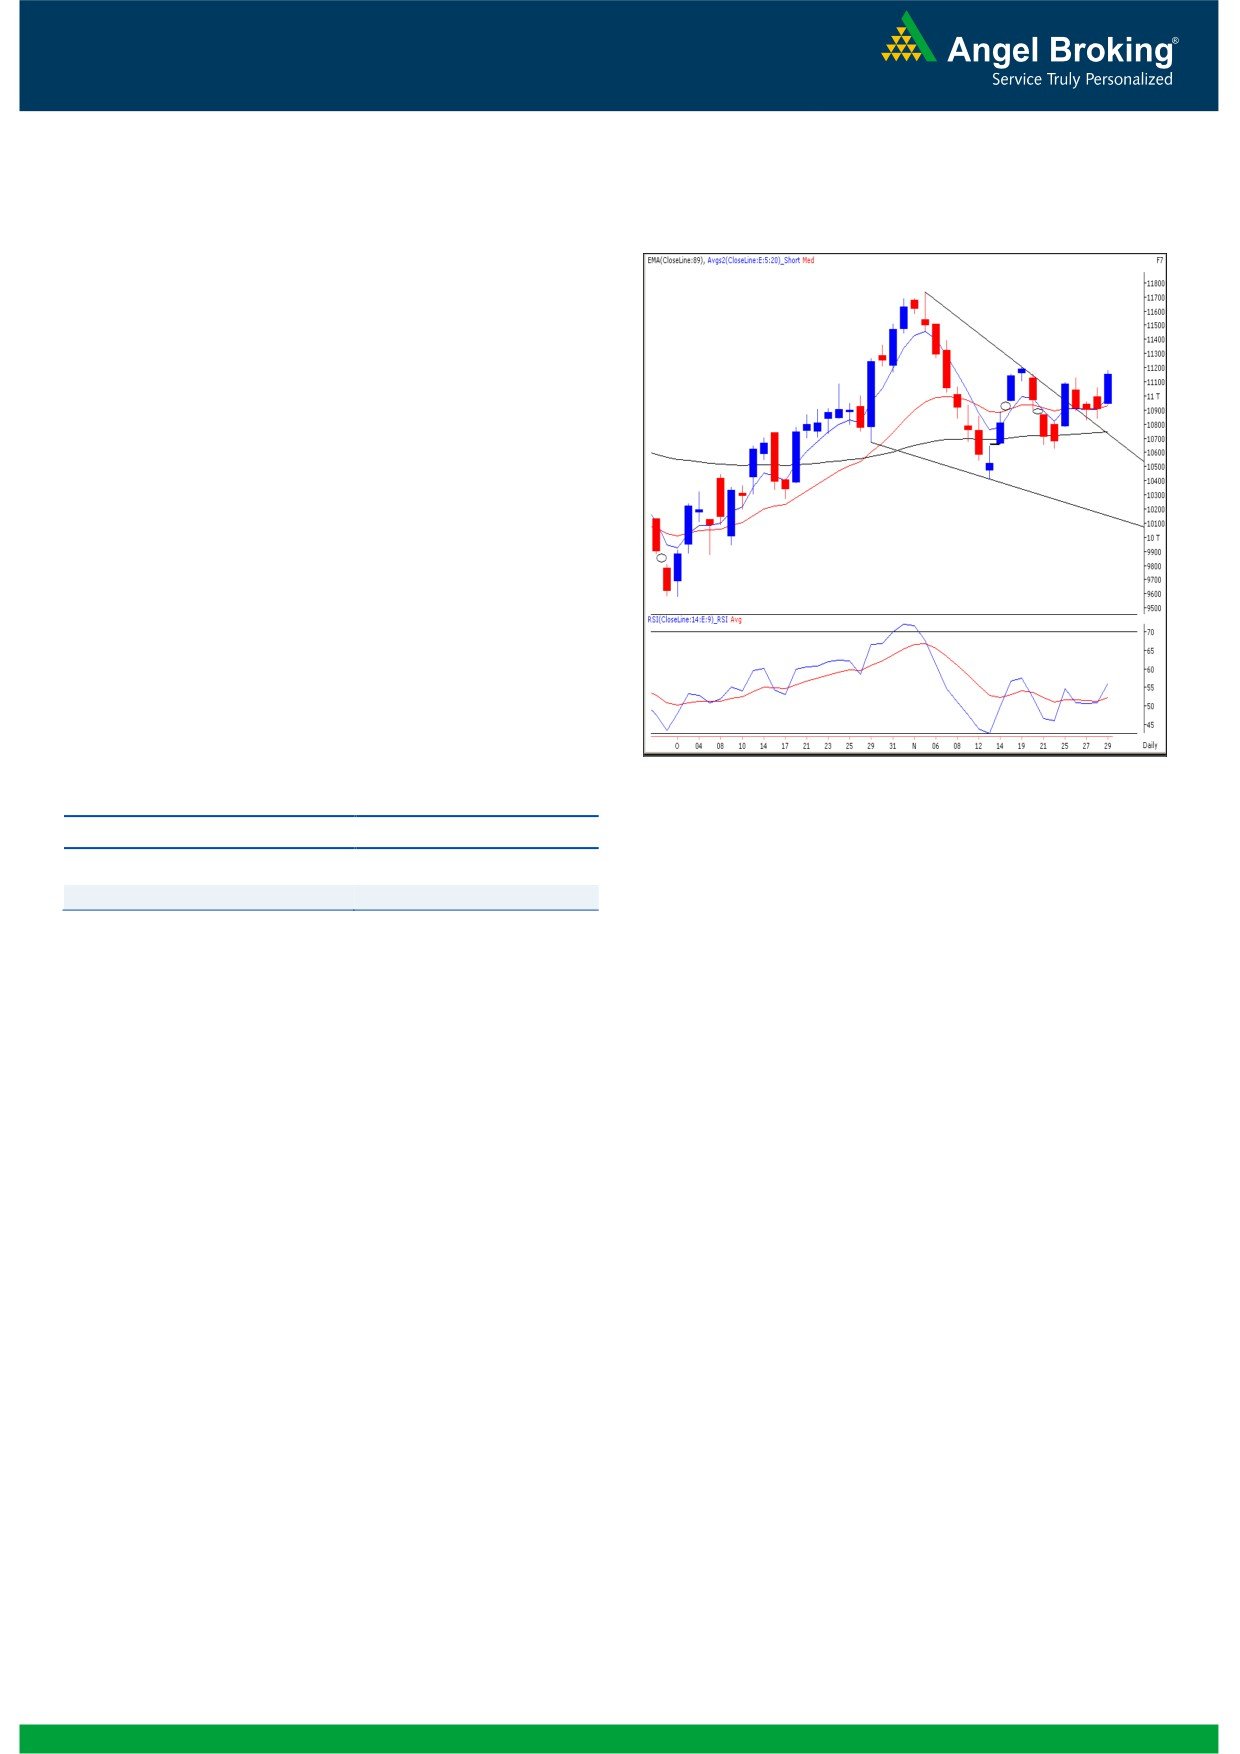
Exhibit 2: Bank Nifty Daily Chart
On Friday, the Bank Nifty too opened on a positive note
and similar to our benchmark index, the Banking index
witnessed immense optimism right from the opening
trade. In the process, the index has posted a close
convincingly above the 11100 mark. As mentioned in our
previous reports, the sideways correction seen in the
previous three sessions proved to be a pullback towards
the trendline support zone (please refer the exhibit).
Considering the current price structure and the overall
trading sentiment, we expect Friday’s momentum to get
extended in coming trading session. Thus, any sustainable
move beyond 11207 level may result in a rally towards
the immediate resistance levels of 11350 - 11400. On
the flip side, 11000 is now a key support level for the
index.
Actionable points:
Source: Falcon
View
Bullish above 11207
Expected Targets
11350 - 11400
Support Level
11000
2
Daily Technical Report
December 02, 2013
Research Team Tel: 022 - 30940000
DISCLAIMER
This document is solely for the personal information of the recipient, and must not be singularly used as the basis of any investment
decision. Nothing in this document should be construed as investment or financial advice. Each recipient of this document should make
such investigations as they deem necessary to arrive at an independent evaluation of an investment in the securities of the companies
referred to in this document (including the merits and risks involved), and should consult their own advisors to determine the merits and
risks of such an investment.
Angel Broking Pvt. Limited, its affiliates, directors, its proprietary trading and investment businesses may, from time to time, make
investment decisions that are inconsistent with or contradictory to the recommendations expressed herein. The views contained in this
document are those of the analyst, and the company may or may not subscribe to all the views expressed within.
Reports based on technical and derivative analysis center on studying charts of a stock's price movement, outstanding positions and
trading volume, as opposed to focusing on a company's fundamentals and, as such, may not match with a report on a company's
fundamentals.
The information in this document has been printed on the basis of publicly available information, internal data and other reliable
sources believed to be true, but we do not represent that it is accurate or complete and it should not be relied on as such, as this
document is for general guidance only. Angel Broking Pvt. Limited or any of its affiliates/ group companies shall not be in any way
responsible for any loss or damage that may arise to any person from any inadvertent error in the information contained in this report.
Angel Broking Pvt. Limited has not independently verified all the information contained within this document. Accordingly, we cannot
testify, nor make any representation or warranty, express or implied, to the accuracy, contents or data contained within this document.
While Angel Broking Pvt. Limited endeavors to update on a reasonable basis the information discussed in this material, there may be
regulatory, compliance, or other reasons that prevent us from doing so.
This document is being supplied to you solely for your information, and its contents, information or data may not be reproduced,
redistributed or passed on, directly or indirectly.
Angel Broking Pvt. Limited and its affiliates may seek to provide or have engaged in providing corporate finance, investment banking
or other advisory services in a merger or specific transaction to the companies referred to in this report, as on the date of this report or
in the past.
Neither Angel Broking Pvt. Limited, nor its directors, employees or affiliates shall be liable for any loss or damage that may arise from
or in connection with the use of this information.
Note: Please refer to the important `Stock Holding Disclosure' report on the Angel website (Research Section). Also, please refer to the
latest update on respective stocks for the disclosure status in respect of those stocks. Angel Broking Pvt. Limited and its affiliates may
have investment positions in the stocks recommended in this report.
Research Team
Shardul Kulkarni
-
Head - Technicals
Sameet Chavan
-
Technical Analyst
Angel Broking Pvt. Ltd.
Registered Office: G-1, Ackruti Trade Centre, Rd. No. 7, MIDC, Andheri (E), Mumbai - 400 093.
Corporate Office: 6th Floor, Ackruti Star, MIDC, Andheri (E), Mumbai - 400 093. Tel: (022) 30940000
Sebi Registration No: INB 010996539
4