Daily Technical Report
September 02, 2013
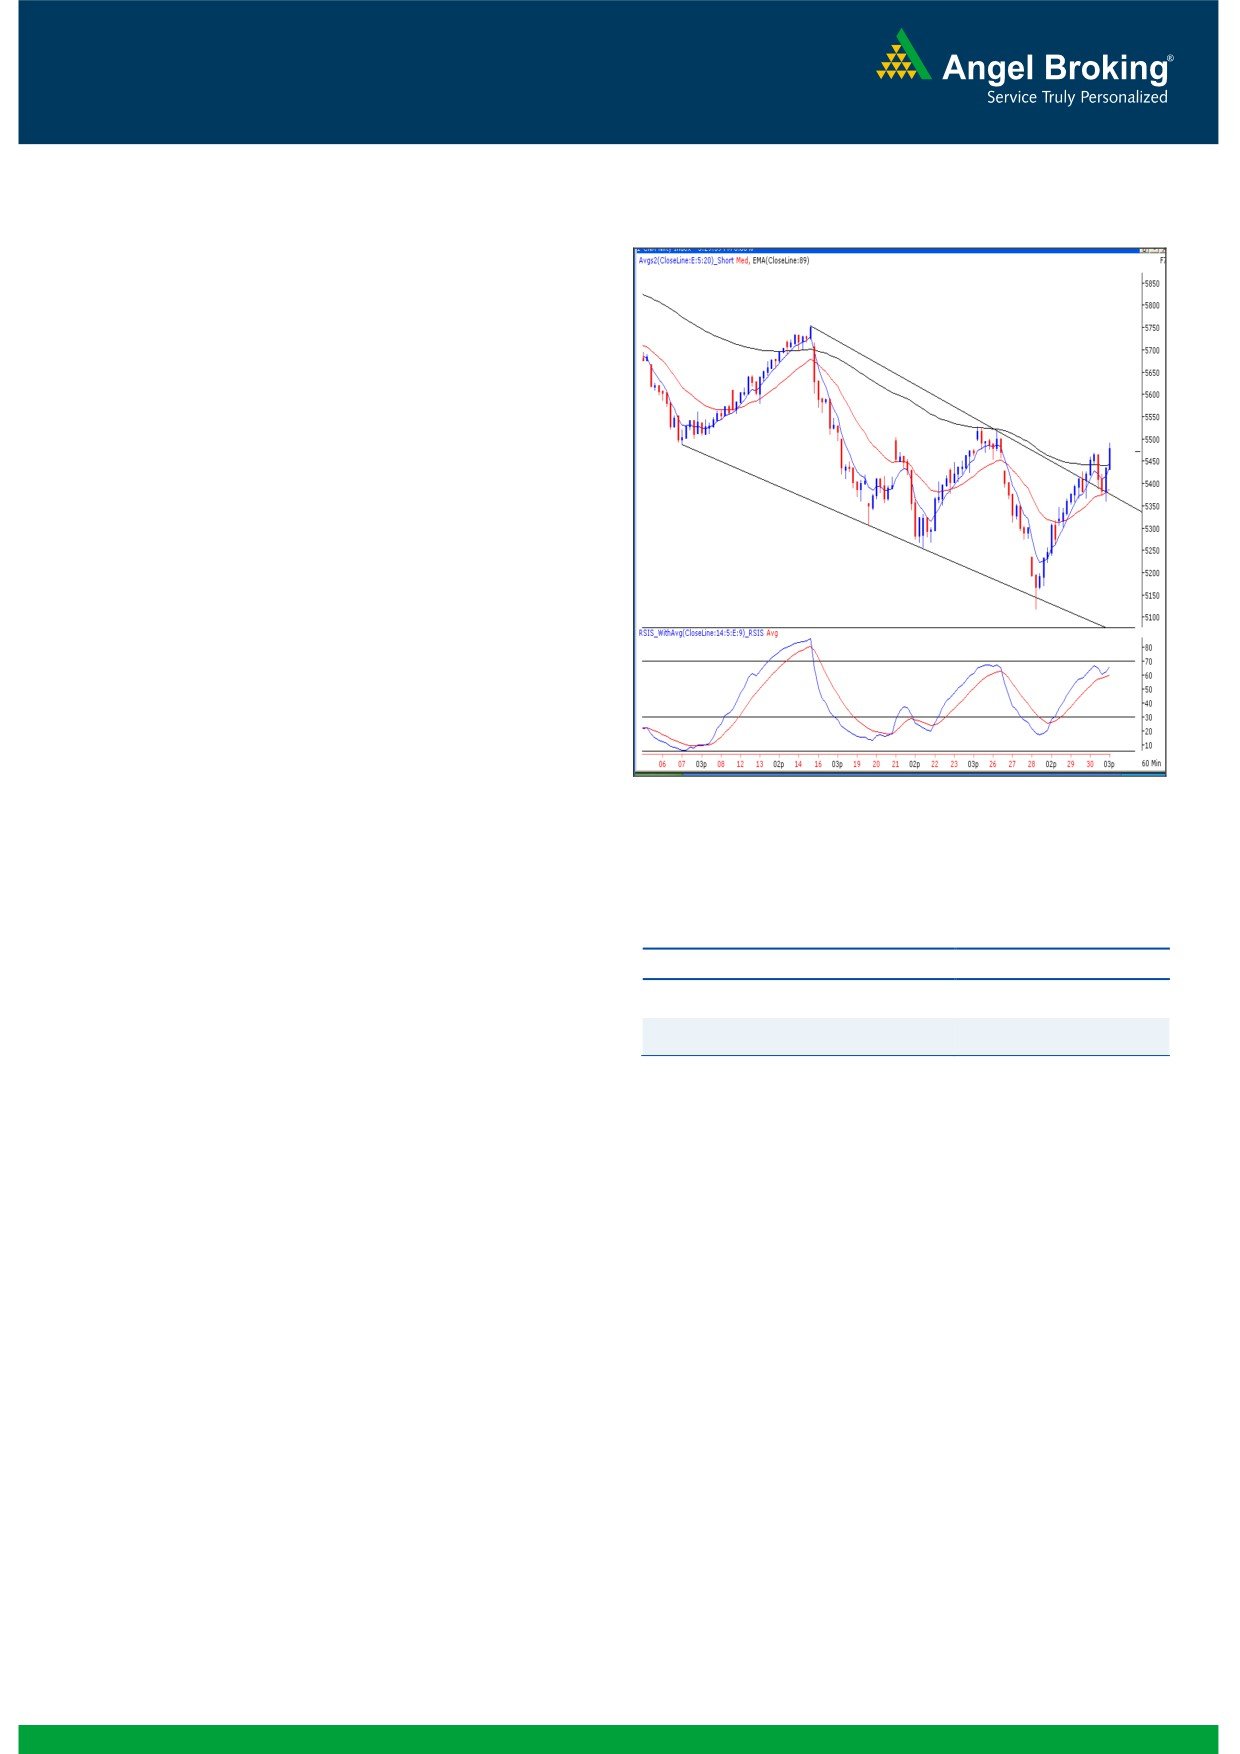
Exhibit 1: Nifty Hourly Chart
Sensex (18620) / NIFTY (5472)
On Friday, our benchmark indices opened on a flat note as
indicated by the SGX nifty. Subsequently, the index picked up
the previous sessions up trend and moved nearly a percent
higher during the first half. During midsession, the index
slipped into negative territory due to immense selling pressure;
but a sharp recovery towards the end led the index to close
almost at the highest point of the day. On the sectoral front,
the Consumer Durables, Healthcare, Banking and IT sectors
were among the leading gainers; whereas the Metal & Capital
goods counters remained under pressure throughout the
session. The advance to decline ratio was marginally in favor
of advancing counters. (A=1137 D=1085) (Source-
Formation
The ’89-day EMA’ and the ’89-week EMA’ are placed at
19164 / 5738 and 18609 / 5613 levels, respectively.
The ’20-day EMA’ and the ‘20-week EMA’ are placed at
Source: Falcon:
18647 / 5514 and 19183 / 5743 levels, respectively.
The monthly ‘RSI-Smoothened’ oscillator is still negatively
poised; whereas the weekly ‘Stochastic’ momentum
Actionable points:
oscillator has given a positive crossover.
View
Bullish above 5495
The weekly chart depicts yet another ‘Bullish Hammer’
Japanese candlestick pattern.
Expected targets
5529 - 5578
Support levels
5363 - 5303
The ‘Lower Top - Lower Bottom’ formation in weekly chart
is still intact.
Trading strategy:
It was a complete roller-coaster ride for the market participants
The weekly ‘Stochastic’ momentum oscillator is also signaling
as we witnessed a ‘V’ shape recovery from the lows. In our
positive crossover. On the lower side, the immediate support
previous report, we had mentioned that if the Nifty stays above
levels are seen around 5360 - 5300 levels. Although the
5504, then we might expect some bounce back in our market.
current price action indicates a near term bounce in our
However, the Nifty could not close above 5504 and corrected
market, we would like to highlight that the intermediate trend
sharply towards our mentioned target of 5100 by Wednesday
remains bearish as the weekly ‘Lower Top Lower Bottom’
afternoon. The second half of the week completely
formation and the Negative crossover in monthly ‘RSI-
overshadowed by the bulls as the recovery from the low of
Smoothened’ oscillator are still intact. Therefore any up
5118 left everyone flabbergasted. The weekly chart now
move in the near term can only be construed as a pullback.
depicts one more ‘Bullish Hammer’ Japanese candlestick
We would advise traders to adopt stock specific approach
pattern. The pattern implication remains same and the pattern
and follow strict stop losses.
needs confirmation in the form of a closing above the high of
5529. In this scenario, we can expect an extended bounce
towards 5640 - 5720 levels. The price pattern in hourly chart
also supports the above mentioned hypothesis. The Nifty has
oscillated within a ‘Downward Sloping Channel’ in hourly chart
and during Friday’s session, a channel pattern breakout has
been confirmed.
1
Daily Technical Report
September 02, 2013
Bank Nifty Outlook - (9049)
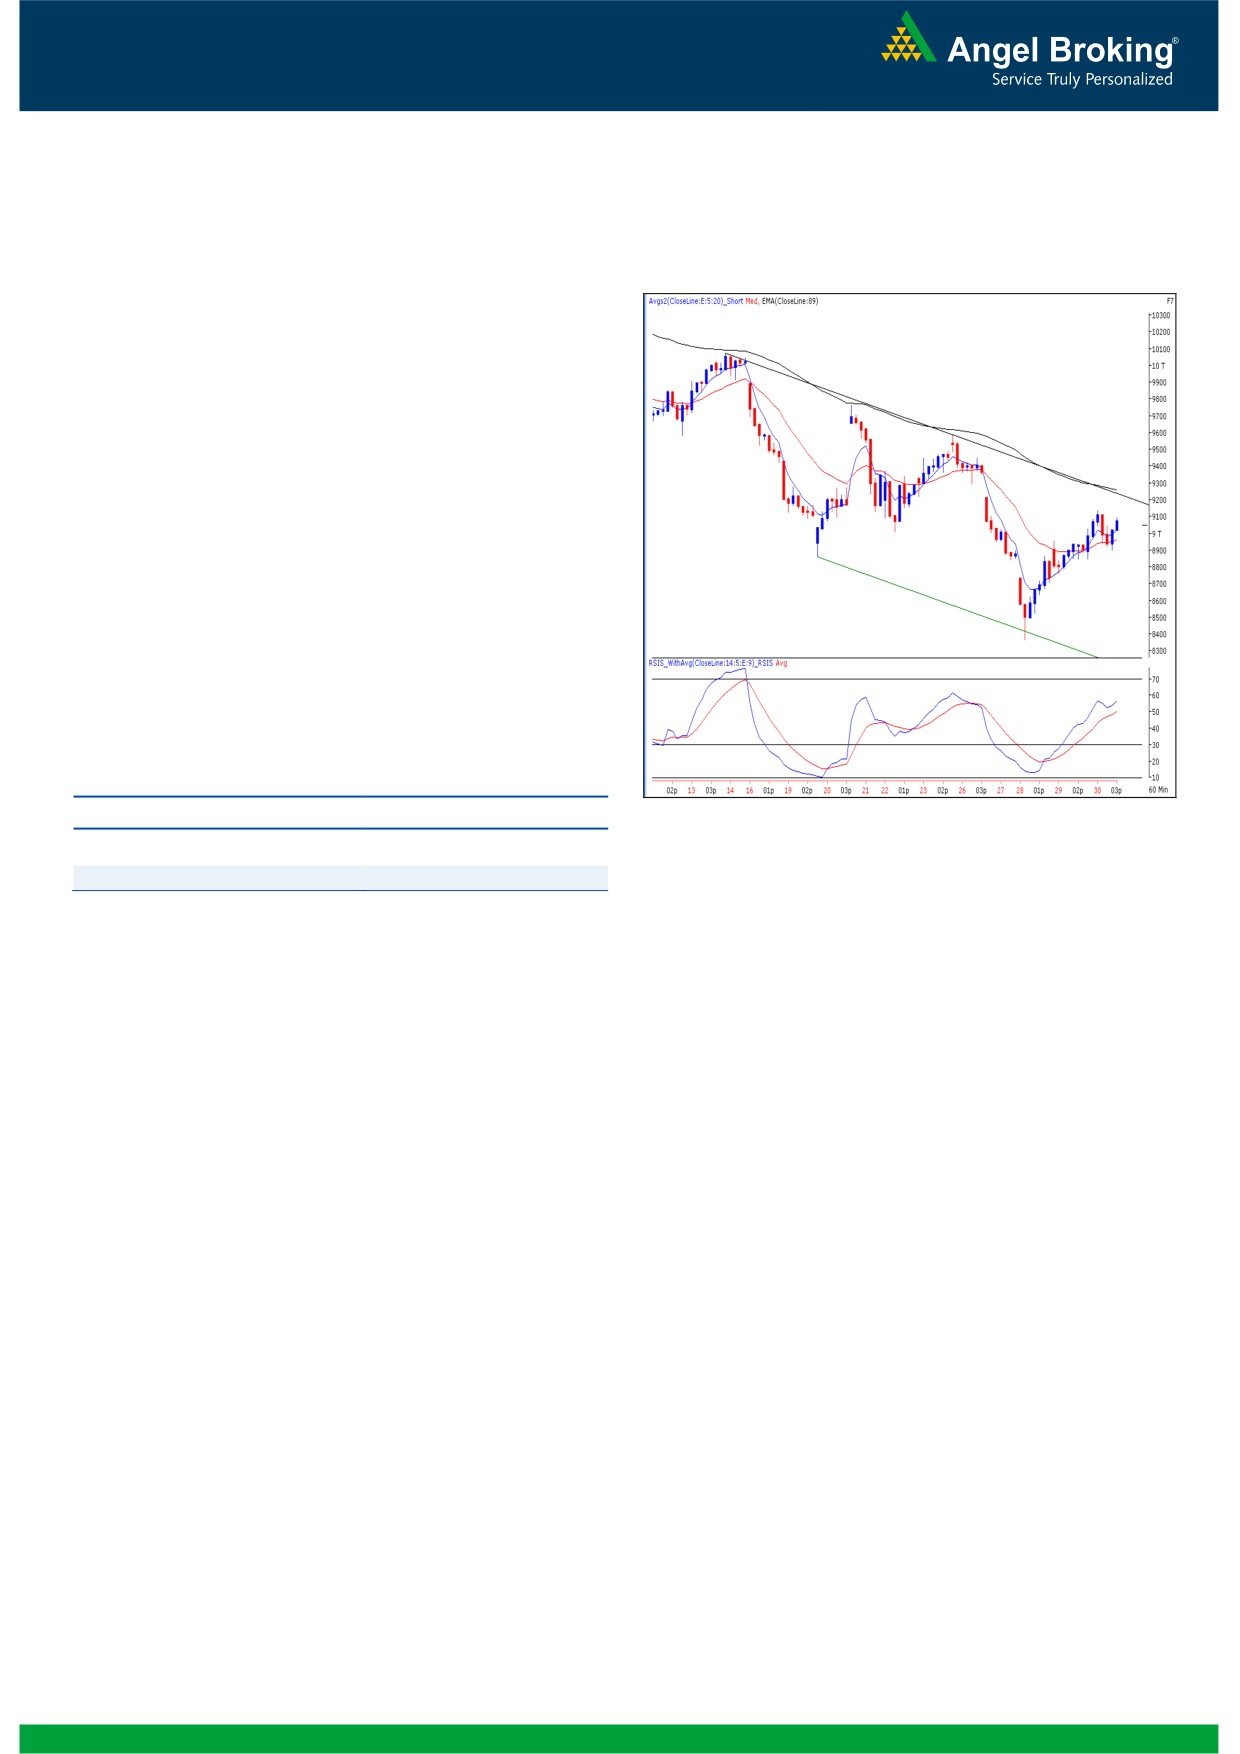
Exhibit 2: Bank Nifty Hourly Chart
On Friday, the Bank Nifty too opened flat in-line with our
benchmark index and the overall price action was similar
where the index recovered sharply from the mid session low.
In the hourly chart, it is clearly seen that the index is
oscillating within the 'Downward Sloping Channel' and has
now approached the upper trend line of the pattern.
Considering the overall price patterns and positive placement
of momentum oscillators in the daily chart, we expect the
Bank Nifty to rally towards 9208 - 9294 if it manages to
sustain above the 9136 level. On the flipside, 9015 - 8899
levels would act as immediate support levels for Bank Nifty in
coming trading session.
Actionable points:
View
Bullish above 9136
Source: Falcon:
Expected targets
9208 - 9294
Support levels
9015 - 8899
2
Daily Technical Report
September 02, 2013
Daily Pivot Levels for Nifty 50 Stocks
SCRIPS
S2
S1
PIVOT
R1
R2
SENSEX
18,117
18,369
18,524
18,775
18,930
NIFTY
5,309
5,390
5,442
5,523
5,575
BANKNIFTY
8,722
8,885
9,010
9,174
9,299
ACC
915
940
958
982
1,000
AMBUJACEM
153
162
168
178
184
ASIANPAINT
382
401
413
433
444
AXISBANK
775
804
848
876
920
BAJAJ-AUTO
1,657
1,747
1,798
1,889
1,940
BANKBARODA
437
449
462
474
487
BHARTIARTL
285
292
297
304
309
BHEL
113
116
118
121
124
BPCL
259
266
271
278
282
CAIRN
311
316
321
326
331
CIPLA
383
400
410
427
437
COALINDIA
231
241
248
259
266
DLF
122
126
130
134
139
DRREDDY
2,135
2,214
2,291
2,369
2,446
GAIL
273
284
291
303
310
GRASIM
2,176
2,218
2,252
2,295
2,329
HCLTECH
997
1,019
1,032
1,054
1,067
HDFC
682
700
717
735
752
HDFCBANK
559
576
588
606
618
HEROMOTOCO
1,887
1,967
2,021
2,101
2,155
HINDALCO
98
102
105
109
112
HINDUNILVR
585
608
624
647
662
ICICIBANK
778
791
809
822
840
IDFC
75
78
82
84
88
INDUSINDBK
334
345
357
368
380
INFY
3,003
3,055
3,089
3,140
3,174
ITC
295
302
307
314
319
JINDALSTEL
200
211
229
240
257
JPASSOCIAT
31
32
33
34
36
KOTAKBANK
585
622
646
683
706
LT
701
713
723
735
745
LUPIN
758
777
804
823
850
M&M
751
767
784
800
818
MARUTI
1,215
1,229
1,239
1,253
1,263
NMDC
115
117
120
122
124
NTPC
126
128
130
133
135
ONGC
234
242
248
256
263
PNB
410
420
432
442
454
POWERGRID
92
95
97
99
101
RANBAXY
386
397
407
418
429
RELIANCE
816
835
847
866
879
RELINFRA
324
333
340
350
357
SBIN
1,449
1,484
1,505
1,540
1,561
SESAGOA
178
183
187
193
197
SUNPHARMA
484
502
522
540
560
TATAMOTORS
285
292
300
307
316
TATAPOWER
71
74
75
77
79
TATASTEEL
258
266
278
286
297
TCS
1,884
1,959
2,004
2,079
2,124
ULTRACEMCO
1,397
1,436
1,467
1,506
1,538
3
Daily Technical Report
September 02, 2013
Research Team Tel: 022 - 30940000
DISCLAIMER
This document is solely for the personal information of the recipient, and must not be singularly used as the basis of any investment
decision. Nothing in this document should be construed as investment or financial advice. Each recipient of this document should make
such investigations as they deem necessary to arrive at an independent evaluation of an investment in the securities of the companies
referred to in this document (including the merits and risks involved), and should consult their own advisors to determine the merits and
risks of such an investment.
Angel Broking Pvt. Limited, its affiliates, directors, its proprietary trading and investment businesses may, from time to time, make
investment decisions that are inconsistent with or contradictory to the recommendations expressed herein. The views contained in this
document are those of the analyst, and the company may or may not subscribe to all the views expressed within.
Reports based on technical and derivative analysis center on studying charts of a stock's price movement, outstanding positions and
trading volume, as opposed to focusing on a company's fundamentals and, as such, may not match with a report on a company's
fundamentals.
The information in this document has been printed on the basis of publicly available information, internal data and other reliable
sources believed to be true, but we do not represent that it is accurate or complete and it should not be relied on as such, as this
document is for general guidance only. Angel Broking Pvt. Limited or any of its affiliates/ group companies shall not be in any way
responsible for any loss or damage that may arise to any person from any inadvertent error in the information contained in this report.
Angel Broking Pvt. Limited has not independently verified all the information contained within this document. Accordingly, we cannot
testify, nor make any representation or warranty, express or implied, to the accuracy, contents or data contained within this document.
While Angel Broking Pvt. Limited endeavors to update on a reasonable basis the information discussed in this material, there may be
regulatory, compliance, or other reasons that prevent us from doing so.
This document is being supplied to you solely for your information, and its contents, information or data may not be reproduced,
redistributed or passed on, directly or indirectly.
Angel Broking Pvt. Limited and its affiliates may seek to provide or have engaged in providing corporate finance, investment banking
or other advisory services in a merger or specific transaction to the companies referred to in this report, as on the date of this report or
in the past.
Neither Angel Broking Pvt. Limited, nor its directors, employees or affiliates shall be liable for any loss or damage that may arise from
or in connection with the use of this information.
Note: Please refer to the important `Stock Holding Disclosure' report on the Angel website (Research Section). Also, please refer to the
latest update on respective stocks for the disclosure status in respect of those stocks. Angel Broking Pvt. Limited and its affiliates may
have investment positions in the stocks recommended in this report.
Research Team
Shardul Kulkarni
-
Head - Technicals
Sameet Chavan
-
Technical Analyst
Sacchitanand Uttekar
-
Technical Analyst
Angel Broking Pvt. Ltd.
Registered Office: G-1, Ackruti Trade Centre, Rd. No. 7, MIDC, Andheri (E), Mumbai - 400 093.
Corporate Office: 6th Floor, Ackruti Star, MIDC, Andheri (E), Mumbai - 400 093. Tel: (022) 30940000
Sebi Registration No: INB 010996539
4