Daily Technical Report
August 02, 2013
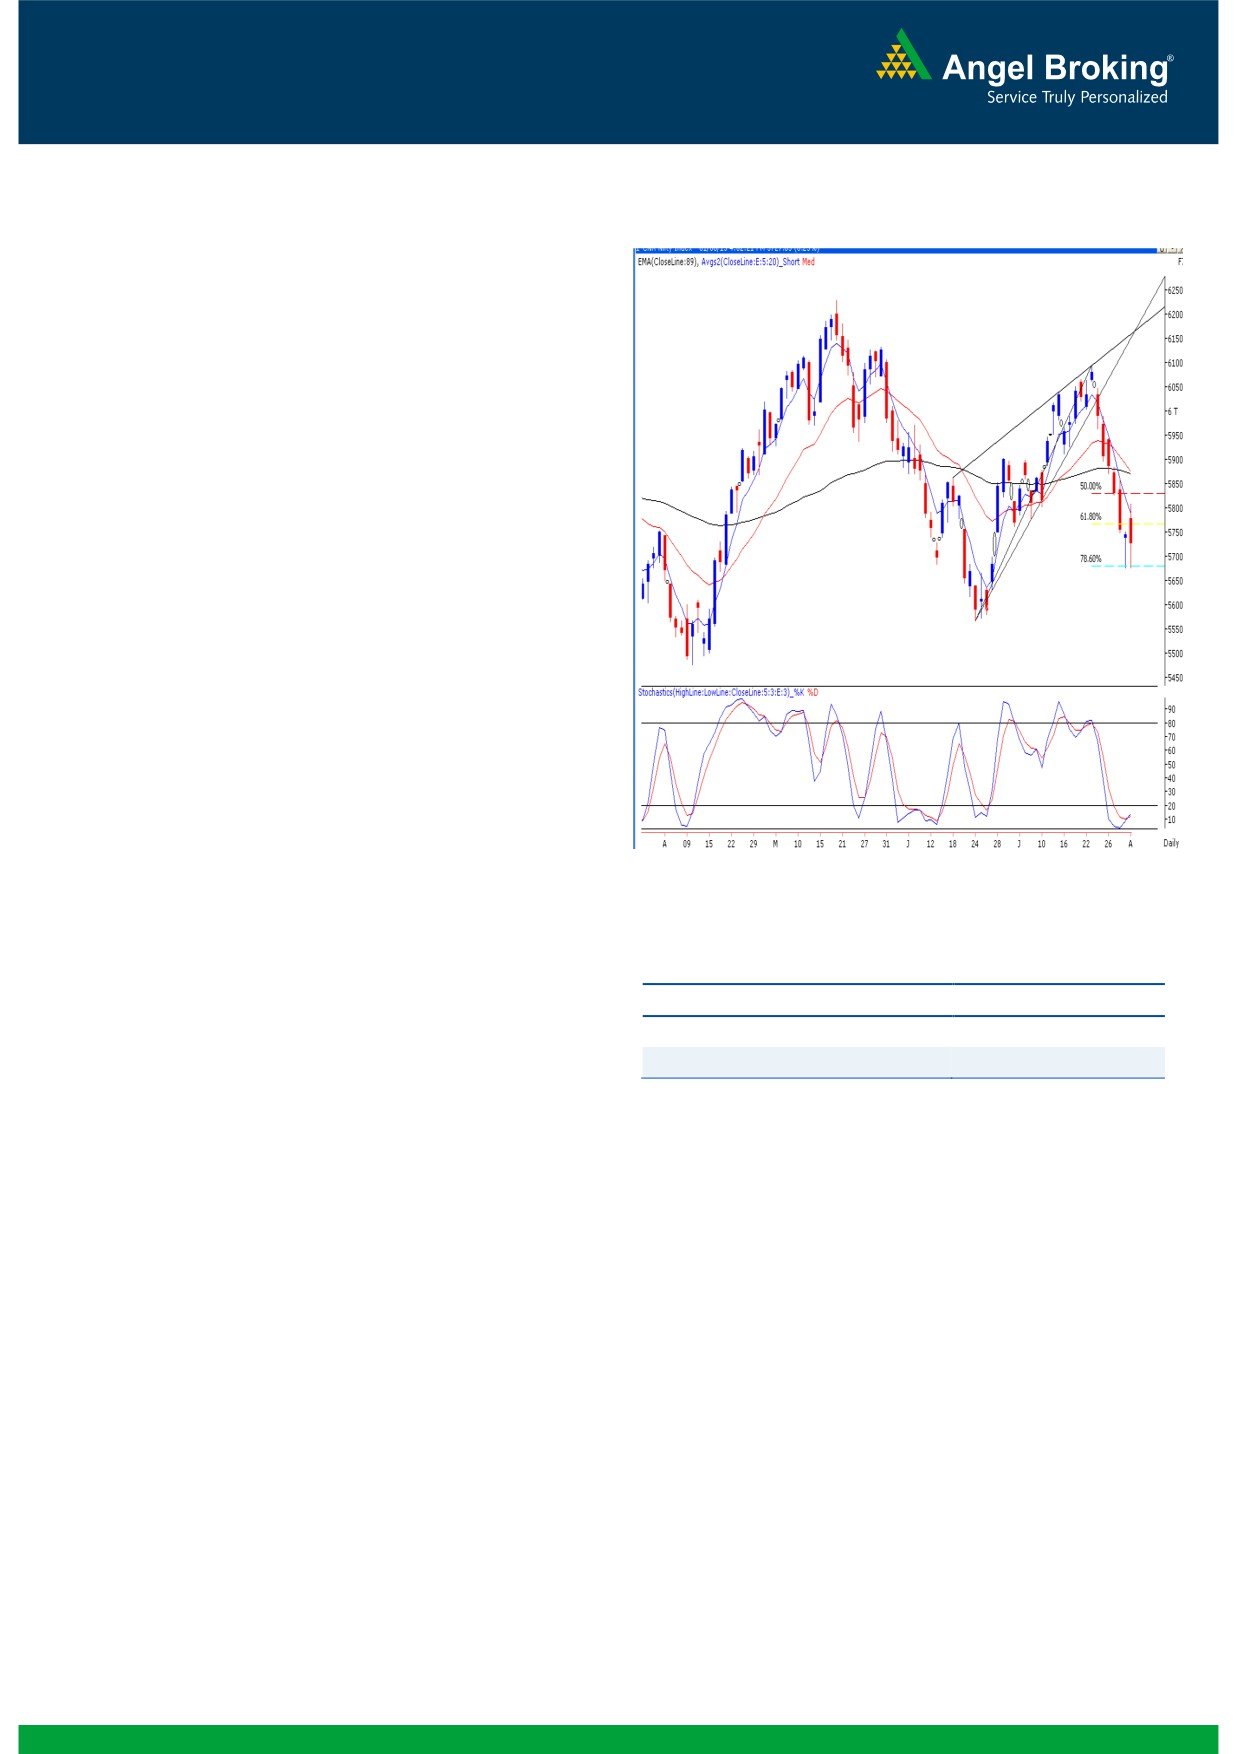
Exhibit 1: Nifty Daily Chart
Sensex (19317) / NIFTY (5728)
Yesterday, our benchmark indices opened higher on the
back of positive global cues but faced significant selling
pressure in the first half. However, during the second half
some recovery was seen in select banking heavyweights and
as a result the markets trimmed their losses, to close
marginally in the red. Once again the Realty, PSUs, Oil &
Gas, Metal Counters showed tremendous weakness during
the session. The Advance to Decline ratio was strongly in
favor of declining counters. (A=761 D=1461) (Source-
Formation
The ’89-day EMA’ and the ’89-week EMA’ are placed at
19479/ 5871 and 18610 / 5625 levels, respectively.
The ’20-day EMA’ and the ‘20-week EMA’ are placed at
19648 / 5875 and 19473 / 5867 respectively.
The hourly ‘RSI-Smoothened’ oscillator’ is signaling a
positive crossover.
On the daily chart, we are observing a ‘Bullish Hammer’
Source: Falcon:
Japanese candlestick pattern.
Actionable points:
Trading strategy:
View
Bullish above 5752
Yesterday's price action can be perfectly described as the
Expected targets
5780 - 5822
'Roller Coaster Ride' as the Nifty moved nearly a percent on
Support Level
5675
both sides. In our previous report, we had mentioned about
the formation of a 'Bullish Hammer' candlestick pattern.
While the momentum oscillators on the daily chart continue
to indicate a strong possibility of a bounce, this candlestick
pattern is still not confirmed and only closing above the
19388 / 5752 mark would signal bullish implications. Post
this confirmation the indices may test the 5822 - 5850
levels. Also, we reiterate our view that Wednesday's low of
5675 is a critical and strong support or the Nifty. Any fall
and close below this level would negate the ‘Bullish
Hammer” pattern and indices may then head towards the
5630 mark.
1
Daily Technical Report
August 02, 2013
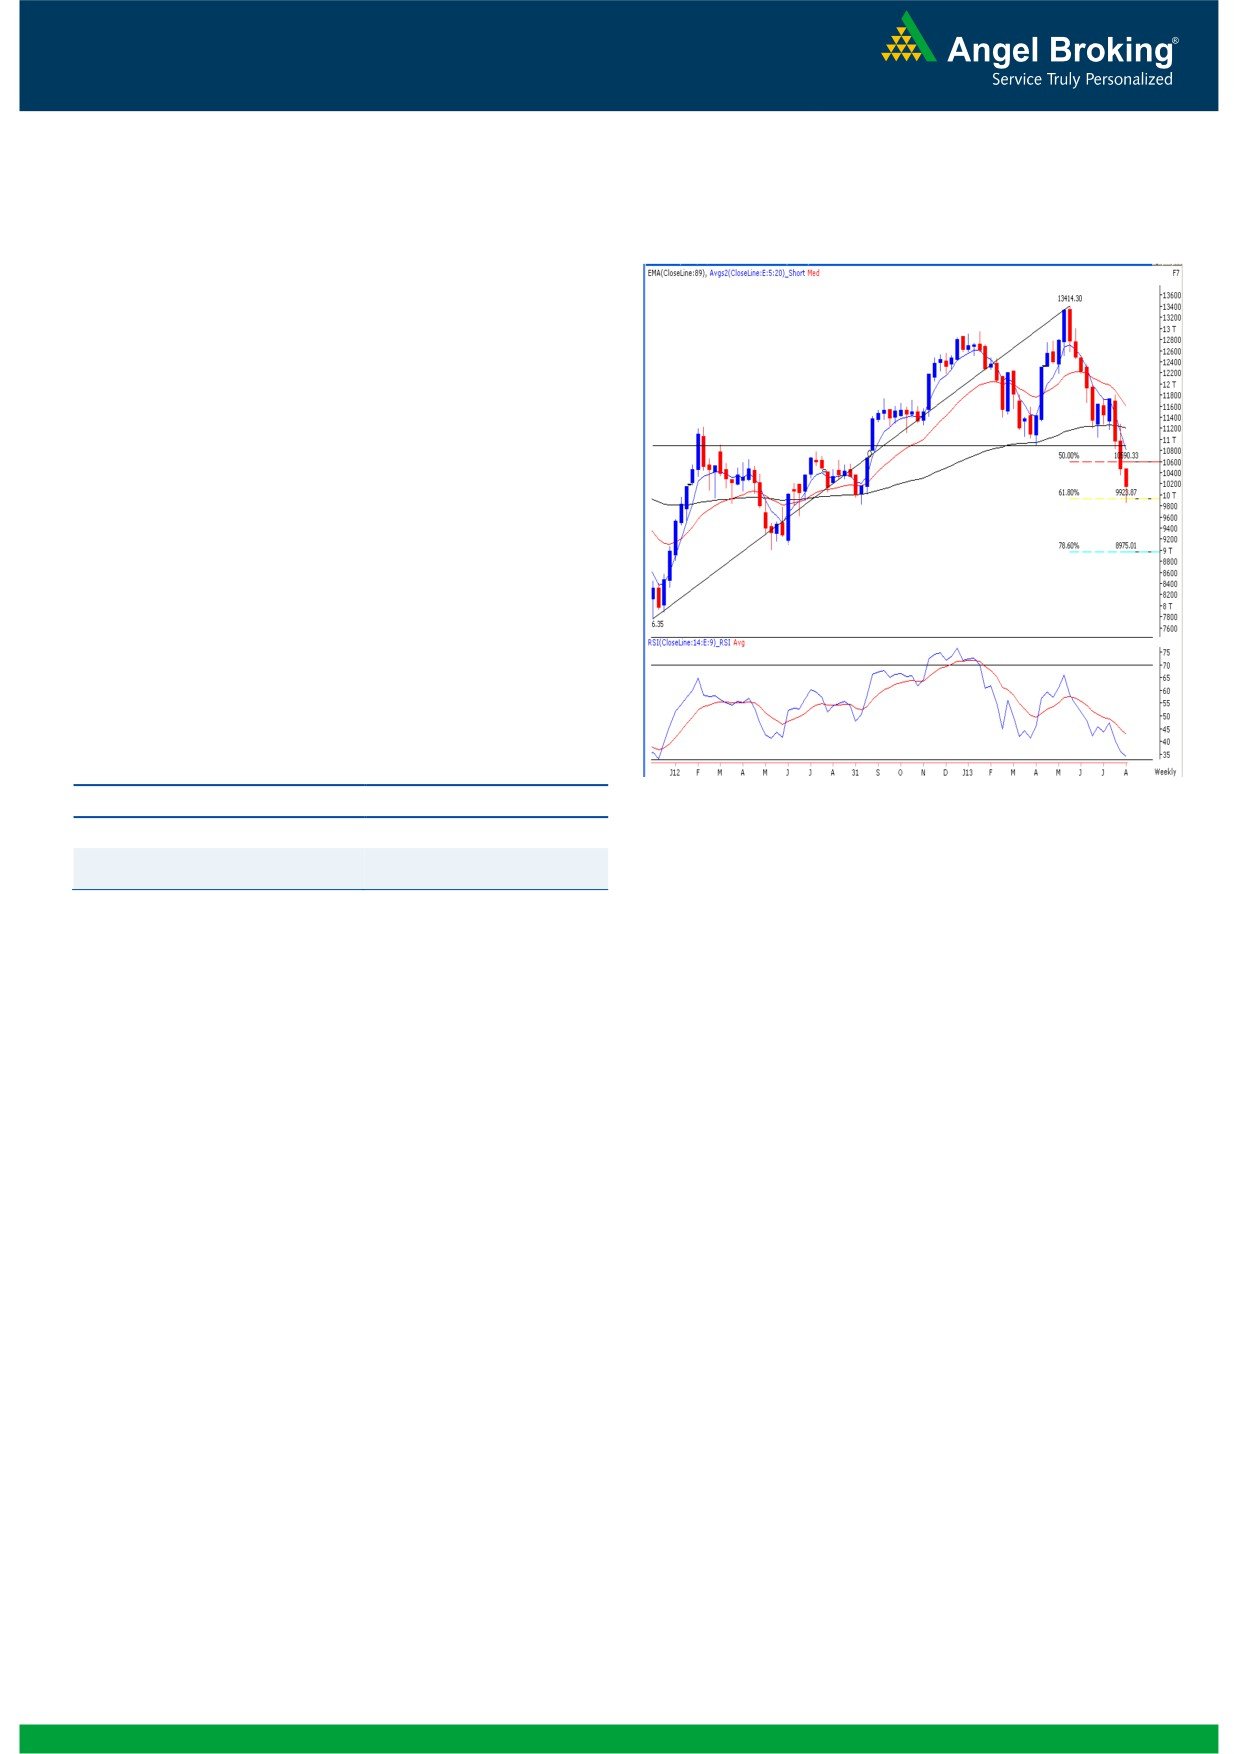
Bank Nifty Outlook - (10143)
Exhibit 2: Bank Nifty Weekly Chart
Yesterday, the Banking counters showed significant resilience
and closed in the green despite the benchmark indices
closing on a weak note. The 61.8% Fibonacci retracement
level (9924) mentioned in the previous reports is proving to
be a decent support for this index and the candlestick pattern
formed in yesterday’s trading session, is quite encouraging.
Going forward, considering the placement of the momentum
oscillators on the daily chart and the chart structure of
individual banking heavyweights, we see the possibility that
the Bank Nifty may continue to move higher if it can cross the
10225 level. A sustainable move beyond this level may lead
the index to test the 10450 - 10590 levels. On the lower side,
a close below the 9863 level would negate all the bullish
prospects in the near term.
Actionable points:
Source: Falcon:
View
Bullish above 10225
Expected Targets
10450 - 10590
Support Levels
9924 - 9863
2
Daily Technical Report
August 02, 2013
Research Team Tel: 022 - 30940000
DISCLAIMER
This document is solely for the personal information of the recipient, and must not be singularly used as the basis of any investment
decision. Nothing in this document should be construed as investment or financial advice. Each recipient of this document should make
such investigations as they deem necessary to arrive at an independent evaluation of an investment in the securities of the companies
referred to in this document (including the merits and risks involved), and should consult their own advisors to determine the merits and
risks of such an investment.
Angel Broking Pvt. Limited, its affiliates, directors, its proprietary trading and investment businesses may, from time to time, make
investment decisions that are inconsistent with or contradictory to the recommendations expressed herein. The views contained in this
document are those of the analyst, and the company may or may not subscribe to all the views expressed within.
Reports based on technical and derivative analysis center on studying charts of a stock's price movement, outstanding positions and
trading volume, as opposed to focusing on a company's fundamentals and, as such, may not match with a report on a company's
fundamentals.
The information in this document has been printed on the basis of publicly available information, internal data and other reliable
sources believed to be true, but we do not represent that it is accurate or complete and it should not be relied on as such, as this
document is for general guidance only. Angel Broking Pvt. Limited or any of its affiliates/ group companies shall not be in any way
responsible for any loss or damage that may arise to any person from any inadvertent error in the information contained in this report.
Angel Broking Pvt. Limited has not independently verified all the information contained within this document. Accordingly, we cannot
testify, nor make any representation or warranty, express or implied, to the accuracy, contents or data contained within this document.
While Angel Broking Pvt. Limited endeavors to update on a reasonable basis the information discussed in this material, there may be
regulatory, compliance, or other reasons that prevent us from doing so.
This document is being supplied to you solely for your information, and its contents, information or data may not be reproduced,
redistributed or passed on, directly or indirectly.
Angel Broking Pvt. Limited and its affiliates may seek to provide or have engaged in providing corporate finance, investment banking
or other advisory services in a merger or specific transaction to the companies referred to in this report, as on the date of this report or
in the past.
Neither Angel Broking Pvt. Limited, nor its directors, employees or affiliates shall be liable for any loss or damage that may arise from
or in connection with the use of this information.
Note: Please refer to the important `Stock Holding Disclosure' report on the Angel website (Research Section). Also, please refer to the
latest update on respective stocks for the disclosure status in respect of those stocks. Angel Broking Pvt. Limited and its affiliates may
have investment positions in the stocks recommended in this report.
Research Team
Shardul Kulkarni
-
Head - Technicals
Sameet Chavan
-
Technical Analyst
Sacchitanand Uttekar
-
Technical Analyst
Angel Broking Pvt. Ltd.
Registered Office: G-1, Ackruti Trade Centre, Rd. No. 7, MIDC, Andheri (E), Mumbai - 400 093.
Corporate Office: 6th Floor, Ackruti Star, MIDC, Andheri (E), Mumbai - 400 093. Tel: (022) 30940000
Sebi Registration No: INB 010996539
4