Daily Technical Report
June 02, 2014
Sensex (24217) / Nifty (7230)
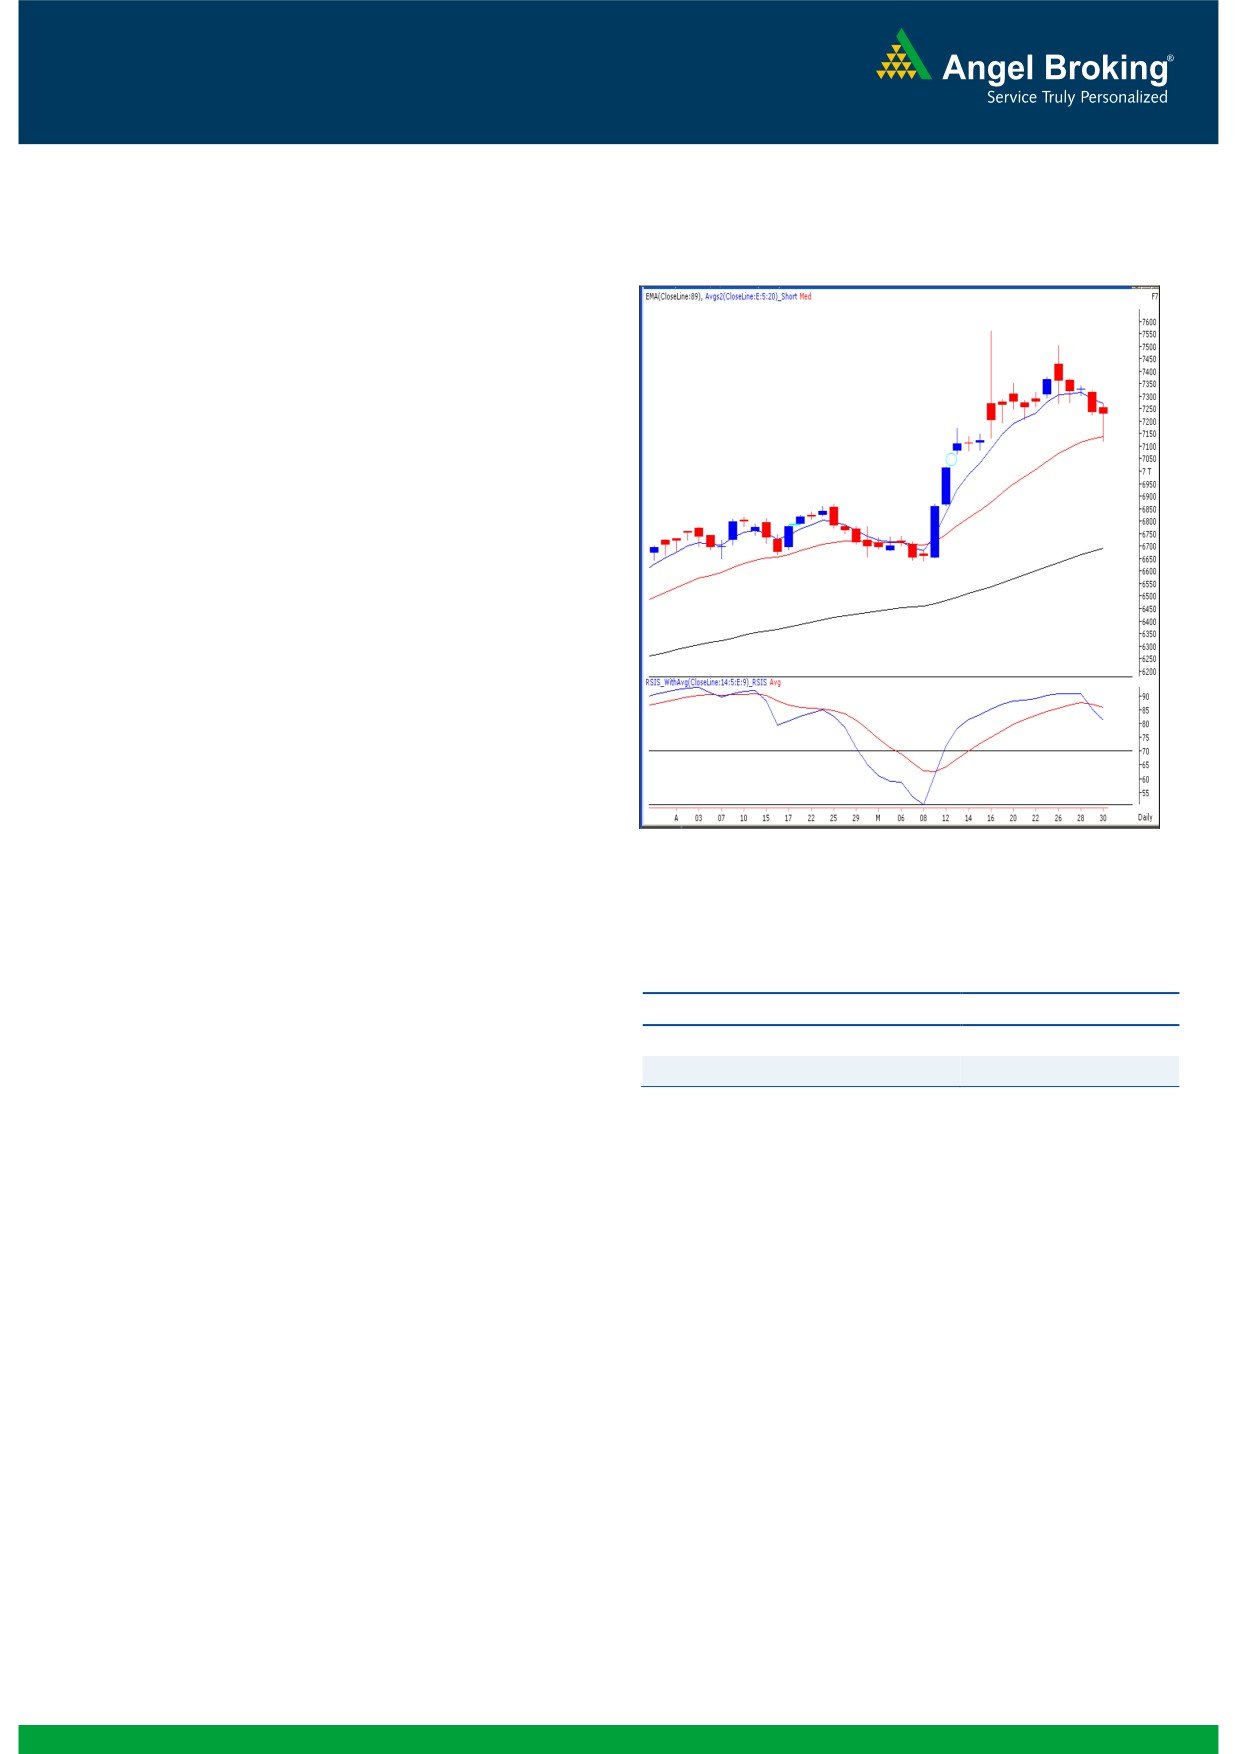
Exhibit 1: Nifty Daily Chart
On Friday, our benchmark index opened on a positive note
considering mixed global cues. Subsequently, index
remained slightly under pressure for most part of the
remaining session and finally managed to close with
nominal losses. On the sectoral front, the Banking and
Consumer durable counters were among the major losers;
whereas the Health care and FMCG sector outperformed
our benchmark index. The advance to decline ratio was
marginally in favor of the advancing counters. (A=1545
Formation
The ’89-day EMA’ and the ’89-week EMA’ are placed at
22428 / 6690 and 20359 / 6094 levels, respectively.
The ’20-day EMA’ and the ‘20-week EMA’ are placed at
23918 / 7137 and 22441 / 6696 levels, respectively.
Trading strategy:
Source: Falcon
After three positive trading weeks and a vertical rally,
traders chose to take some money off the table. The Nifty
Actionable points:
maintained its trading range of 7564 to 7067 mentioned in
our previous report by correcting immediately after
View
Neutral
surpassing the 7500 mark early in the week. It’s been a
Support Levels
7190 - 7130
gradual slide over the entire week and eventually the Nifty
Resistance Levels
7273- 7300
managed to take a halt around the hourly ‘89 EMA’ level of
7220. Looking at the daily chart structure and the negative
placement of ‘RSI-Smoothened’ oscillator, we expect this
important support level to get broken in the coming sessions
and the correction may get extended towards 7130 - 7080
levels. These levels coincide with the daily ’20 EMA’ and
hence, can be considered as a strong support zone. In fact,
we feel that this corrective phase is very essential for the
market from a longer term perspective. We advise traders
to start accumulating stocks with a value buying proposition
around this support zone. On the other hand, 7345 - 7373
are seen as strong resistance levels for the market.
1
Daily Technical Report
June 02, 2014
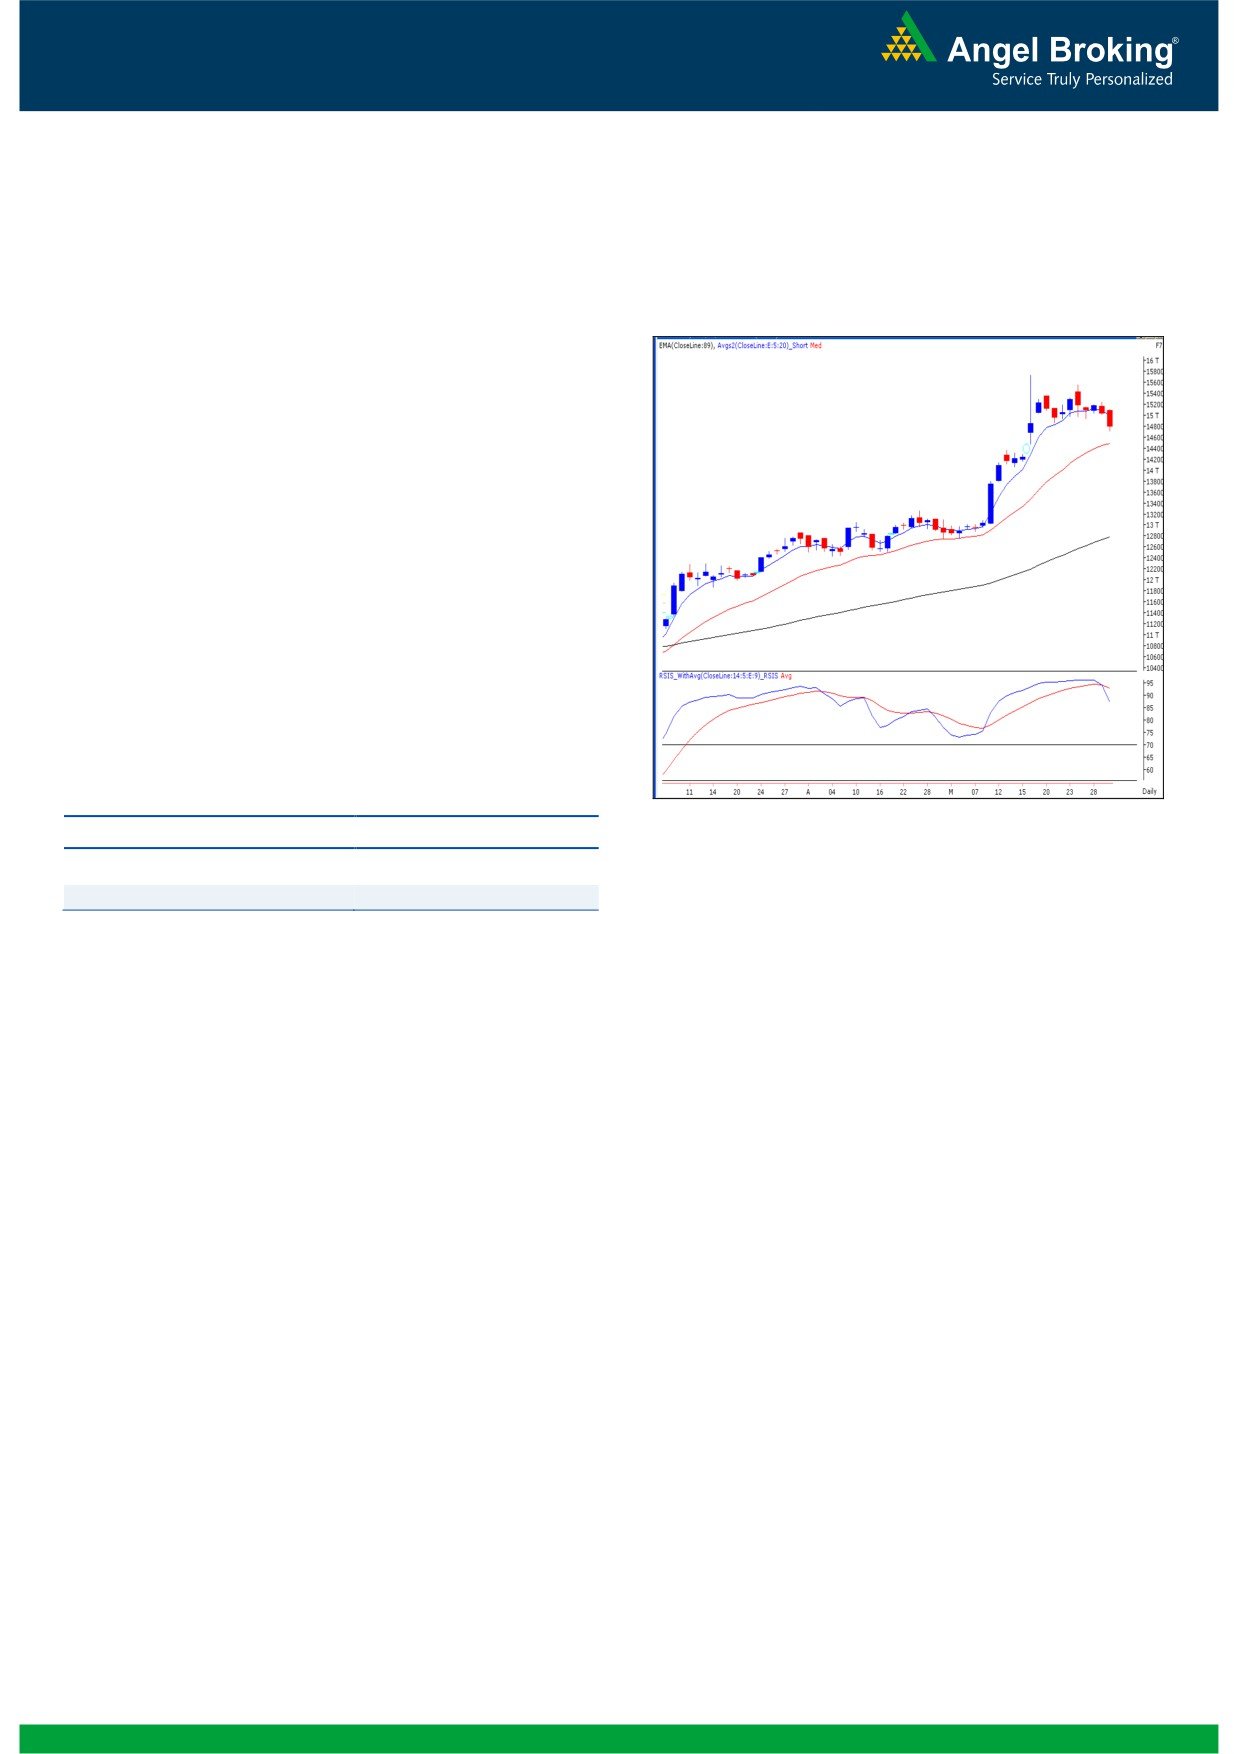
Bank Nifty Outlook - (14793)
Exhibit 2: Bank Nifty Daily Chart
On Friday, the banking index too opened on a positive
note in line with our benchmark index. However, we
Source: Falcon
witnessed strong selling pressure right from the opening
trade. The selling pressure intensified as the day
progressed and in the process, the Bank Nifty
underperformed our benchmark index by far. Looking at
the hourly chart, it is clearly seen that the banking index
has closed tad below the ‘89EMA’ level of 14818; which
is a sign of further weakness. In addition, the daily ‘RSI
Smoothened’ momentum oscillator has now given a
negative crossover from the extreme overbought zone.
Hence, we expect Bank Nifty to continue ongoing
correction towards 14600 - 14460 levels. On the flipside,
14910 - 15110 levels would now act as immediate
resistance levels.
Actionable points:
View
Bearish
Support Levels
14600 - 14460
Resistance Level
14910 - 15110
2
Daily Technical Report
June 02, 2014
Research Team Tel: 022 - 30940000
DISCLAIMER
This document is solely for the personal information of the recipient, and must not be singularly used as the basis of any investment
decision. Nothing in this document should be construed as investment or financial advice. Each recipient of this document should make
such investigations as they deem necessary to arrive at an independent evaluation of an investment in the securities of the companies
referred to in this document (including the merits and risks involved), and should consult their own advisors to determine the merits and
risks of such an investment.
Angel Broking Pvt. Limited, its affiliates, directors, its proprietary trading and investment businesses may, from time to time, make
investment decisions that are inconsistent with or contradictory to the recommendations expressed herein. The views contained in this
document are those of the analyst, and the company may or may not subscribe to all the views expressed within.
Reports based on technical and derivative analysis center on studying charts of a stock's price movement, outstanding positions and
trading volume, as opposed to focusing on a company's fundamentals and, as such, may not match with a report on a company's
fundamentals.
The information in this document has been printed on the basis of publicly available information, internal data and other reliable
sources believed to be true, but we do not represent that it is accurate or complete and it should not be relied on as such, as this
document is for general guidance only. Angel Broking Pvt. Limited or any of its affiliates/ group companies shall not be in any way
responsible for any loss or damage that may arise to any person from any inadvertent error in the information contained in this report.
Angel Broking Pvt. Limited has not independently verified all the information contained within this document. Accordingly, we cannot
testify, nor make any representation or warranty, express or implied, to the accuracy, contents or data contained within this document.
While Angel Broking Pvt. Limited endeavors to update on a reasonable basis the information discussed in this material, there may be
regulatory, compliance, or other reasons that prevent us from doing so.
This document is being supplied to you solely for your information, and its contents, information or data may not be reproduced,
redistributed or passed on, directly or indirectly.
Angel Broking Pvt. Limited and its affiliates may seek to provide or have engaged in providing corporate finance, investment banking
or other advisory services in a merger or specific transaction to the companies referred to in this report, as on the date of this report or
in the past.
Neither Angel Broking Pvt. Limited, nor its directors, employees or affiliates shall be liable for any loss or damage that may arise from
or in connection with the use of this information.
Note: Please refer to the important `Stock Holding Disclosure' report on the Angel website (Research Section). Also, please refer to the
latest update on respective stocks for the disclosure status in respect of those stocks. Angel Broking Pvt. Limited and its affiliates may
have investment positions in the stocks recommended in this report.
Research Team
Sameet Chavan
-
Technical Analyst
Angel Broking Pvt. Ltd.
Registered Office: G-1, Ackruti Trade Centre, Rd. No. 7, MIDC, Andheri (E), Mumbai - 400 093.
Corporate Office: 6th Floor, Ackruti Star, MIDC, Andheri (E), Mumbai - 400 093. Tel: (022) 30940000
Sebi Registration No: INB 010996539
4