Daily Technical Report
April 02, 2014
Sensex (22446) / Nifty (6721)
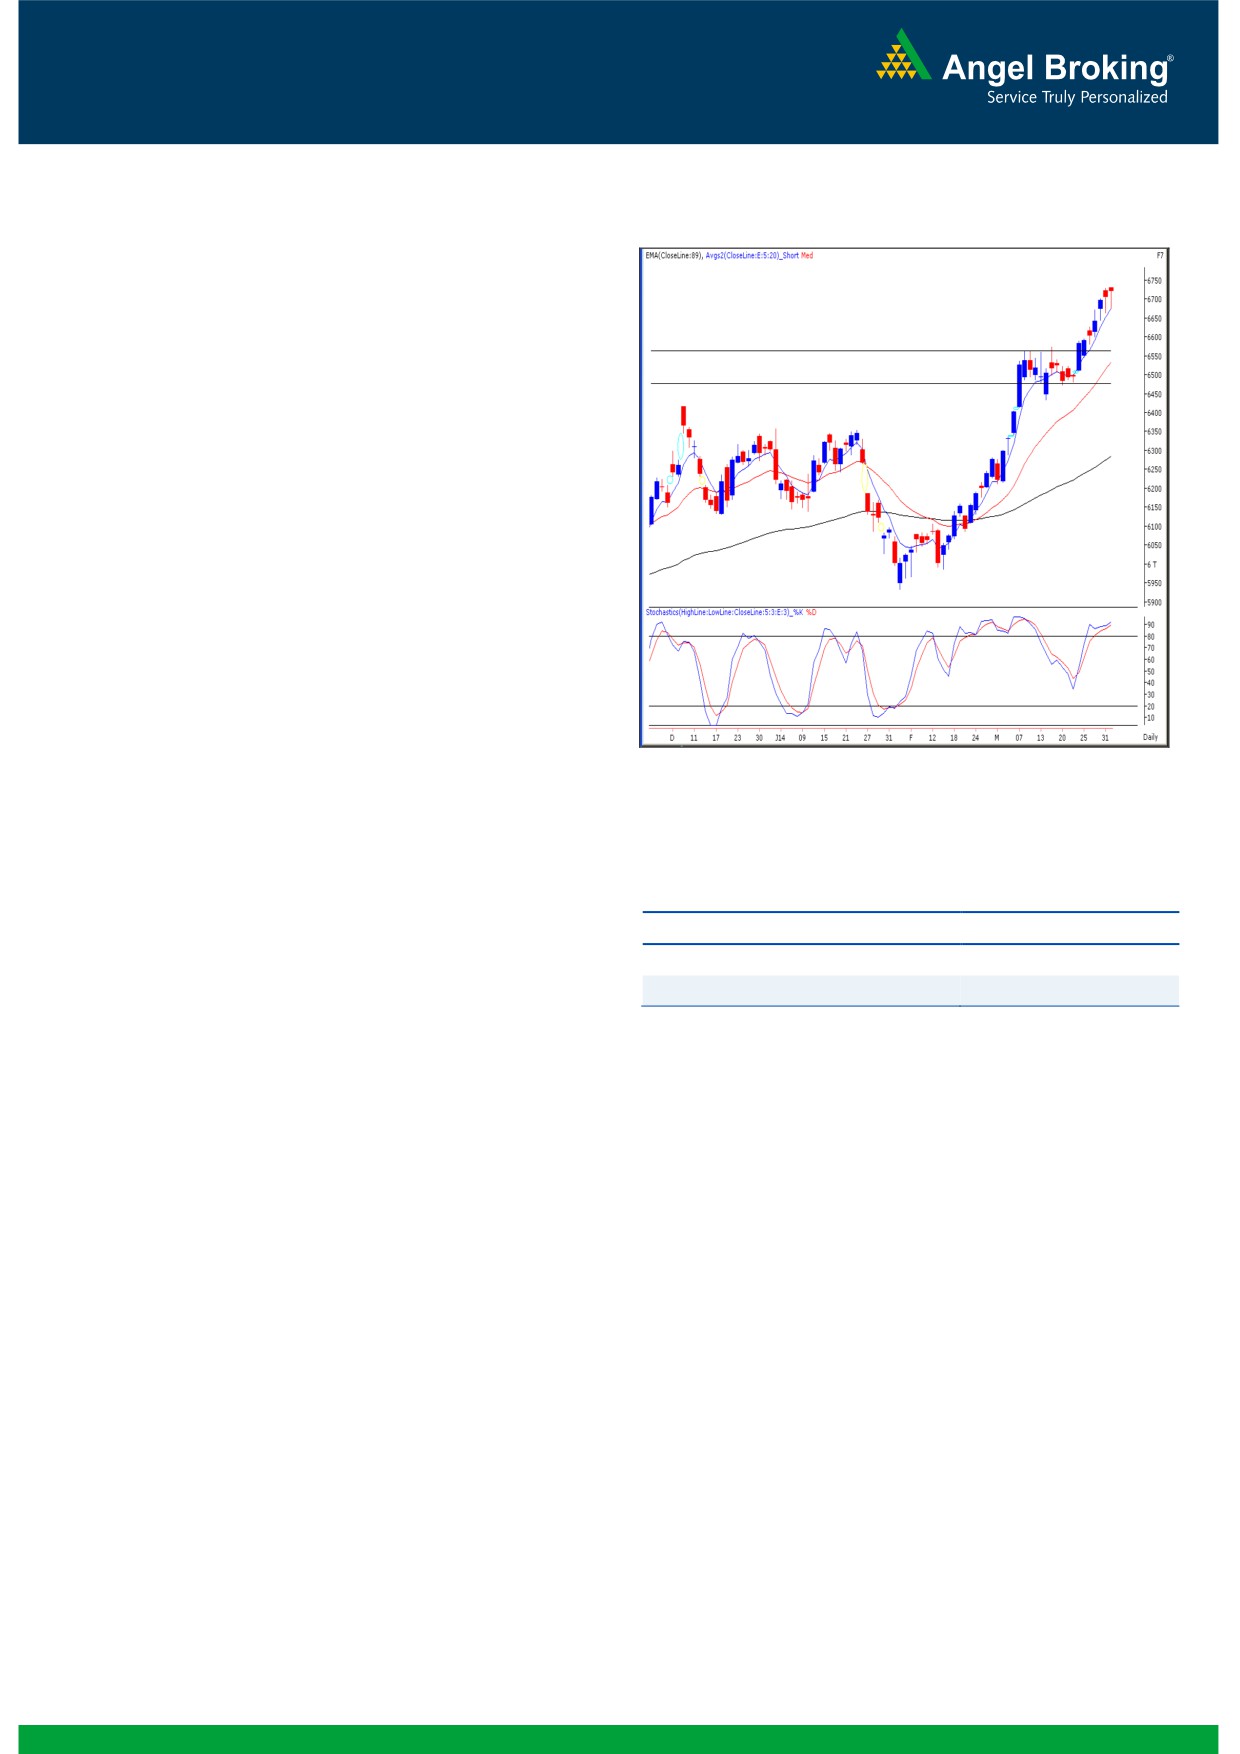
Exhibit 1: Nifty Daily Chart
Yesterday, our benchmark index opened on a muted note
considering quiet mood across the globe. Once again index
witnessed a modest profit booking near day’s high and as a
result slipped inside the negative territory. However, a smart
recovery from day’s low resulted in a closing with nominal
gains. On the sectoral front, the Banking and Realty sectors
were sunder pressure; whereas the IT, TECH and Consumer
Durables counters were the major gainers. The advance to
decline ratio was strongly in favor of the advancing counters.
Formation
The ’89-day EMA’ and the ’89-week EMA’ are placed at
21046 / 6265 and 19714 / 5903 levels, respectively.
The ’20-day EMA’ and the ‘20-week EMA’ are placed at
21761 / 6493 and 21061 / 6272 levels, respectively.
Source: Falcon
Trading strategy:
Actionable points:
Our markets opened on a flat note and traded in a narrow
range just ahead of RBI monetary policy announcement. Post
View
Neutral
the event, index shed a bit from day’s high and sneaked below
Resistance Levels
6750 - 6800
the 6700 mark. However, the hourly ’20 EMA’ acted as a
strong support for the index and as a result, strong buying
Support Levels
6675 - 6580
interest among few heavyweight constituents pulled the index
back into the positive territory. Last two sessions’ movement
was quite identical and hence, we are observing yet another
‘Hanging Man’ Japanese candlestick pattern on the daily chart.
An occurrence of such pattern at market top does not bode
well for the bulls. But, we reiterate that considering monthly
breakout from the ‘Ascending Triangle’, we can only expect a
near term correction towards 6580 - 6540 levels if the Nifty
manages to close below yesterday’s low of 6675. On the
higher side, 6750 - 6800 are seen as an immediate resistance
zone for the market. We reiterate that traders should adopt a
stock centric approach and avoid taking undue risk.
1
Daily Technical Report
April 02, 2014
Bank Nifty Outlook - (12589)
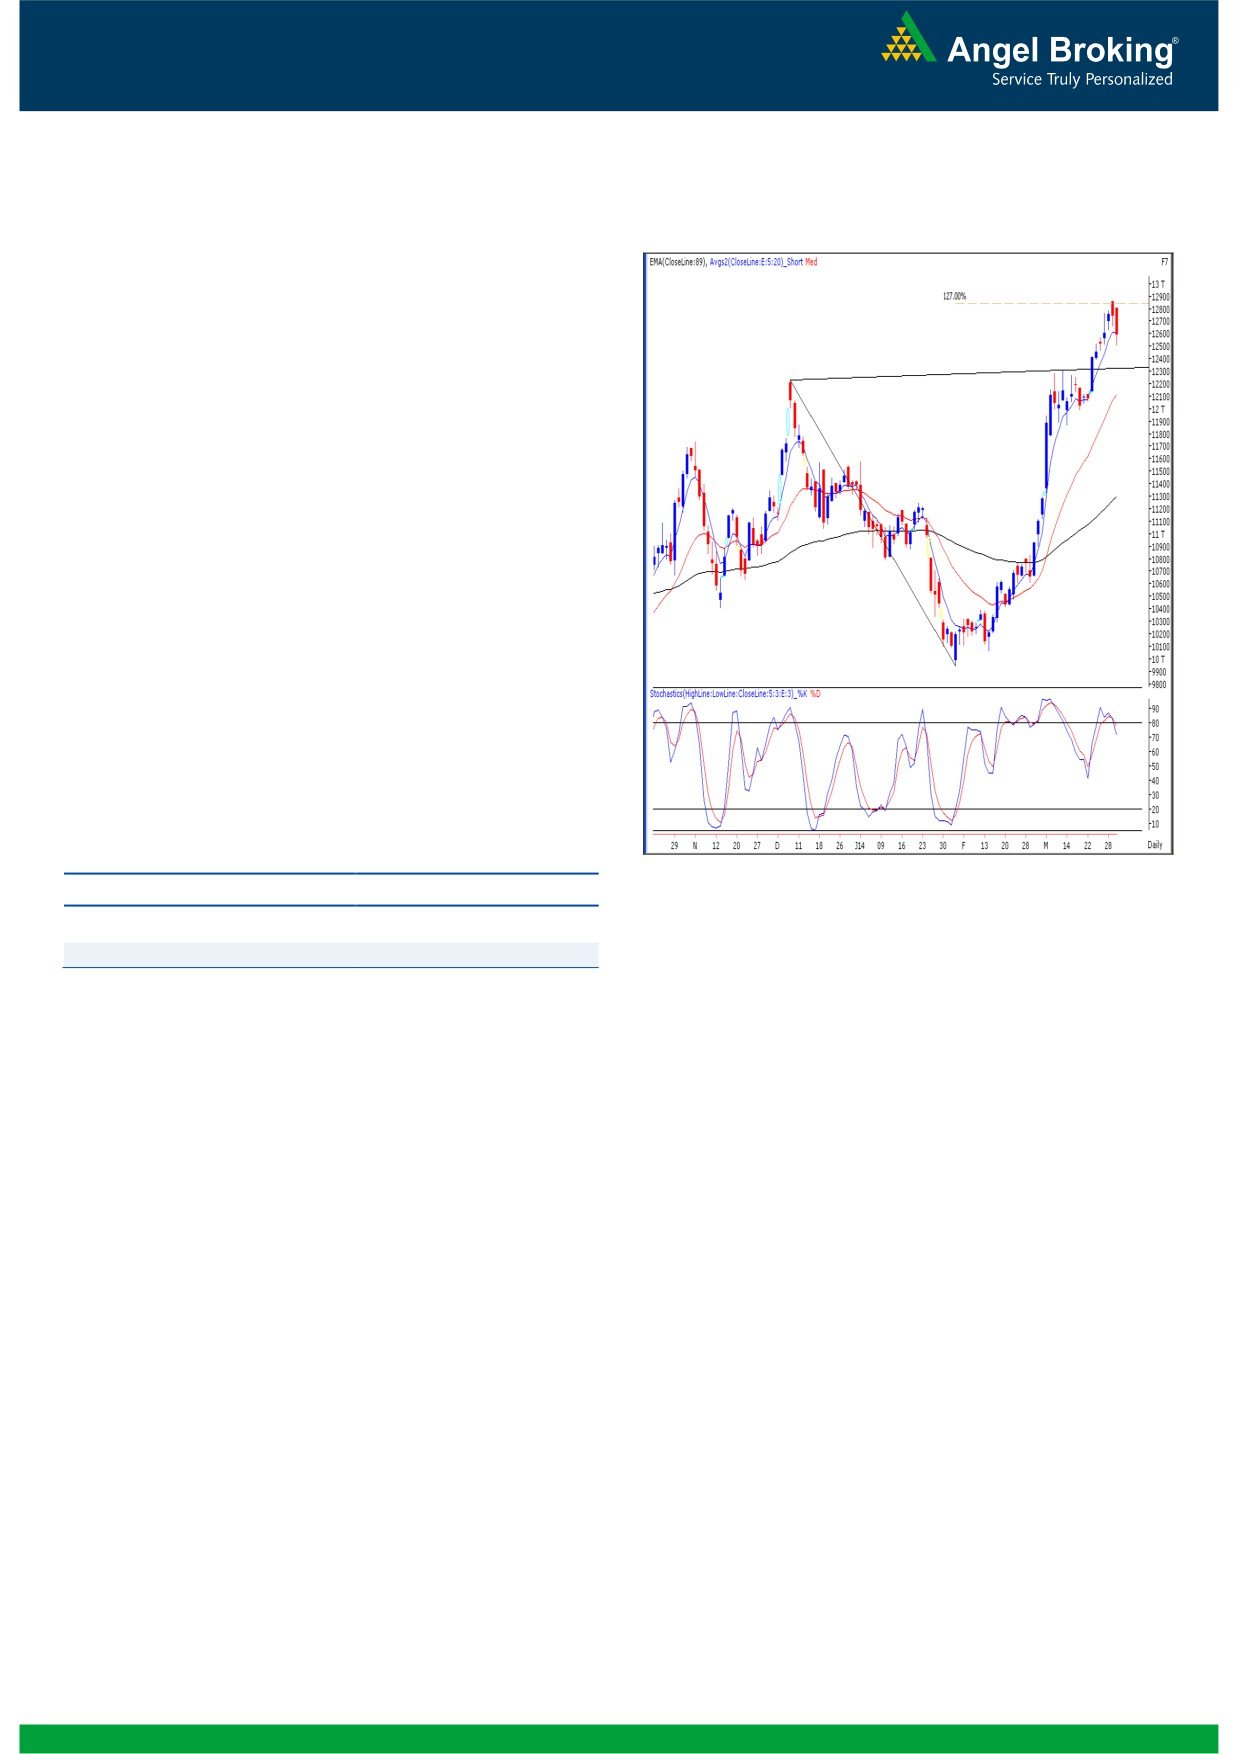
Exhibit 2: Bank Nifty Daily Chart
Unlike our benchmark index, the Bank Nifty opened
slightly lower and remained cautious before the event.
Post the announcement, the banking conglomerates
started facing immense selling pressure, which lasted
almost throughout the session. As a result, the banking
index shed more than a percent as compared to the
previous week. In our previous report, we had clearly
mentioned that Bank Nifty is facing a strong resistance
around the 127% Fibonacci retracement level of the fall
from 12226 (high on December 09, 2013) to 9944 (low
on February 04, 2014). As expected, a sustainable move
below Monday’s low of 12660 led to a correction towards
the immediate support level of 12570. Going forward, if
the selling pressure persists then the Bank Nifty may slide
towards 12470 - 12350 levels. On the flipside, 12700 -
12869 levels would now act as immediate resistance for
the banking index.
Actionable points:
Source: Falcon
View
Neutral
Support Levels
12470 - 12350
Resistance Level
12700 - 12869
2
Daily Technical Report
April 02, 2014
Daily Pivot Levels for Nifty 50 Stocks
SCRIPS
S2
S1
PIVOT
R1
R2
SENSEX
22,219
22,333
22,409
22,523
22,599
NIFTY
6,653
6,687
6,710
6,744
6,766
BANKNIFTY
12,339
12,464
12,635
12,760
12,931
ACC
1,358
1,374
1,387
1,402
1,415
AMBUJACEM
195
199
202
206
209
ASIANPAINT
523
530
539
546
555
1,442
1,455
1,467
1,480
1,492
AXISBANK
BAJAJ-AUTO
2,026
2,046
2,065
2,084
2,104
BANKBARODA
705
721
731
747
757
BHARTIARTL
307
311
316
321
326
BHEL
188
191
195
198
202
BPCL
433
440
452
459
471
CAIRN
323
334
343
353
362
CIPLA
376
379
382
385
389
COALINDIA
278
284
288
294
298
DLF
168
171
175
178
181
DRREDDY
2,554
2,577
2,594
2,617
2,634
GAIL
368
371
374
378
381
GRASIM
2,805
2,827
2,864
2,887
2,924
HCLTECH
1,386
1,402
1,416
1,432
1,445
HDFC
860
875
885
899
909
HDFCBANK
720
729
741
750
762
HEROMOTOCO
2,216
2,233
2,259
2,276
2,302
HINDALCO
133
135
139
142
145
HINDUNILVR
589
595
602
608
614
ICICIBANK
1,194
1,209
1,234
1,249
1,273
IDFC
115
119
122
126
129
INDUSINDBK
486
493
498
505
511
INFY
3,255
3,284
3,305
3,334
3,355
ITC
343
347
350
355
358
JINDALSTEL
287
291
296
300
304
JPASSOCIAT
51
52
53
54
55
736
750
766
780
796
KOTAKBANK
LT
1,238
1,259
1,274
1,295
1,310
LUPIN
927
936
943
952
959
M&M
972
986
995
1,009
1,017
MARUTI
1,886
1,909
1,944
1,967
2,002
NMDC
135
136
138
140
142
NTPC
118
120
121
123
124
ONGC
317
321
324
327
330
PNB
705
720
735
750
765
POWERGRID
103
106
108
110
112
RANBAXY
361
366
370
375
378
RELIANCE
923
933
939
949
955
RELINFRA
422
428
434
440
446
SBIN
1,832
1,863
1,898
1,929
1,964
SESAGOA
183
188
191
196
199
SUNPHARMA
566
569
573
577
581
TATAMOTORS
396
400
403
407
410
TATAPOWER
82
83
84
85
87
TATASTEEL
380
391
397
408
414
TCS
2,129
2,153
2,169
2,193
2,209
ULTRACEMCO
2,105
2,132
2,159
2,185
2,212
3
Daily Technical Report
April 02, 2014
Research Team Tel: 022 - 30940000
DISCLAIMER
This document is solely for the personal information of the recipient, and must not be singularly used as the basis of any investment
decision. Nothing in this document should be construed as investment or financial advice. Each recipient of this document should make
such investigations as they deem necessary to arrive at an independent evaluation of an investment in the securities of the companies
referred to in this document (including the merits and risks involved), and should consult their own advisors to determine the merits and
risks of such an investment.
Angel Broking Pvt. Limited, its affiliates, directors, its proprietary trading and investment businesses may, from time to time, make
investment decisions that are inconsistent with or contradictory to the recommendations expressed herein. The views contained in this
document are those of the analyst, and the company may or may not subscribe to all the views expressed within.
Reports based on technical and derivative analysis center on studying charts of a stock's price movement, outstanding positions and
trading volume, as opposed to focusing on a company's fundamentals and, as such, may not match with a report on a company's
fundamentals.
The information in this document has been printed on the basis of publicly available information, internal data and other reliable
sources believed to be true, but we do not represent that it is accurate or complete and it should not be relied on as such, as this
document is for general guidance only. Angel Broking Pvt. Limited or any of its affiliates/ group companies shall not be in any way
responsible for any loss or damage that may arise to any person from any inadvertent error in the information contained in this report.
Angel Broking Pvt. Limited has not independently verified all the information contained within this document. Accordingly, we cannot
testify, nor make any representation or warranty, express or implied, to the accuracy, contents or data contained within this document.
While Angel Broking Pvt. Limited endeavors to update on a reasonable basis the information discussed in this material, there may be
regulatory, compliance, or other reasons that prevent us from doing so.
This document is being supplied to you solely for your information, and its contents, information or data may not be reproduced,
redistributed or passed on, directly or indirectly.
Angel Broking Pvt. Limited and its affiliates may seek to provide or have engaged in providing corporate finance, investment banking
or other advisory services in a merger or specific transaction to the companies referred to in this report, as on the date of this report or
in the past.
Neither Angel Broking Pvt. Limited, nor its directors, employees or affiliates shall be liable for any loss or damage that may arise from
or in connection with the use of this information.
Note: Please refer to the important `Stock Holding Disclosure' report on the Angel website (Research Section). Also, please refer to the
latest update on respective stocks for the disclosure status in respect of those stocks. Angel Broking Pvt. Limited and its affiliates may
have investment positions in the stocks recommended in this report.
Research Team
Sameet Chavan
-
Technical Analyst
Angel Broking Pvt. Ltd.
Registered Office: G-1, Ackruti Trade Centre, Rd. No. 7, MIDC, Andheri (E), Mumbai - 400 093.
Corporate Office: 6th Floor, Ackruti Star, MIDC, Andheri (E), Mumbai - 400 093. Tel: (022) 30940000
Sebi Registration No: INB 010996539
4