Daily Technical Report
November 01, 2013
Sensex (21165) / Nifty (6299)
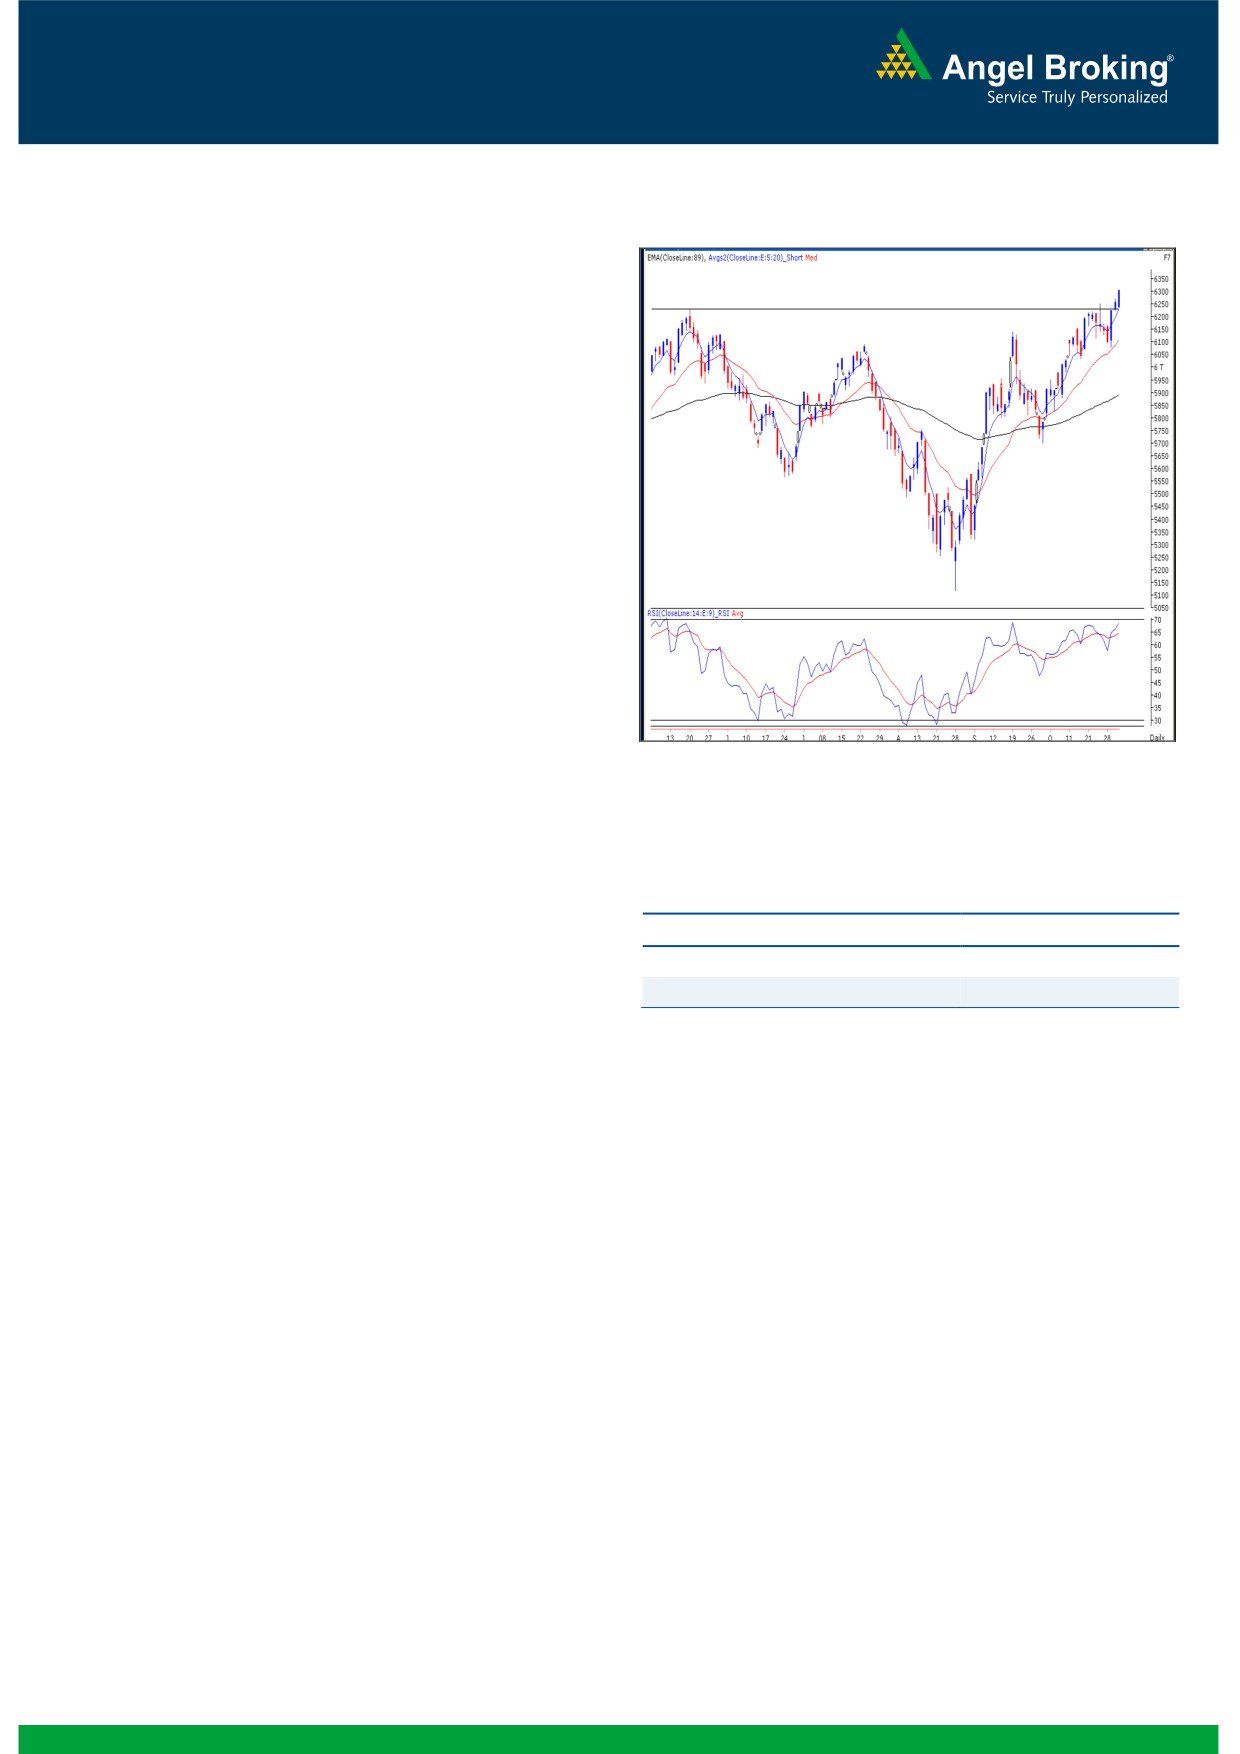
Exhibit 1: Nifty Daily Chart
Yesterday, our market opened on a flat note and traded quietly
throughout the first half. However, post midsession, the index
picked up its upward momentum and closed marginally below
the psychological 6300 mark. Barring Healthcare all other
sectors ended in the positive territory, among which Consumer
Durables, PSU, Banking and Metal counters influenced the
rally. The advance to decline ratio was in favor of the
advancing
counters.
(A=1315
D=1171)(Source-
Formation
The ’89-day EMA’ and the ’89-week EMA’ are placed at
19798 / 5891 and 18914 / 5686 levels, respectively.
The ’20-day EMA’ and the ‘20-week EMA’ are placed at
20568 / 6106 and 19892 / 5922 levels, respectively.
The monthly ‘RSI-Smoothened’ oscillator is still negatively
poised; but ‘RSI’ and ‘Stochastic’ oscillator are
Source: Falcon
contradictory by showing positive developments.
On the Weekly chart, we are observing a ‘Trend Line’
(please refer to exhibit 1) resistance at 6230 level.
Actionable points:
View
Neutral
Trading strategy:
Resistance Level
6338 - 6357
Support Level
6236 - 6169
Yesterday, we witnessed all-time high in the Sensex on a
closing basis. This has resulted in a breakout from the multiple
resistance zones on the line chart. Unlike, any other normal
derivative expiry session, the Nifty continued its upward
momentum after a brief pause in the first half. As expected, the
index traded with strong optimism and closed at the highest
point of the day. We are now on the verge of witnessing a new
all-time high as rising liquidity is likely to propel prices beyond
6357 in coming trading sessions. However, considering
historical evidences, we advise traders to adopt a cautious
approach and maintain a strict stop loss of 6078 for all
positional bets. The intraday resistance levels are seen at 6338
- 6357. On the flipside, 6236 - 6169 levels may provide
decent support for the index.
1
Daily Technical Report
November 01, 2013
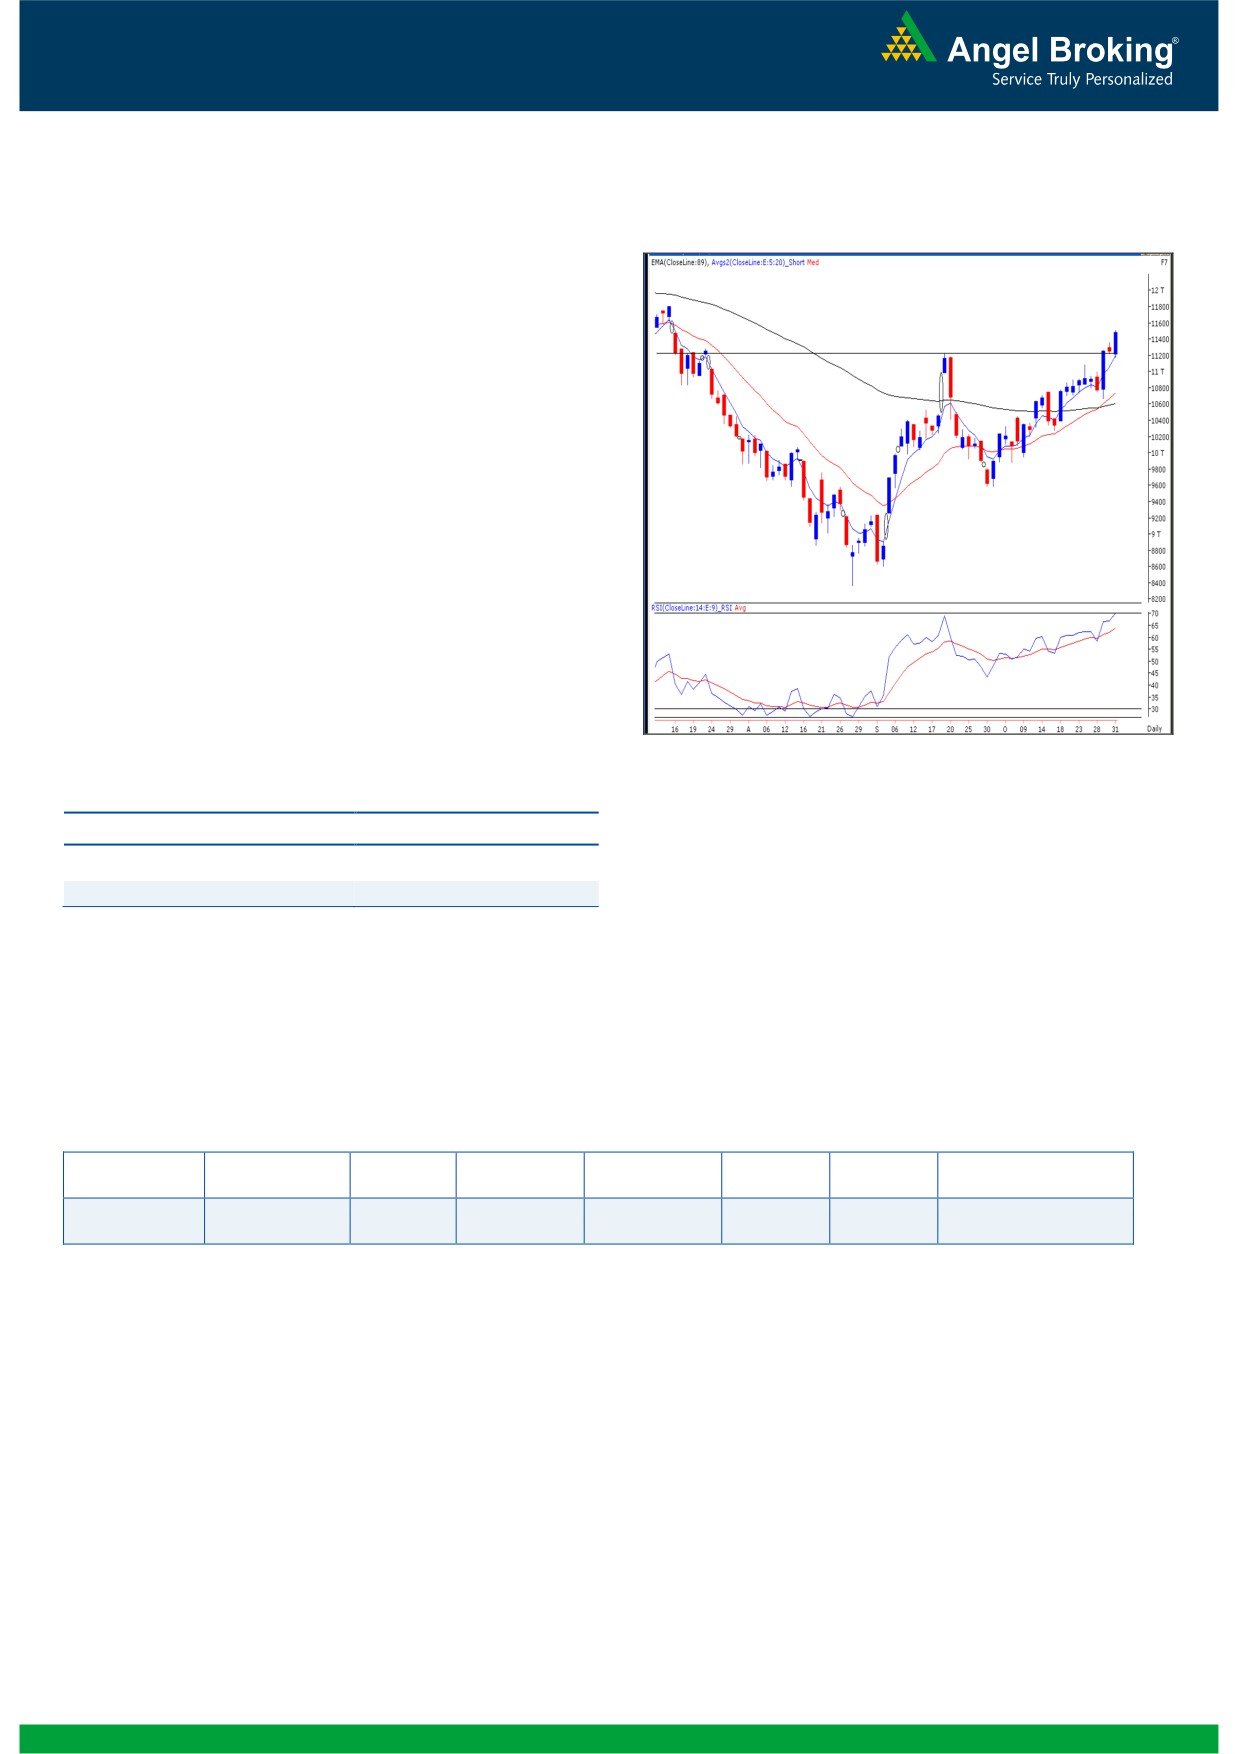
Bank Nifty Outlook - (11473)
Exhibit 2: Bank Nifty Daily Chart
The Banking index too opened quietly and traded with
lackluster movement during the first half. However,
similar to previous trading sessions, the PSU Banking
conglomerates surged on the back of immense buying
interest and once again posted considerable gains. We
are now clearly seeing a complete shift in the sentiments
and as a result, the Bank Nifty has closed convincingly
above the stiff resistance of 11300. Considering ongoing
optimism and chart structure, we expect the index to
continue its upward movement in the coming trading
sessions as well. The immediate upside level is seen at
11622. However, accelerated momentum and follow up
buying may even push the index beyond this level. On the
flipside, the 11219 mark would be a decent intra-day
support.
Actionable points:
Source: Falcon
View
Neutral
Support Level
11219 - 11170
Resistance Level
11622 - 11812
Technical Calls
Date
Stocks
Segment
Action
Price Range
CMP
SL
Target
01/11/2013
Allahabad Bank
Cash
Buy
88 - 84
91.75
77.80
100
2
Daily Technical Report
November 01, 2013
Research Team Tel: 022 - 30940000
DISCLAIMER
This document is solely for the personal information of the recipient, and must not be singularly used as the basis of any investment
decision. Nothing in this document should be construed as investment or financial advice. Each recipient of this document should make
such investigations as they deem necessary to arrive at an independent evaluation of an investment in the securities of the companies
referred to in this document (including the merits and risks involved), and should consult their own advisors to determine the merits and
risks of such an investment.
Angel Broking Pvt. Limited, its affiliates, directors, its proprietary trading and investment businesses may, from time to time, make
investment decisions that are inconsistent with or contradictory to the recommendations expressed herein. The views contained in this
document are those of the analyst, and the company may or may not subscribe to all the views expressed within.
Reports based on technical and derivative analysis center on studying charts of a stock's price movement, outstanding positions and
trading volume, as opposed to focusing on a company's fundamentals and, as such, may not match with a report on a company's
fundamentals.
The information in this document has been printed on the basis of publicly available information, internal data and other reliable
sources believed to be true, but we do not represent that it is accurate or complete and it should not be relied on as such, as this
document is for general guidance only. Angel Broking Pvt. Limited or any of its affiliates/ group companies shall not be in any way
responsible for any loss or damage that may arise to any person from any inadvertent error in the information contained in this report.
Angel Broking Pvt. Limited has not independently verified all the information contained within this document. Accordingly, we cannot
testify, nor make any representation or warranty, express or implied, to the accuracy, contents or data contained within this document.
While Angel Broking Pvt. Limited endeavors to update on a reasonable basis the information discussed in this material, there may be
regulatory, compliance, or other reasons that prevent us from doing so.
This document is being supplied to you solely for your information, and its contents, information or data may not be reproduced,
redistributed or passed on, directly or indirectly.
Angel Broking Pvt. Limited and its affiliates may seek to provide or have engaged in providing corporate finance, investment banking
or other advisory services in a merger or specific transaction to the companies referred to in this report, as on the date of this report or
in the past.
Neither Angel Broking Pvt. Limited, nor its directors, employees or affiliates shall be liable for any loss or damage that may arise from
or in connection with the use of this information.
Note: Please refer to the important `Stock Holding Disclosure' report on the Angel website (Research Section). Also, please refer to the
latest update on respective stocks for the disclosure status in respect of those stocks. Angel Broking Pvt. Limited and its affiliates may
have investment positions in the stocks recommended in this report.
Research Team
Shardul Kulkarni
-
Head - Technicals
Sameet Chavan
-
Technical Analyst
Sacchitanand Uttekar
-
Technical Analyst
Angel Broking Pvt. Ltd.
Registered Office: G-1, Ackruti Trade Centre, Rd. No. 7, MIDC, Andheri (E), Mumbai - 400 093.
Corporate Office: 6th Floor, Ackruti Star, MIDC, Andheri (E), Mumbai - 400 093. Tel: (022) 30940000
Sebi Registration No: INB 010996539
4