Daily Technical Report
October 01, 2013
Sensex (19380) / NIFTY (5735)
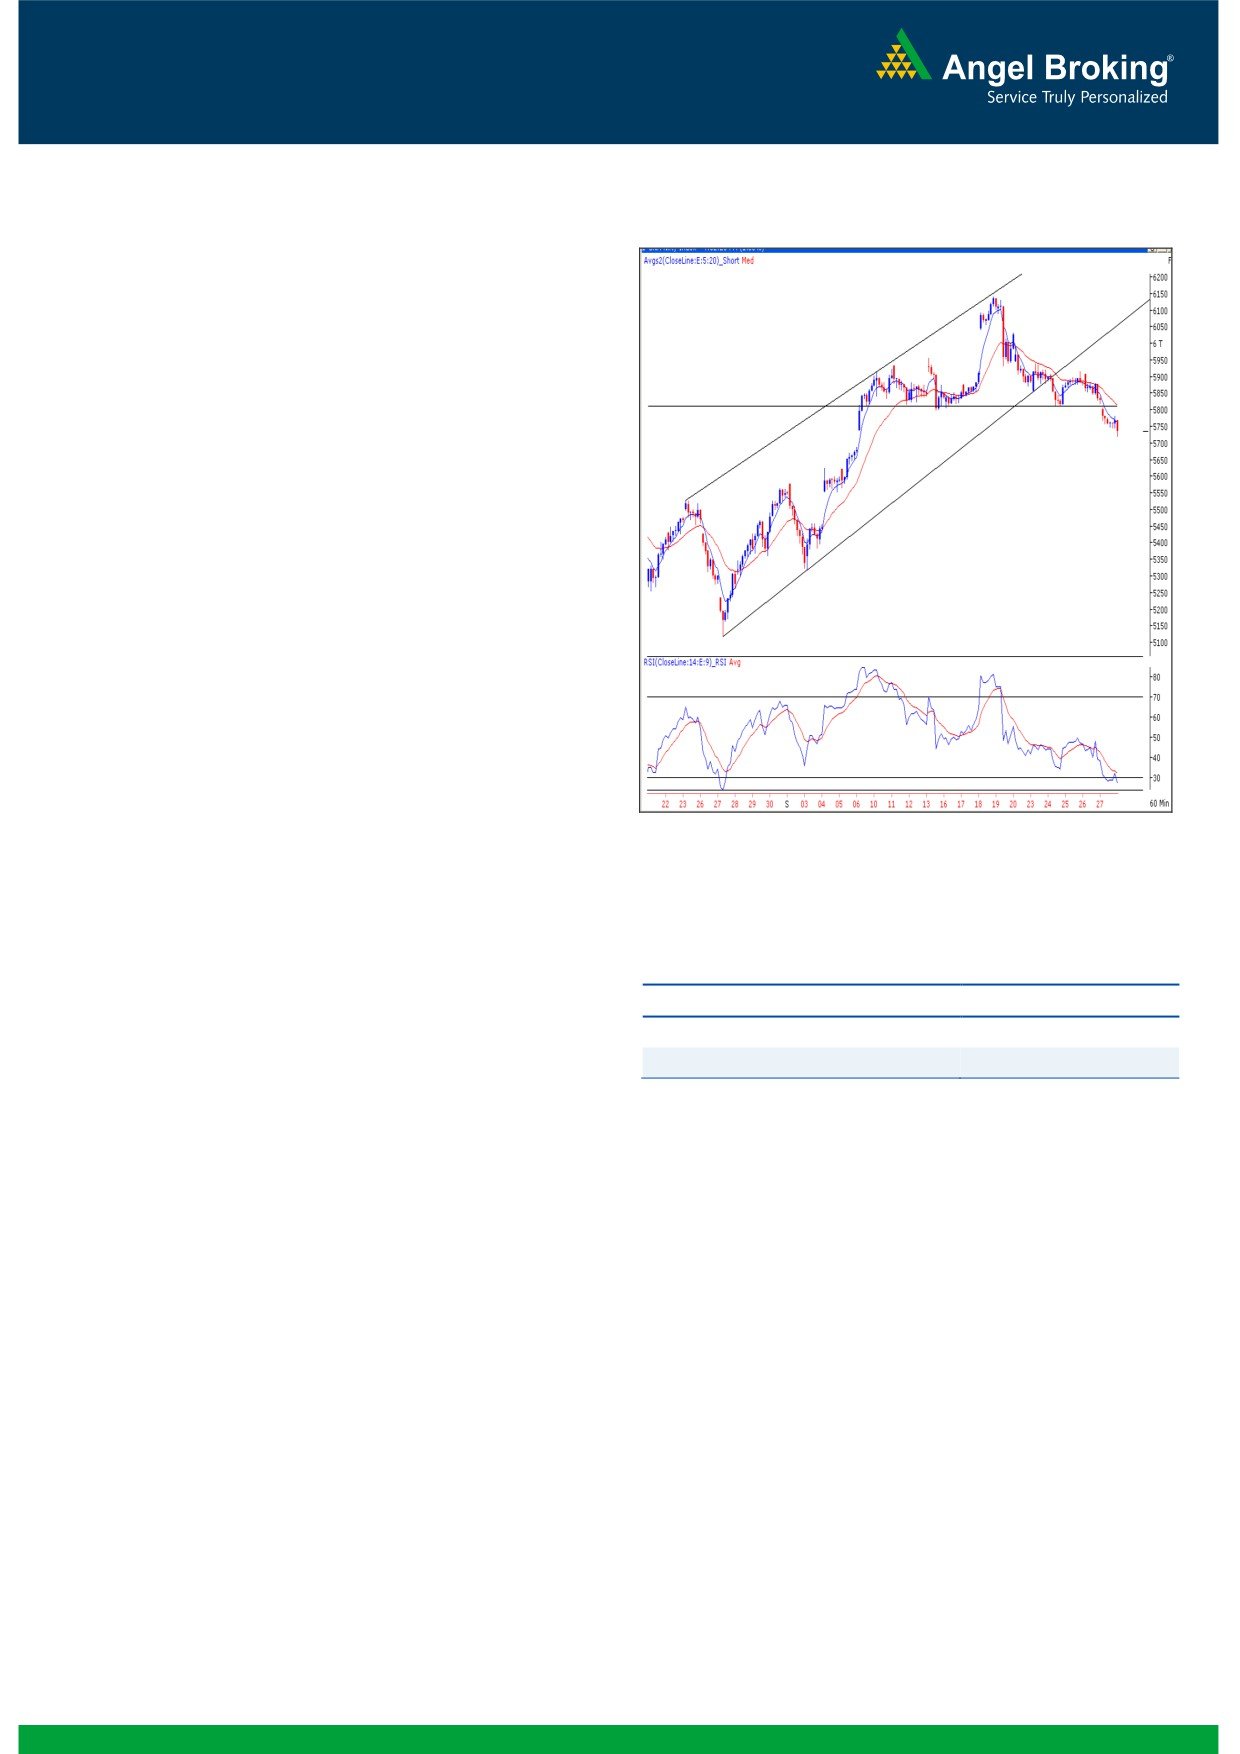
Exhibit 1: Nifty Hourly Chart
The opening session of the week began with half a percent
downside gap as indicated by the SGX Nifty. Selling pressure
intensified as the day progresses and as a result, the index
shed more than one and half a percent during the session.
Except IT sector, all other sectors closed in the negative
territory. The decline was mainly led by the rate sensitive
counters like, Capital goods, Banking, Metal and Realty. The
advance to decline ratio was strongly in the favor of declining
Formation
The ’89-day EMA’ and the ’89-week EMA’ are placed at
19347 / 5764 and 18722 / 5635 levels, respectively.
The ’20-day EMA’ and the ‘20-week EMA’ are placed at
19613 / 5799 and 19377 / 5775 levels, respectively.
The daily and monthly ‘RSI-Smoothened’ oscillator is
negatively poised.
The previous week’s candle resembles a ‘Spinning Top’
Japanese candlestick pattern.
Source: Falcon
On a closing basis, the ‘Lower Top - Lower Bottom’
formation on the weekly chart is still intact (Nifty).
Actionable points:
The 38.2% and 50% Fibonacci retracement levels of the
rise from 5118 (weekly low of August 30, 2013) to 6143
View
Bearish below 5718
(weekly high of September 20, 2013) are placed at 5750
and 5630, respectively.
Resistance Level
5810
Expected Targets
5630 - 5550
Trading strategy:
Friday’s weak closing was followed by a gap down opening
considering weak global cues. The index then immediately
slipped below the important weekly low of 5798. This price
action triggered immense pessimism among market
participants. As expected, the Nifty then headed towards the
initial target of 5750 and eventually, closed lower than this
level. Considering the negative placement of daily momentum
oscillators and the ADX (9) indicator, we expect the negative
momentum to continue in coming trading session as well. In
this scenario, the index may test 50% Fibonacci retracement
level of the rise from 5118 (weekly low of August 30, 2013) to
6143 (weekly high of September 20, 2013, which is placed at
5630. However, in case of extreme pessimism, the index may
even test 5550 level. On the flipside, yesterday’s high of 5810
would act as immediate resistance for the index. Any news with
regards to the US debt ceiling may have a significant impact
on the markets and traders are advised to stay light on
positions before clarity emerges on that front.
1
Daily Technical Report
October 01, 2013
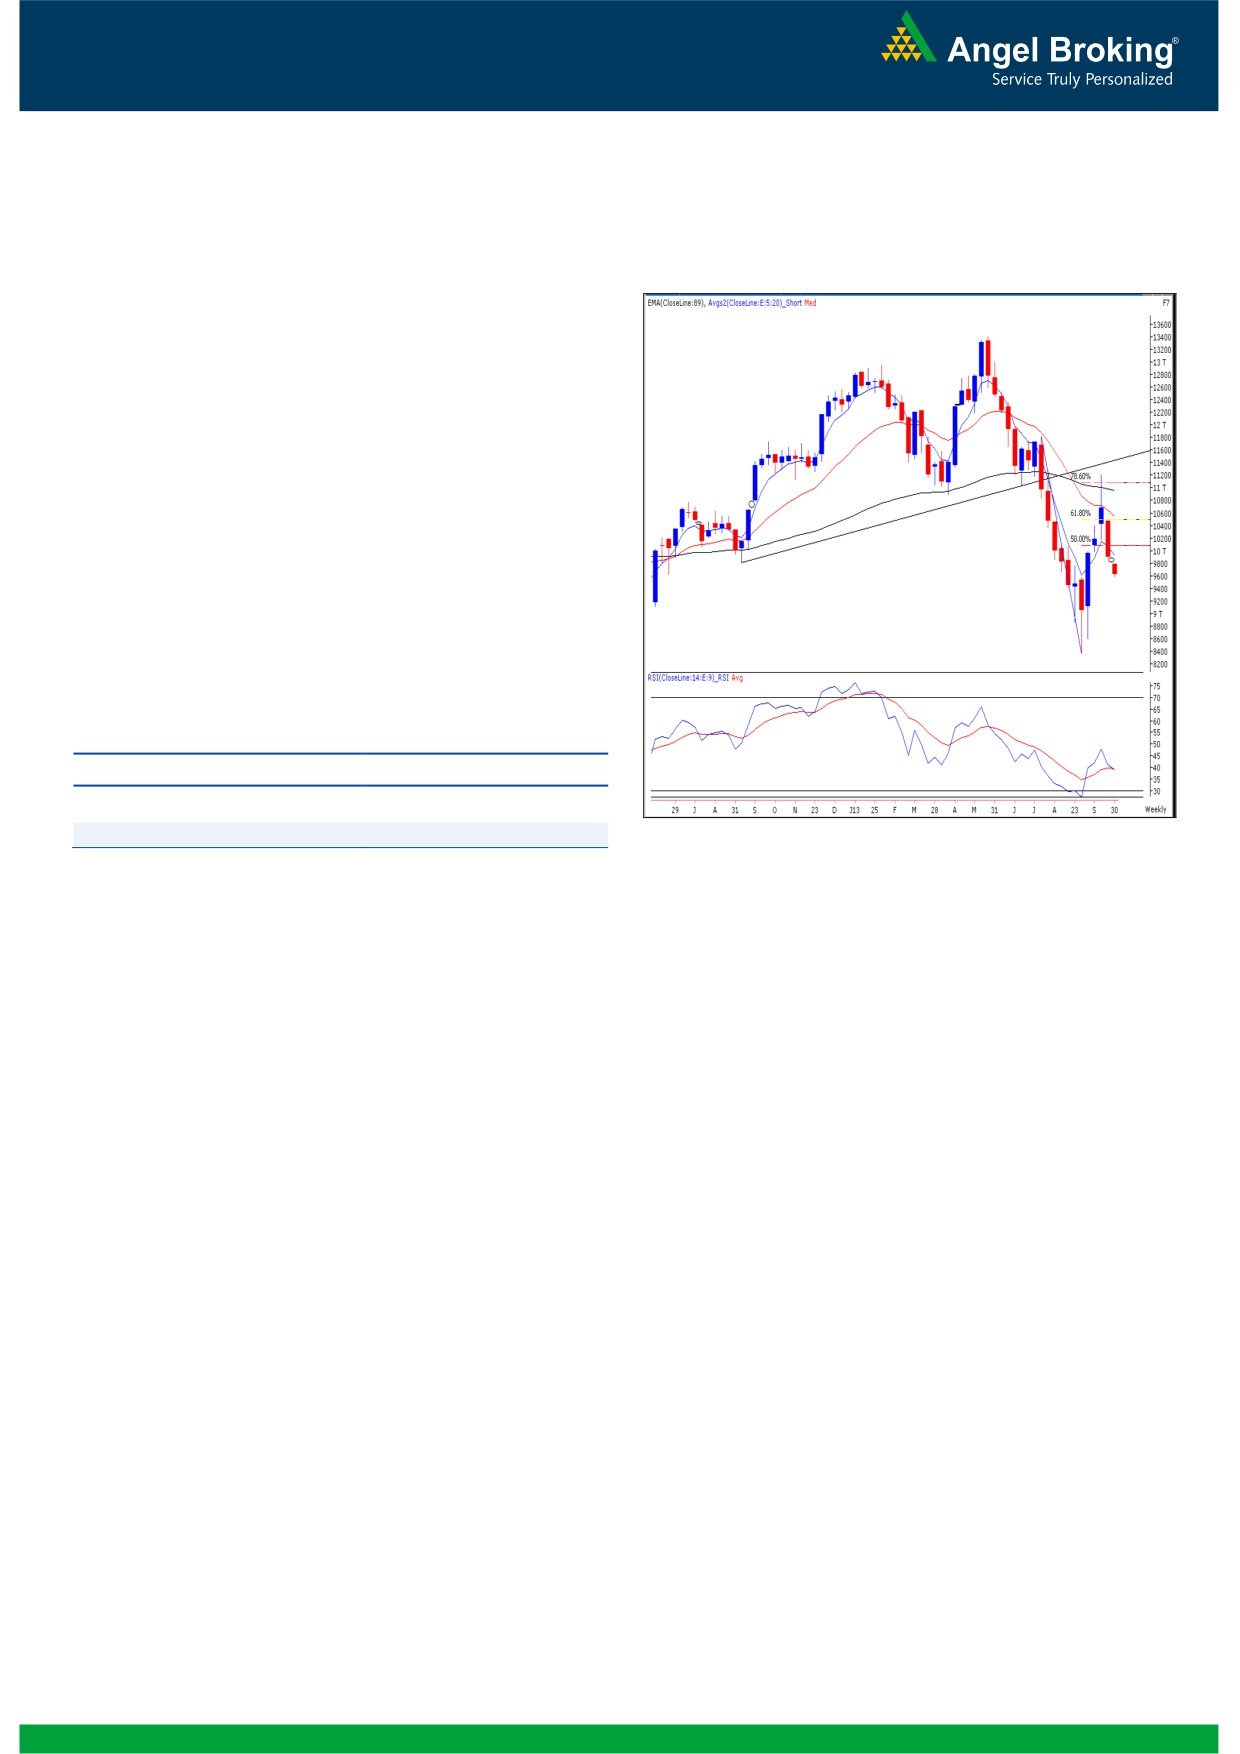
Bank Nifty Outlook - (9618)
Exhibit 2: Bank Nifty Weekly Chart
Yesterday, in-line with our benchmark index, the Bank
Nifty too opened lower with a percent gap. Subsequently,
the index traded within a narrow range for major part of
the session. However, volatility increased during the
concluding hour and in the process, the Bank Nifty
plummeted significantly to close at the lows of the session.
The index precisely met with our initial target of 9700.
Going forward, considering the negative chart structure,
and weak placement of the weekly momentum oscillators,
we expect the Bank Nifty to test 9405 - 9280 levels. On
the flipside, 9730 - 9815 levels would now act as a strong
resistance zone.
Actionable points:
View
Bearish Below 9580
Expected Targets
9405 - 9280
Resistance Levels
9730 - 9815
Source: Falcon
2
Daily Technical Report
October 01, 2013
Daily Pivot Levels for Nifty 50 Stocks
SCRIPS
S2
S1
PIVOT
R1
R2
SENSEX z
19,102
19,215
19,433
19,545
19,764
NIFTY
5,663
5,699
5,755
5,791
5,846
BANKNIFTY
9,446
9,532
9,674
9,759
9,901
ACC
1,073
1,093
1,105
1,125
1,137
AMBUJACEM
179
181
183
185
188
ASIANPAINT
448
454
462
468
476
AXISBANK
983
995
1,008
1,020
1,032
BAJAJ-AUTO
1,957
1,972
1,993
2,008
2,029
BANKBARODA
477
485
491
500
506
BHARTIARTL
307
313
318
323
328
BHEL
132
135
138
140
143
BPCL
322
327
332
336
342
CAIRN
313
316
318
321
324
CIPLA
426
429
434
437
442
COALINDIA
284
289
298
304
313
DLF
124
126
129
131
134
DRREDDY
2,336
2,359
2,390
2,412
2,443
GAIL
315
321
326
333
337
GRASIM
2,596
2,621
2,652
2,678
2,709
HCLTECH
1,056
1,071
1,088
1,103
1,120
HDFC
742
753
767
778
791
HDFCBANK
573
583
598
608
623
HEROMOTOCO
1,929
1,969
2,008
2,049
2,088
HINDALCO
109
110
112
114
115
HINDUNILVR
613
620
626
633
639
ICICIBANK
856
870
893
907
930
IDFC
85
87
88
89
90
INDUSINDBK
355
362
368
375
382
INFY
2,964
2,989
3,022
3,046
3,079
ITC
334
337
342
345
350
JINDALSTEL
229
232
235
238
241
JPASSOCIAT
34
34
35
36
37
KOTAKBANK
658
668
679
689
699
LT
766
777
795
807
824
LUPIN
839
847
859
867
878
M&M
799
813
829
843
859
MARUTI
1,324
1,341
1,357
1,375
1,391
NMDC
116
118
121
124
127
NTPC
141
144
147
150
153
ONGC
256
262
268
274
280
PNB
451
456
464
469
477
POWERGRID
96
97
98
99
100
RANBAXY
323
327
332
336
342
RELIANCE
803
813
829
838
854
RELINFRA
356
363
376
383
396
SBIN
1,582
1,598
1,613
1,630
1,645
SESAGOA
176
178
182
184
188
SUNPHARMA
575
584
593
602
611
TATAMOTORS
325
329
334
338
344
TATAPOWER
79
80
81
82
83
TATASTEEL
256
264
274
282
292
TCS
1,895
1,911
1,937
1,953
1,978
ULTRACEMCO
1,764
1,787
1,813
1,836
1,862
3
Daily Technical Report
October 01, 2013
Research Team Tel: 022 - 30940000
DISCLAIMER
This document is solely for the personal information of the recipient, and must not be singularly used as the basis of any investment
decision. Nothing in this document should be construed as investment or financial advice. Each recipient of this document should make
such investigations as they deem necessary to arrive at an independent evaluation of an investment in the securities of the companies
referred to in this document (including the merits and risks involved), and should consult their own advisors to determine the merits and
risks of such an investment.
Angel Broking Pvt. Limited, its affiliates, directors, its proprietary trading and investment businesses may, from time to time, make
investment decisions that are inconsistent with or contradictory to the recommendations expressed herein. The views contained in this
document are those of the analyst, and the company may or may not subscribe to all the views expressed within.
Reports based on technical and derivative analysis center on studying charts of a stock's price movement, outstanding positions and
trading volume, as opposed to focusing on a company's fundamentals and, as such, may not match with a report on a company's
fundamentals.
The information in this document has been printed on the basis of publicly available information, internal data and other reliable
sources believed to be true, but we do not represent that it is accurate or complete and it should not be relied on as such, as this
document is for general guidance only. Angel Broking Pvt. Limited or any of its affiliates/ group companies shall not be in any way
responsible for any loss or damage that may arise to any person from any inadvertent error in the information contained in this report.
Angel Broking Pvt. Limited has not independently verified all the information contained within this document. Accordingly, we cannot
testify, nor make any representation or warranty, express or implied, to the accuracy, contents or data contained within this document.
While Angel Broking Pvt. Limited endeavors to update on a reasonable basis the information discussed in this material, there may be
regulatory, compliance, or other reasons that prevent us from doing so.
This document is being supplied to you solely for your information, and its contents, information or data may not be reproduced,
redistributed or passed on, directly or indirectly.
Angel Broking Pvt. Limited and its affiliates may seek to provide or have engaged in providing corporate finance, investment banking
or other advisory services in a merger or specific transaction to the companies referred to in this report, as on the date of this report or
in the past.
Neither Angel Broking Pvt. Limited, nor its directors, employees or affiliates shall be liable for any loss or damage that may arise from
or in connection with the use of this information.
Note: Please refer to the important `Stock Holding Disclosure' report on the Angel website (Research Section). Also, please refer to the
latest update on respective stocks for the disclosure status in respect of those stocks. Angel Broking Pvt. Limited and its affiliates may
have investment positions in the stocks recommended in this report.
Research Team
Shardul Kulkarni
-
Head - Technicals
Sameet Chavan
-
Technical Analyst
Sacchitanand Uttekar
-
Technical Analyst
Angel Broking Pvt. Ltd.
Registered Office: G-1, Ackruti Trade Centre, Rd. No. 7, MIDC, Andheri (E), Mumbai - 400 093.
Corporate Office: 6th Floor, Ackruti Star, MIDC, Andheri (E), Mumbai - 400 093. Tel: (022) 30940000
Sebi Registration No: INB 010996539
4