Daily Technical Report
October 01, 2015
Sensex (26155) / Nifty (7949)
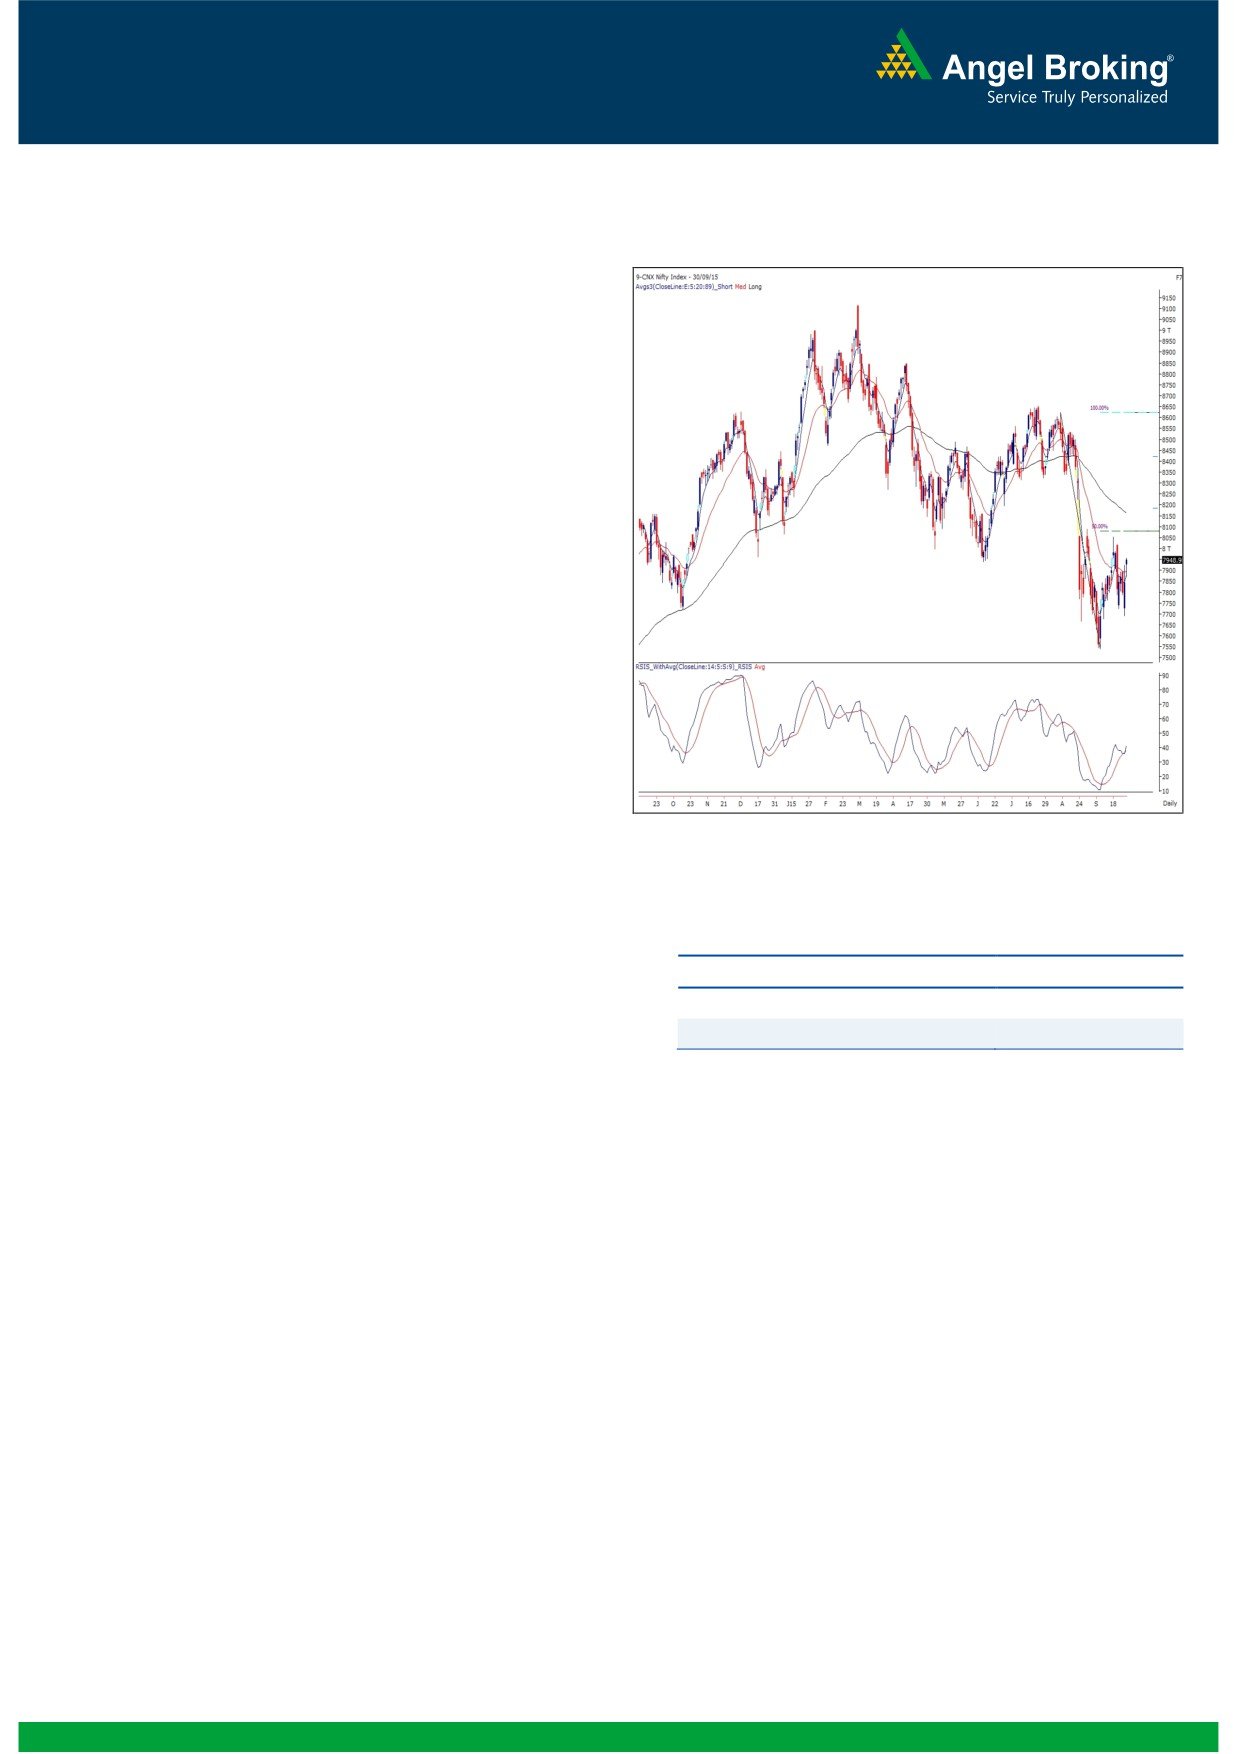
Exhibit 1: Nifty Daily Chart
Yesterday, the Nifty opened with the upside gap of a percent
on back of positive cue from Asian bourses. After the minor
correction in the opening hour, the Nifty continued to make
higher highs in the remaining part of the sessions. The positive
opening of European markets then boosted the sentiments
and as a result the Nifty ended the session around its intraday
high with the gains of 1.35 percent. Amongst the sectoral
indices, the Metals, FMCG IT and Realty were the major
gainers; whereas, the Banking Index was the only loser with
marginal losses. The advance to decline ratio was favor of the
advancing
counters.
(A=1683
D=979)
(Source:
Formations
The ’89-day EMA’ and the ’89-week EMA’ are placed
at 26992 / 8163 and 25909 / 7815 levels, respectively.
The ’20-day EMA’ and the ‘20-week EMA’ are placed
at 26003 / 7895 and 27060 / 8180 levels, respectively.
Source: Falcon
Trading strategy:
Actionable points:
Yesterday the index opened on a positive note and rallied
higher throughout the session to end the day with gains of
View
Neutral
1.35%. Although the positive momentum in the index picked
Resistance Levels
8055
up post the RBI policy action on Tuesday, yesterday’s trading
Support Level
7875 - 7820
gains were led by the beaten down sectors other than the
banking index. Post this upmove, Nifty is now trading in the
vicinity of major resistance zone and thus traders should use
this move as opportunity to create short positions. On higher
side, the recent high of 8055 is a crucial resistance which the
bears will look to defend vehemently. Thus, traders can keep
stoploss above the mentioned resistance level for short
positions. The immediate support for the index is placed
around 7875 and 7820.
1
Daily Technical Report
October 01, 2015
Bank Nifty Outlook - (17216)
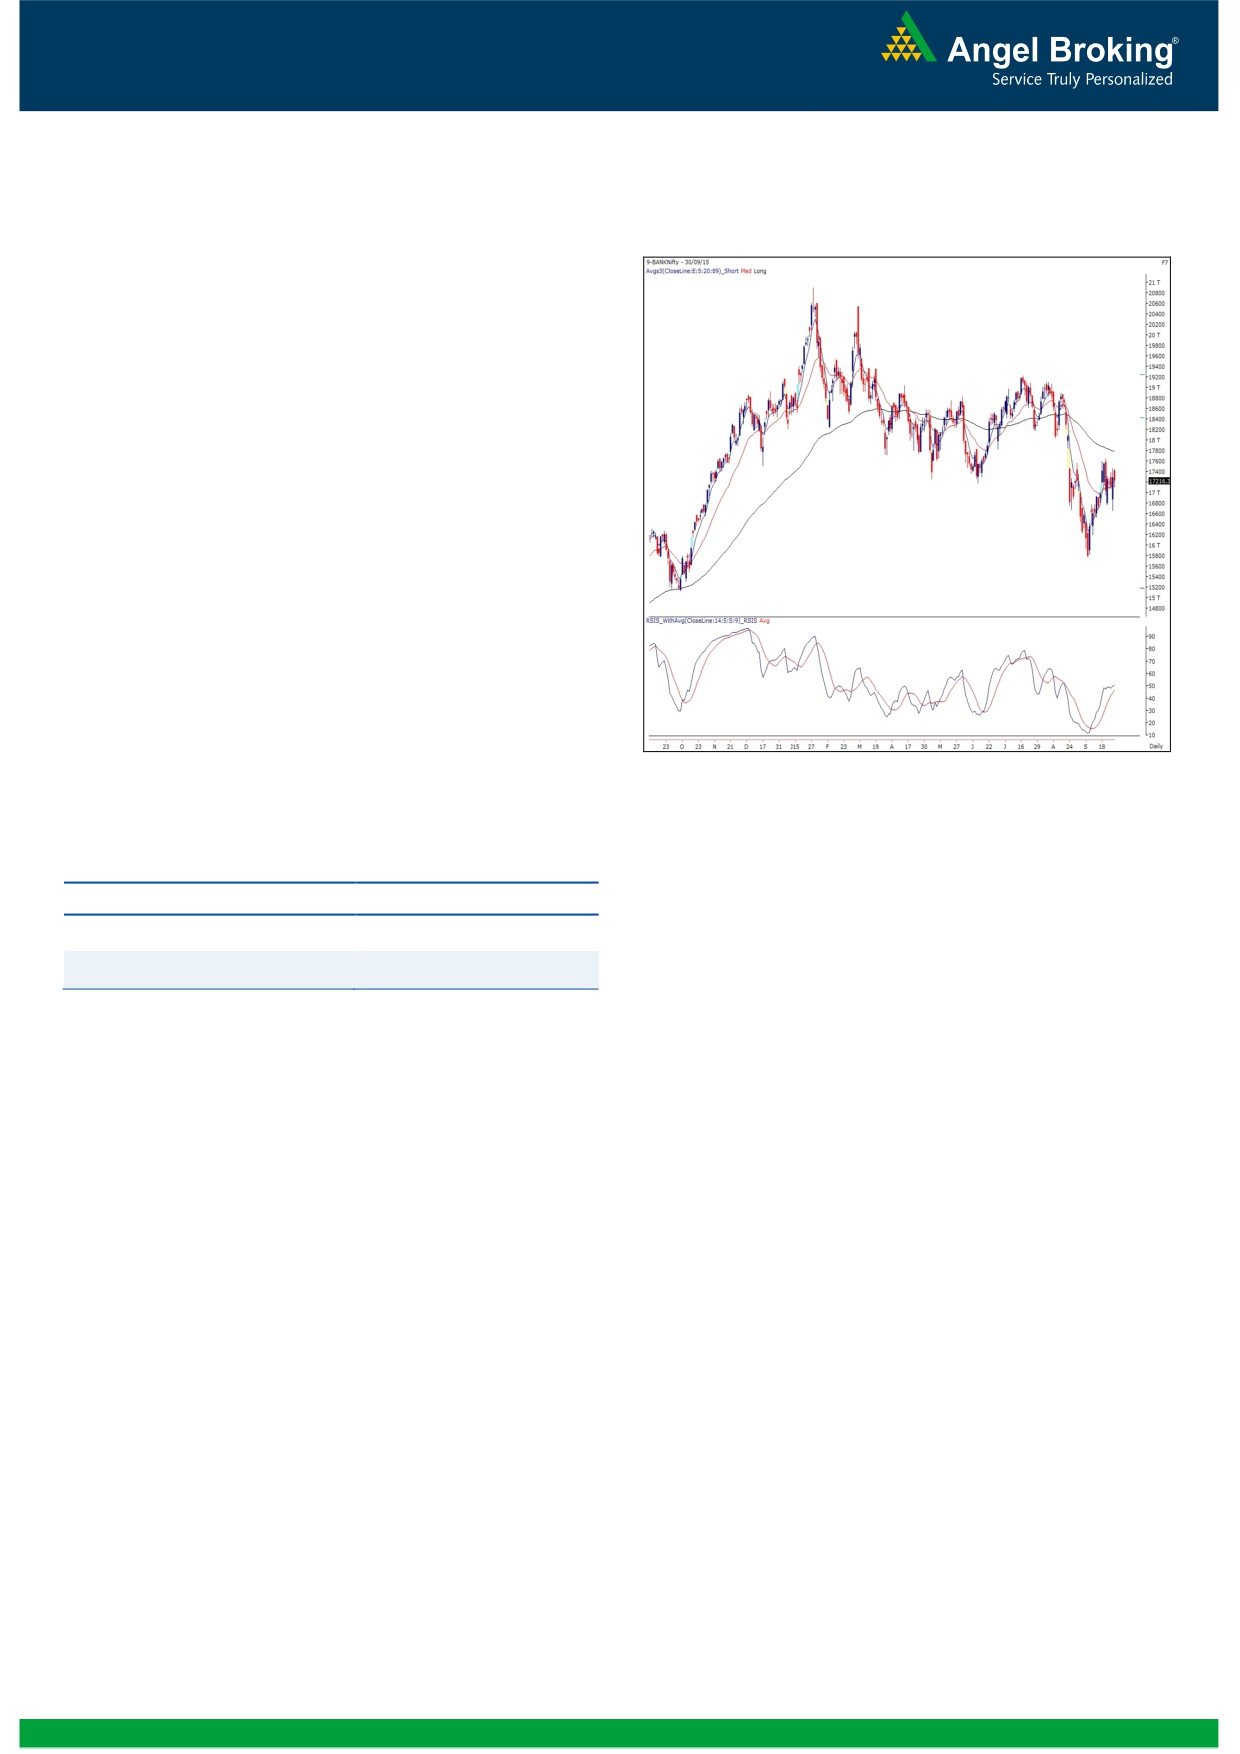
Exhibit 2: Bank Nifty Daily Chart
Yesterday, the Bank Nifty started the session with the gains
of more than 100 points in-line with the benchmark indices.
But, despite the gap up opening, the banking index failed to
cross Tuesday’s high of 17461.35 and started falling from
the initial trades. The positive momentum which was
witnessed on Tuesday, post the 50 bps repo rate cut, was
completely mislaid in yesterday’s session. The Bank Nifty
underperformed the broader market by ending the session
with the loss of 0.38 percent over its previous close. The
corrective action in banking counter despite the positive
outcome of monitory policy is a negative sign for the index.
At current juncture, we reiterate our view that this is ‘Sell on
Rise’ market and use intraday bounces to create short
positions. Going forward, the Bank Nifty has support at
17000 and 16750 levels; whereas, the immediate resistance
is placed at 17465 and 17700 levels.
Source: Falcon
Actionable points:
View
Neutral
Resistance Levels
17465 - 17700
Support Levels
17000 - 16750
2
Daily Technical Report
October 01, 2015
Research Team Tel: 022 - 30940000
DISCLAIMER
Angel Broking Private Limited (hereinafter referred to as “Angel”) is a registered Member of National Stock Exchange of India Limited,
Bombay Stock Exchange Limited and MCX Stock Exchange Limited. It is also registered as a Depository Participant with CDSL and
Portfolio Manager with SEBI. It also has registration with AMFI as a Mutual Fund Distributor. Angel Broking Private Limited is a
registered entity with SEBI for Research Analyst in terms of SEBI (Research Analyst) Regulations, 2014 vide registration number
INH000000164. Angel or its associates has not been debarred/ suspended by SEBI or any other regulatory authority for accessing
/dealing in securities Market. Angel or its associates including its relatives/analyst do not hold any financial interest/beneficial
ownership of more than 1% in the company covered by Analyst. Angel or its associates/analyst has not received any compensation /
managed or co-managed public offering of securities of the company covered by Analyst during the past twelve months.
Angel/analyst has not served as an officer, director or employee of company covered by Analyst and has not been engaged in market
making activity of the company covered by Analyst.
This document is solely for the personal information of the recipient, and must not be singularly used as the basis of any investment
decision. Nothing in this document should be construed as investment or financial advice. Each recipient of this document should
make such investigations as they deem necessary to arrive at an independent evaluation of an investment in the securities of the
companies referred to in this document (including the merits and risks involved), and should consult their own advisors to determine
the merits and risks of such an investment.
Reports based on technical and derivative analysis center on studying charts of a stock's price movement, outstanding positions and
trading volume, as opposed to focusing on a company's fundamentals and, as such, may not match with a report on a company's
fundamentals.
The information in this document has been printed on the basis of publicly available information, internal data and other reliable
sources believed to be true, but we do not represent that it is accurate or complete and it should not be relied on as such, as this
document is for general guidance only. Angel Broking Pvt. Limited or any of its affiliates/ group companies shall not be in any way
responsible for any loss or damage that may arise to any person from any inadvertent error in the information contained in this
report. Angel Broking Pvt. Limited has not independently verified all the information contained within this document. Accordingly, we
cannot testify, nor make any representation or warranty, express or implied, to the accuracy, contents or data contained within this
document. While Angel Broking Pvt. Limited endeavors to update on a reasonable basis the information discussed in this material,
there may be regulatory, compliance, or other reasons that prevent us from doing so.
This document is being supplied to you solely for your information, and its contents, information or data may not be reproduced,
redistributed or passed on, directly or indirectly.
Neither Angel Broking Pvt. Limited, nor its directors, employees or affiliates shall be liable for any loss or damage that may arise from
or in connection with the use of this information.
Note: Please refer to the important ‘Stock Holding Disclosure' report on the Angel website (Research Section). Also, please
refer to the latest update on respective stocks for the disclosure status in respect of those stocks. Angel Broking Pvt. Limited
and its affiliates may have investment positions in the stocks recommended in this report.
Research Team
Sameet Chavan
-
Technical Analyst
Angel Broking Pvt. Ltd.
Registered Office: G-1, Ackruti Trade Centre, Rd. No. 7, MIDC, Andheri (E), Mumbai - 400 093.
Corporate Office: 6th Floor, Ackruti Star, MIDC, Andheri (E), Mumbai - 400 093. Tel: (022) 30940000
Sebi Registration No: INB 010996539
4