Daily Technical Report
June 25, 2013
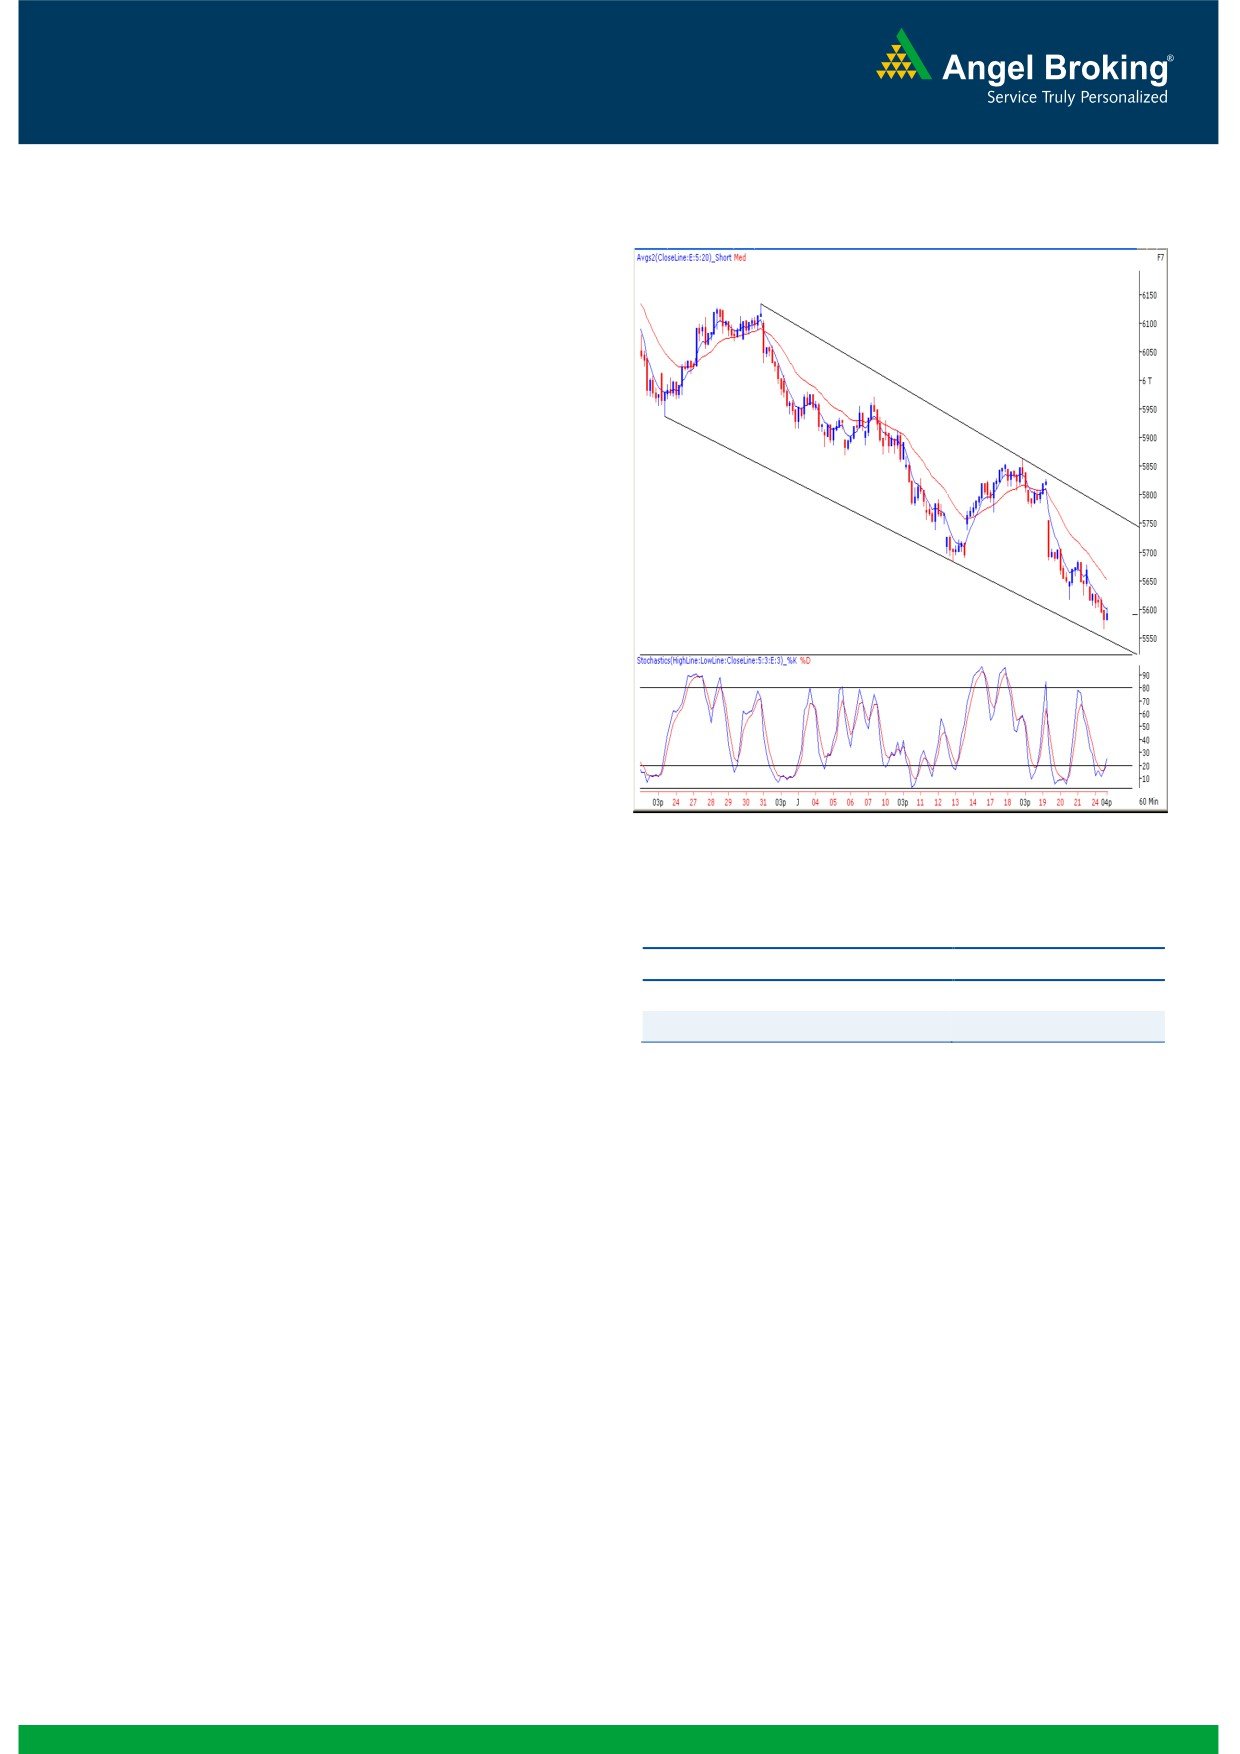
Exhibit 1: Nifty Hourly Chart
Sensex (18541) / NIFTY (5590)
Yesterday, markets opened nearly half a percent lower on
the back of weak global cues and subsequently continued
the negative trend as the day progressed. In the process, the
Nifty corrected nearly one and half percent to close below
the psychological level of 5600 mark. All sectors ended in
the negative territory with the Realty, Consumer Durables
and Capital Goods counters leading the decline. The
advance to decline ratio was strongly in favor of declining
counters.
(A=650 D=1636)
(Source-
Formation
The ’20-week EMA’ and the ’89-Week EMA’ are placed
at 19230/ 5825 and 18456/ 5585 levels, respectively.
The ’89-day EMA’ and the ‘200-day SMA’ are placed at
19359/ 5866 and 19172 / 5814, respectively.
Source: Falcon:
The weekly ‘RSI-Smoothened’ oscillators, the ‘ADX (9)
indicator and ‘5 & 20 EMA’ are now signaling a
negative crossover.
Actionable points:
View
Neutral
Trading strategy:
Support Levels
5566 - 5540
The week started off on a pessimistic note considering
Resistance Levels
5650 - 5686
negativity across the globe. As a result, indices plunged and
closed below the important 78.6% Fibonacci retracement
level of
18636
/
5638. At this juncture, Indices are
marginally above the weekly ’89 EMA’ level of 18456 /
5585. Looking at the hourly chart, it is clearly seen that
indices are oscillating within the ‘Downward Sloping
Channel’ (please refer exhibit 1) and have now approached
the lower end of the channel. Further, the hourly ‘Stochastic’
oscillator is now signaling a positive crossover. Hence, the
possibility of a bounce back from current level cannot be
ruled out. However, this bullish case probability would be
applicable only if indices move beyond the previous hourly
swing high of 18670 / 5625. In this scenario, indices may
bounce towards 18700 - 18860 / 5650 - 5686 levels. On
the flipside, 18467 - 18380 / 5566 - 5540 may provide
decent support for our market.
1
Daily Technical Report
June 25, 2013
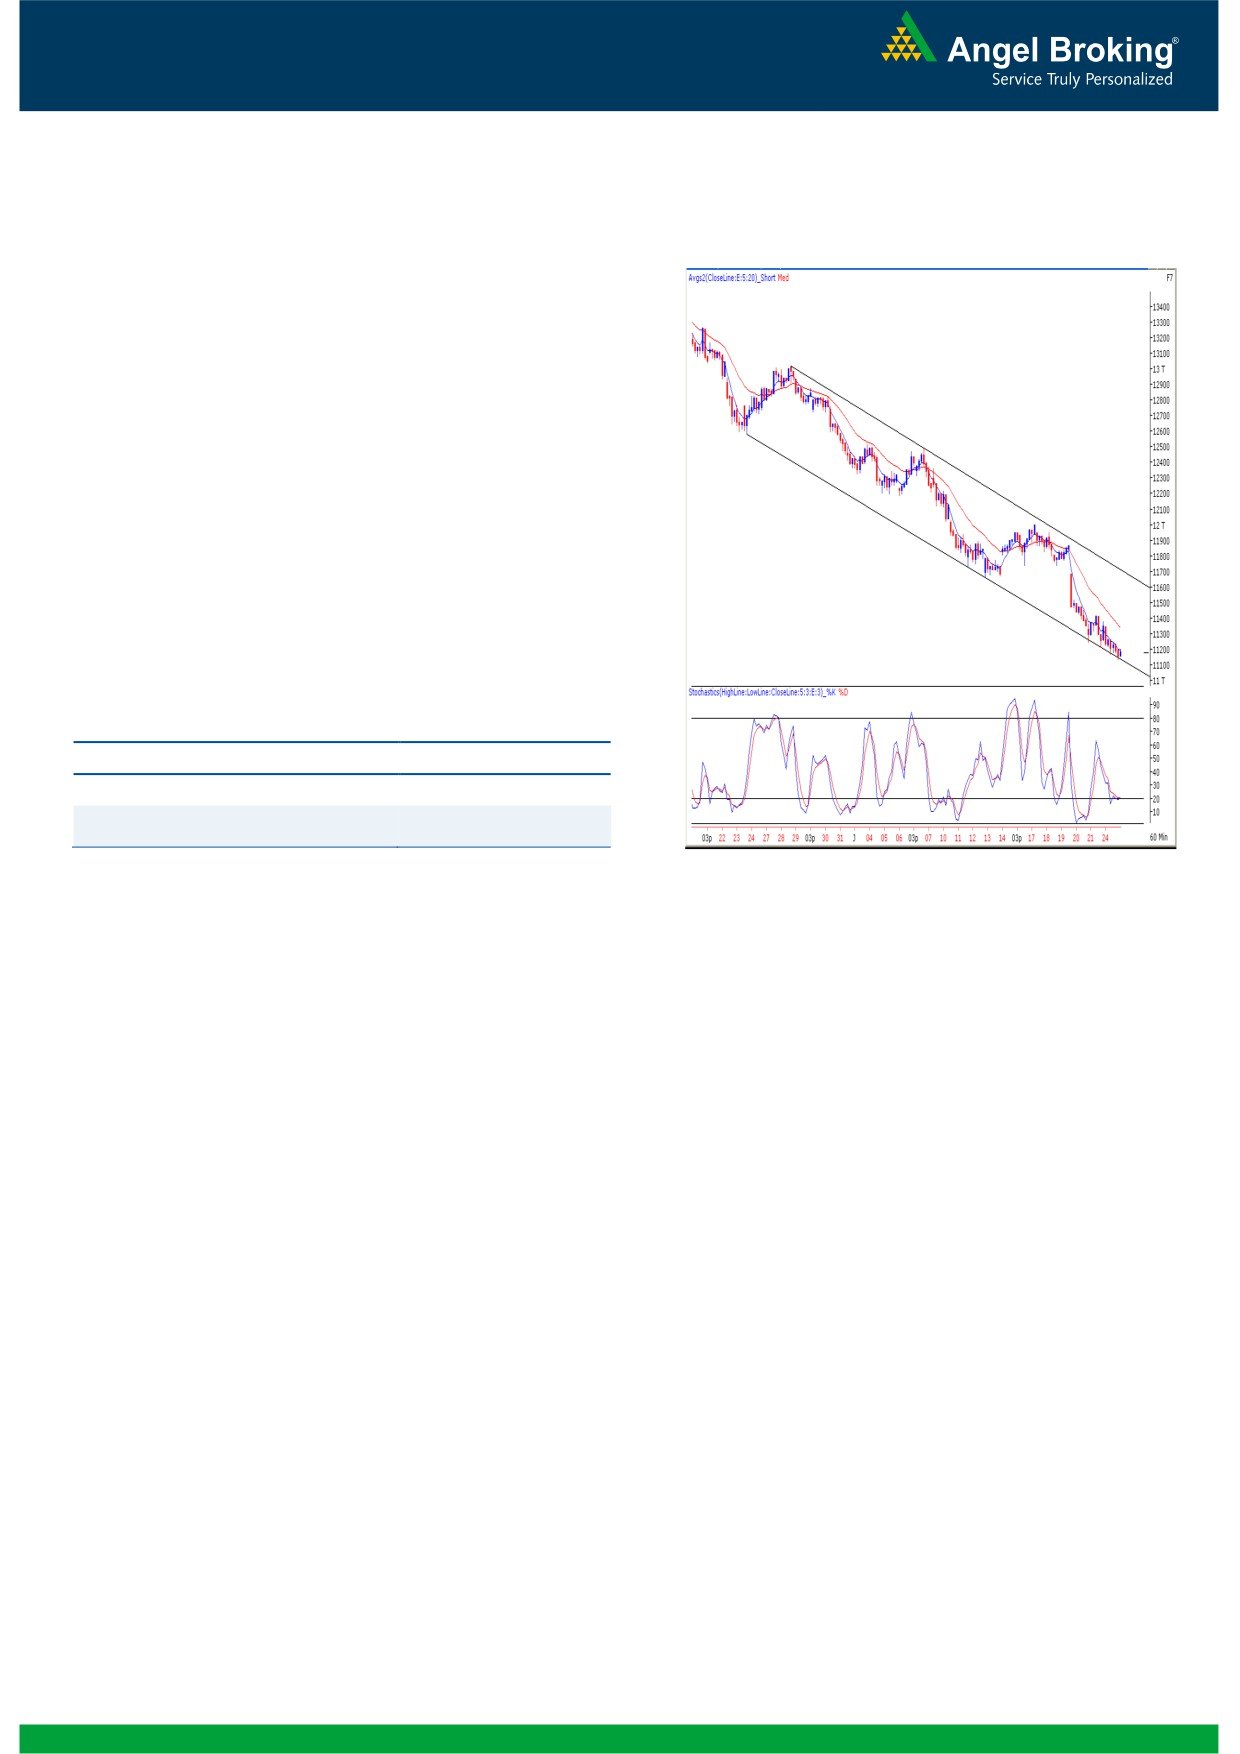
Exhibit 2: Bank Nifty Hourly Chart
Bank Nifty Outlook - (11178)
The week opened on a bearish note and the Bank Nifty
continued to remain under pressure throughout the session.
Quite similar to benchmark indices, the Bank Nifty too has
been trading within the ‘Downward Sloping Trend Line’
(please refer exhibit 2). It has now precisely tested the lower
end of the channel. Considering the oversold condition of
hourly momentum oscillators, and the positive divergence in
the RSI, the possibility of a bounce back cannot be ruled out if
index sustains above 11247. In this scenario, the Bank Nifty
may test 11383 - 11420 levels. Conversely, 11134 - 11048
would act as a key support level in the coming trading
session.
Actionable points:
View
Neutral
Support Levels
11134 - 11048
Resistance Levels
11247 - 11383
Source: Falcon:
2
Daily Technical Report
June 25, 2013
Research Team Tel: 022 - 30940000
DISCLAIMER
This document is solely for the personal information of the recipient, and must not be singularly used as the basis of any investment
decision. Nothing in this document should be construed as investment or financial advice. Each recipient of this document should make
such investigations as they deem necessary to arrive at an independent evaluation of an investment in the securities of the companies
referred to in this document (including the merits and risks involved), and should consult their own advisors to determine the merits and
risks of such an investment.
Angel Broking Limited, its affiliates, directors, its proprietary trading and investment businesses may, from time to time, make
investment decisions that are inconsistent with or contradictory to the recommendations expressed herein. The views contained in this
document are those of the analyst, and the company may or may not subscribe to all the views expressed within.
Reports based on technical and derivative analysis center on studying charts of a stock's price movement, outstanding positions and
trading volume, as opposed to focusing on a company's fundamentals and, as such, may not match with a report on a company's
fundamentals.
The information in this document has been printed on the basis of publicly available information, internal data and other reliable
sources believed to be true, but we do not represent that it is accurate or complete and it should not be relied on as such, as this
document is for general guidance only. Angel Broking Limited or any of its affiliates/ group companies shall not be in any way
responsible for any loss or damage that may arise to any person from any inadvertent error in the information contained in this report.
Angel Broking Limited has not independently verified all the information contained within this document. Accordingly, we cannot testify,
nor make any representation or warranty, express or implied, to the accuracy, contents or data contained within this document. While
Angel Broking Limited endeavors to update on a reasonable basis the information discussed in this material, there may be regulatory,
compliance, or other reasons that prevent us from doing so.
This document is being supplied to you solely for your information, and its contents, information or data may not be reproduced,
redistributed or passed on, directly or indirectly.
Angel Broking Limited and its affiliates may seek to provide or have engaged in providing corporate finance, investment banking or
other advisory services in a merger or specific transaction to the companies referred to in this report, as on the date of this report or in
the past.
Neither Angel Broking Limited, nor its directors, employees or affiliates shall be liable for any loss or damage that may arise from or in
connection with the use of this information.
Note: Please refer to the important `Stock Holding Disclosure' report on the Angel website (Research Section). Also, please refer to the
latest update on respective stocks for the disclosure status in respect of those stocks. Angel Broking Limited and its affiliates may have
investment positions in the stocks recommended in this report.
Research Team
Shardul Kulkarni
-
Head - Technicals
Sameet Chavan
-
Technical Analyst
Sacchitanand Uttekar
-
Technical Analyst
Angel Broking Pvt. Ltd.
Registered Office: G-1, Ackruti Trade Centre, Rd. No. 7, MIDC, Andheri (E), Mumbai - 400 093.
Corporate Office: 6th Floor, Ackruti Star, MIDC, Andheri (E), Mumbai - 400 093. Tel: (022) 30940000
Sebi Registration No: INB 010996539
4