Daily Technical Report
July 05 , 2013
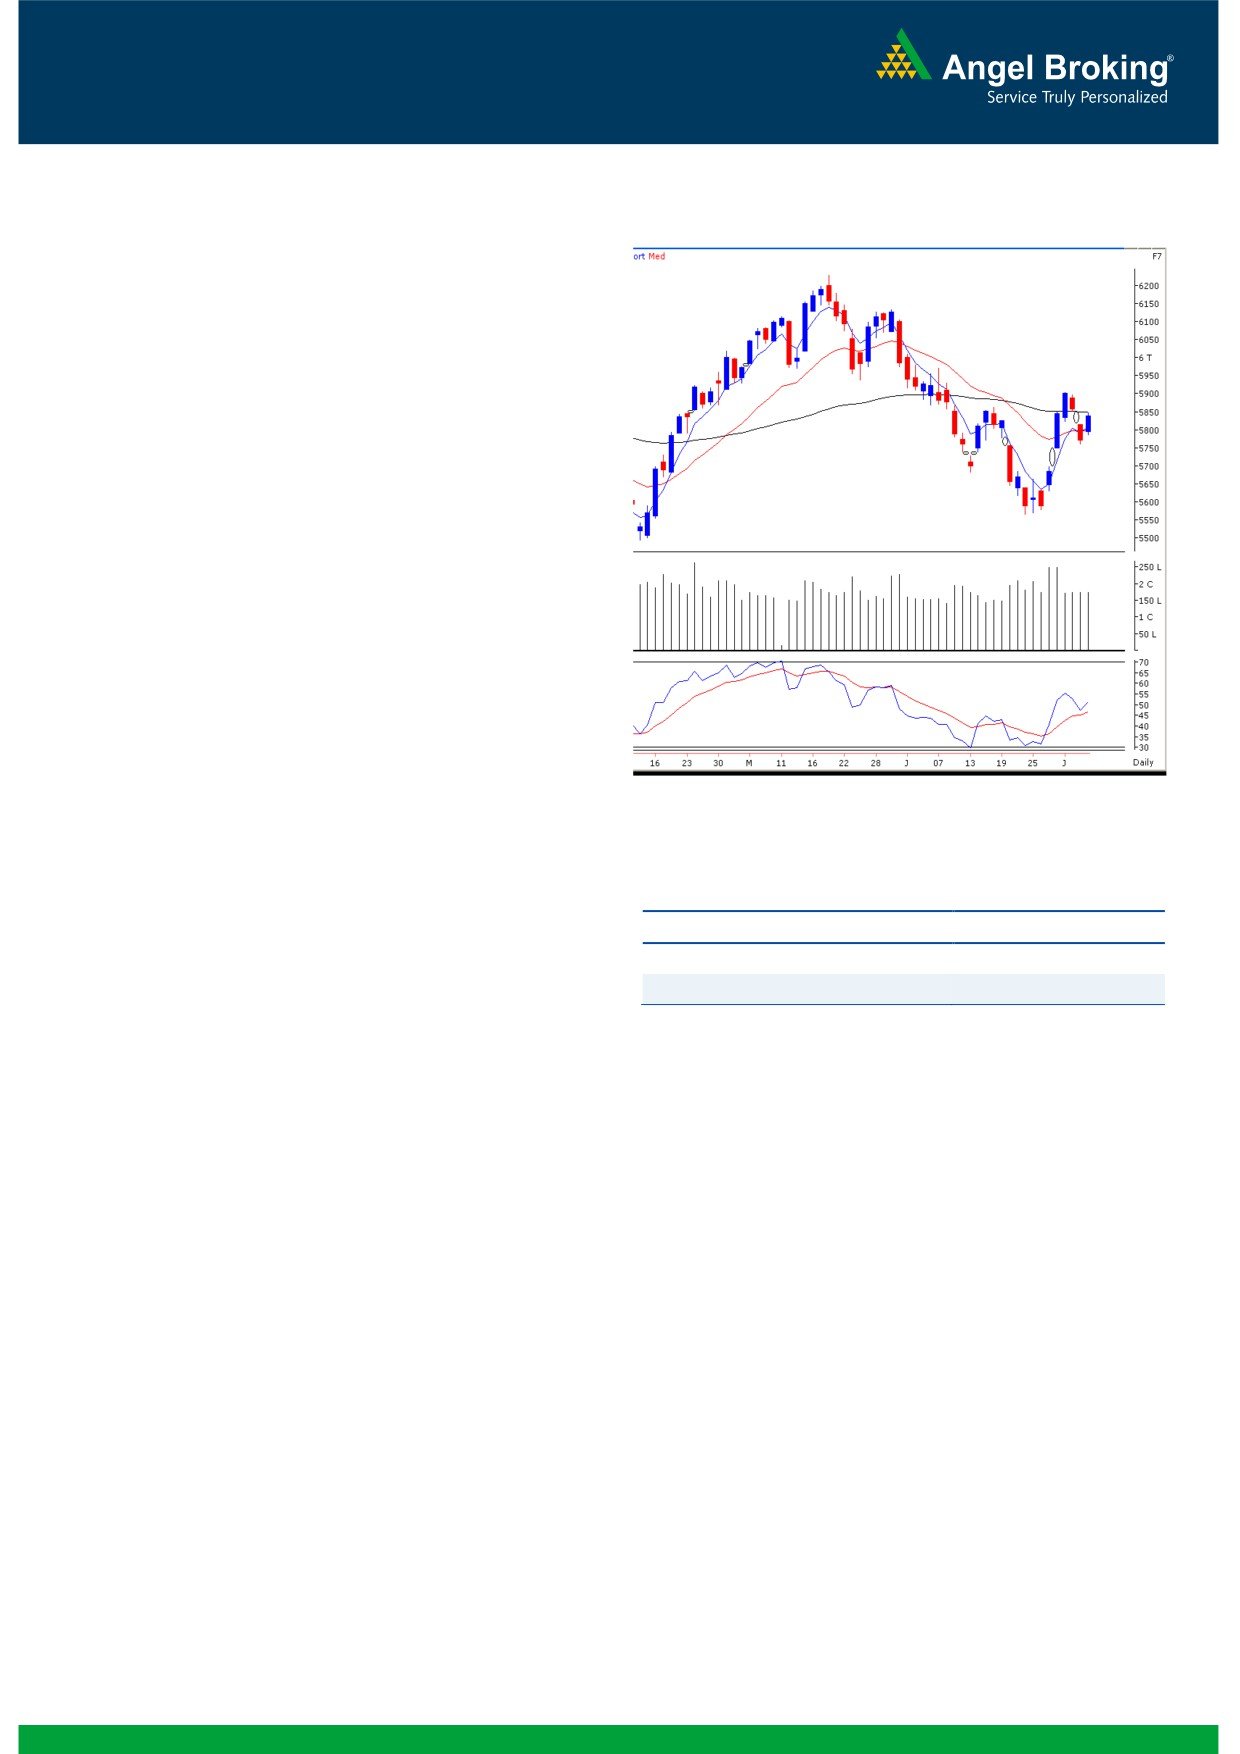
Exhibit 1: Nifty Daily Chart
Sensex (19411) / NIFTY (5837)
Yesterday our benchmark indices opened marginally higher
in line with global markets. We witnessed significant volatility
throughout the second half of the trading session as the
markets hit day’s low and then the day’s high within just over
an hour. FMCG, IT and Pharmaceutical counters rallied in
yesterday’s session while the metal counters remained under
pressure. The advance to decline ratio was marginally in the
favor of advancing counters. (A=1194 D=1088) (Source-
Formation
The ’89-day EMA’ and the ’89-Week EMA’ are placed at
19325 / 5849 and 18498/ 5597 levels, respectively.
The ’20-Day EMA’ and the ‘20-Week EMA’ are placed
at 19216/ 5798 and 19322 / 5848, respectively.
Source: Falcon:
The 50% and 61.8% Fibonacci retracement levels of the
fall from 20444 / 6229 to 18467/ 5566 are placed at
19455/ 5898 and 19689 / 5976, respectively.
Actionable points:
The weekly chart now depicts a ‘Bullish Engulfing’ but
View
Neutral
the monthly chart shows a 'Bearish Engulfing" Japanese
candlestick pattern.
Resistance Level
5850 - 5898
Support Levels
5786 - 5760
Trading strategy:
Yesterday markets opened higher and significant volatility
was seen during the session. The indices have now tested the
89 day EMA and the Nifty has closed just below that moving
average. The gap area formed on 3rd July in the range of
18926 to 19093 / 5699 to 5749 has now nearly been filled.
Going forward, we are of the opinion that if indices sustain
above yesterday’s high of 19445 / 5749, then they are likely
to move towards the next resistance level of 19598 / 5898.
On the flip side, both the hourly chart and the daily chart
indicate an overbought level on the stochastic oscillator. As a
result any gap up opening in today’s session may lead to
profit booking at higher levels. Traders are advised adopt a
stock specific approach and stay light on positions in the
Index futures, considering the significant volatility in
yesterday’s session. A fall below yesterday’s low of 19245 /
5786 will confirm the beginning of a lower top lower bottom
trend on the hourly chart and may lead to strong selling
pressure.
1
Daily Technical Report
July 05, 2013
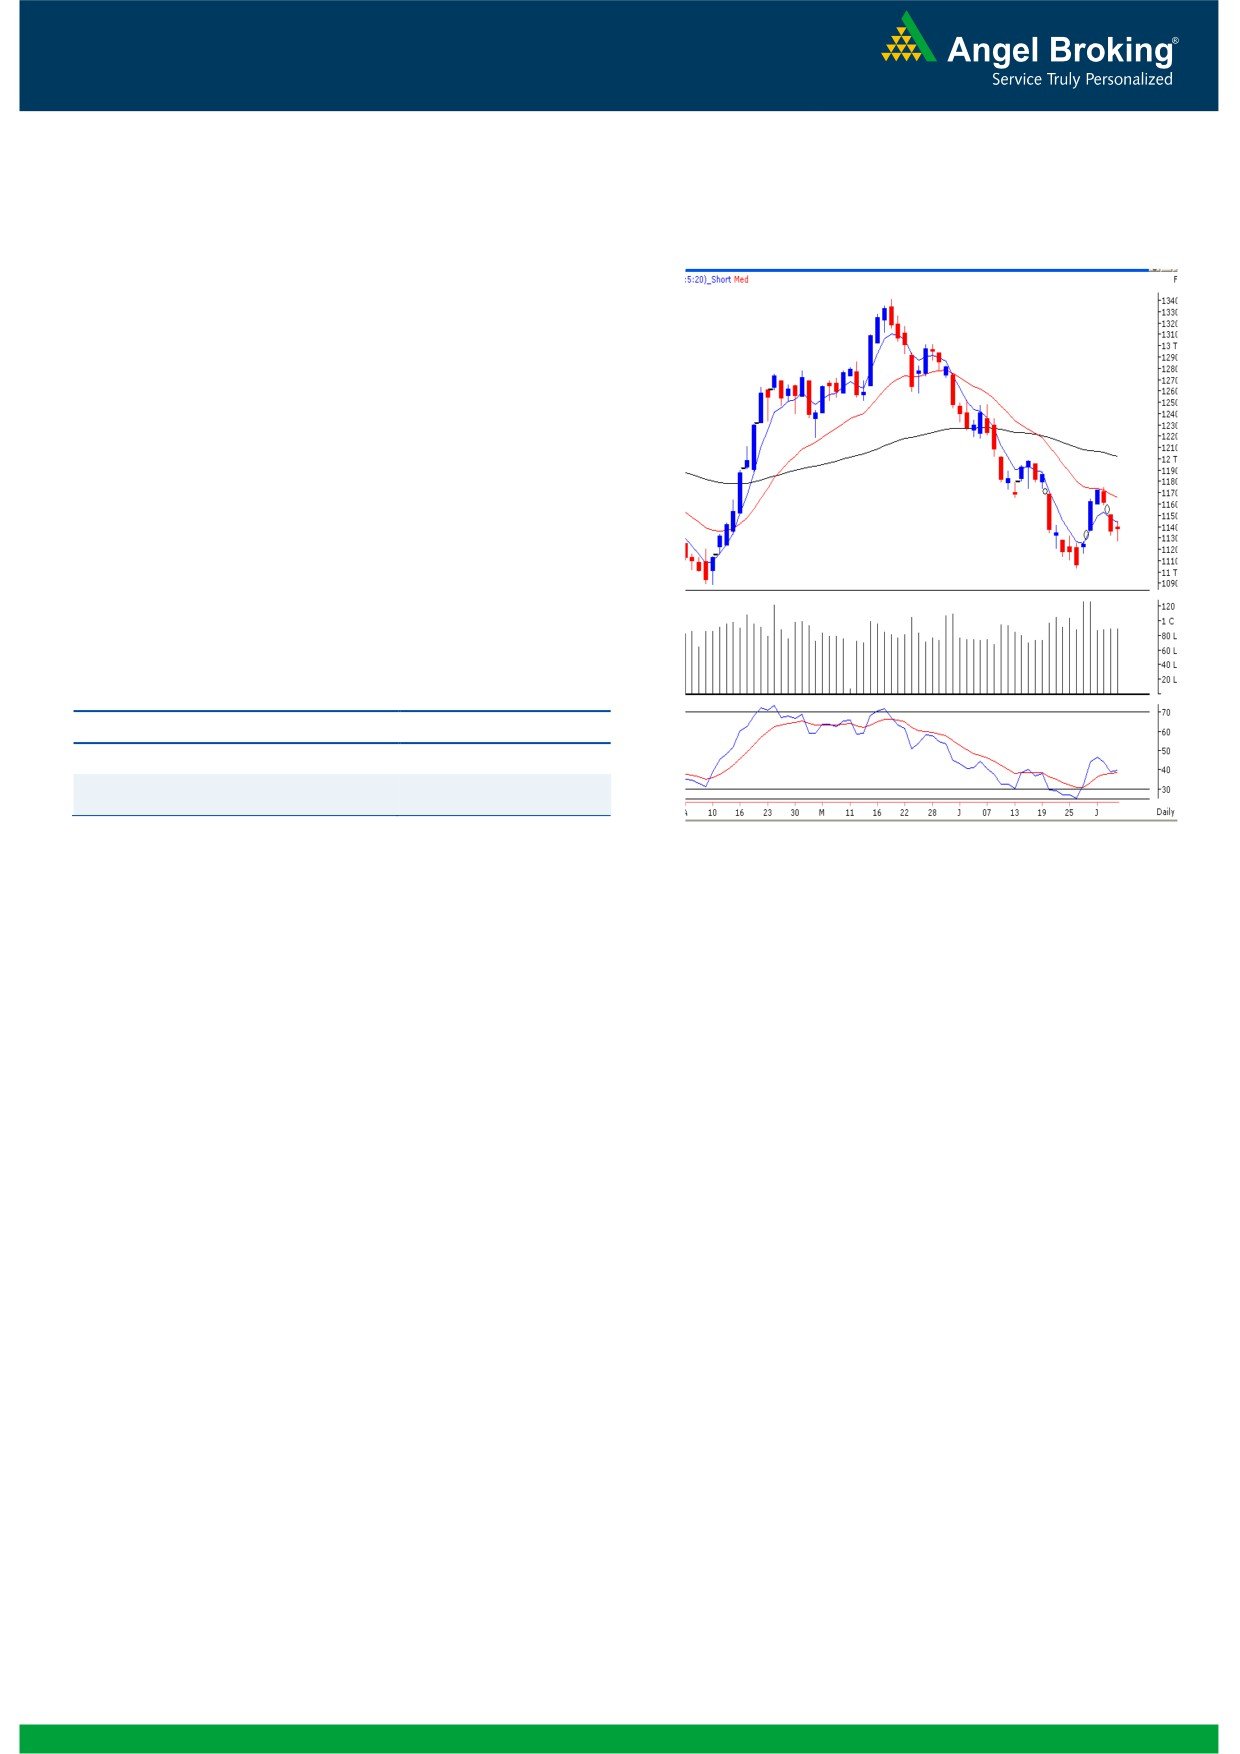
Exhibit 2: Bank Nifty Daily Chart
Bank Nifty Outlook - (11381)
Yesterday, while the benchmark indices closed with
substantial gains the Bank Nifty the Bank Nifty remained
muted for the session. There is no significant change in the
chart structure of this index and thus we reiterate our view that
below the support level of
11300 would augment the
pessimism in the index. As a result, it may test lower levels of
11277 / 11164. On the positive front, the positive crossover
seen in daily ‘RSI-Smoothened’ oscillator is still intact. Hence,
any sustainable move beyond the high of 11506 would
attract buying interest among market participants. In this
case, it may move higher to test 11590.
Actionable points:
View
Neutral
Support Levels
11300 - 11277
Resistance Levels
11506 - 11590
Source: Falcon:
2
Daily Technical Report
July 05, 2013
Research Team Tel: 022 - 30940000
DISCLAIMER
This document is solely for the personal information of the recipient, and must not be singularly used as the basis of any investment
decision. Nothing in this document should be construed as investment or financial advice. Each recipient of this document should make
such investigations as they deem necessary to arrive at an independent evaluation of an investment in the securities of the companies
referred to in this document (including the merits and risks involved), and should consult their own advisors to determine the merits and
risks of such an investment.
Angel Broking Limited, its affiliates, directors, its proprietary trading and investment businesses may, from time to time, make
investment decisions that are inconsistent with or contradictory to the recommendations expressed herein. The views contained in this
document are those of the analyst, and the company may or may not subscribe to all the views expressed within.
Reports based on technical and derivative analysis center on studying charts of a stock's price movement, outstanding positions and
trading volume, as opposed to focusing on a company's fundamentals and, as such, may not match with a report on a company's
fundamentals.
The information in this document has been printed on the basis of publicly available information, internal data and other reliable
sources believed to be true, but we do not represent that it is accurate or complete and it should not be relied on as such, as this
document is for general guidance only. Angel Broking Limited or any of its affiliates/ group companies shall not be in any way
responsible for any loss or damage that may arise to any person from any inadvertent error in the information contained in this report.
Angel Broking Limited has not independently verified all the information contained within this document. Accordingly, we cannot testify,
nor make any representation or warranty, express or implied, to the accuracy, contents or data contained within this document. While
Angel Broking Limited endeavors to update on a reasonable basis the information discussed in this material, there may be regulatory,
compliance, or other reasons that prevent us from doing so.
This document is being supplied to you solely for your information, and its contents, information or data may not be reproduced,
redistributed or passed on, directly or indirectly.
Angel Broking Limited and its affiliates may seek to provide or have engaged in providing corporate finance, investment banking or
other advisory services in a merger or specific transaction to the companies referred to in this report, as on the date of this report or in
the past.
Neither Angel Broking Limited, nor its directors, employees or affiliates shall be liable for any loss or damage that may arise from or in
connection with the use of this information.
Note: Please refer to the important `Stock Holding Disclosure' report on the Angel website (Research Section). Also, please refer to the
latest update on respective stocks for the disclosure status in respect of those stocks. Angel Broking Limited and its affiliates may have
investment positions in the stocks recommended in this report.
Research Team
Shardul Kulkarni
-
Head - Technicals
Sameet Chavan
-
Technical Analyst
Sacchitanand Uttekar
-
Technical Analyst
Angel Broking Pvt. Ltd.
Registered Office: G-1, Ackruti Trade Centre, Rd. No. 7, MIDC, Andheri (E), Mumbai - 400 093.
Corporate Office: 6th Floor, Ackruti Star, MIDC, Andheri (E), Mumbai - 400 093. Tel: (022) 30940000
Sebi Registration No: INB 010996539
4