Daily Technical Report
October 31, 2012
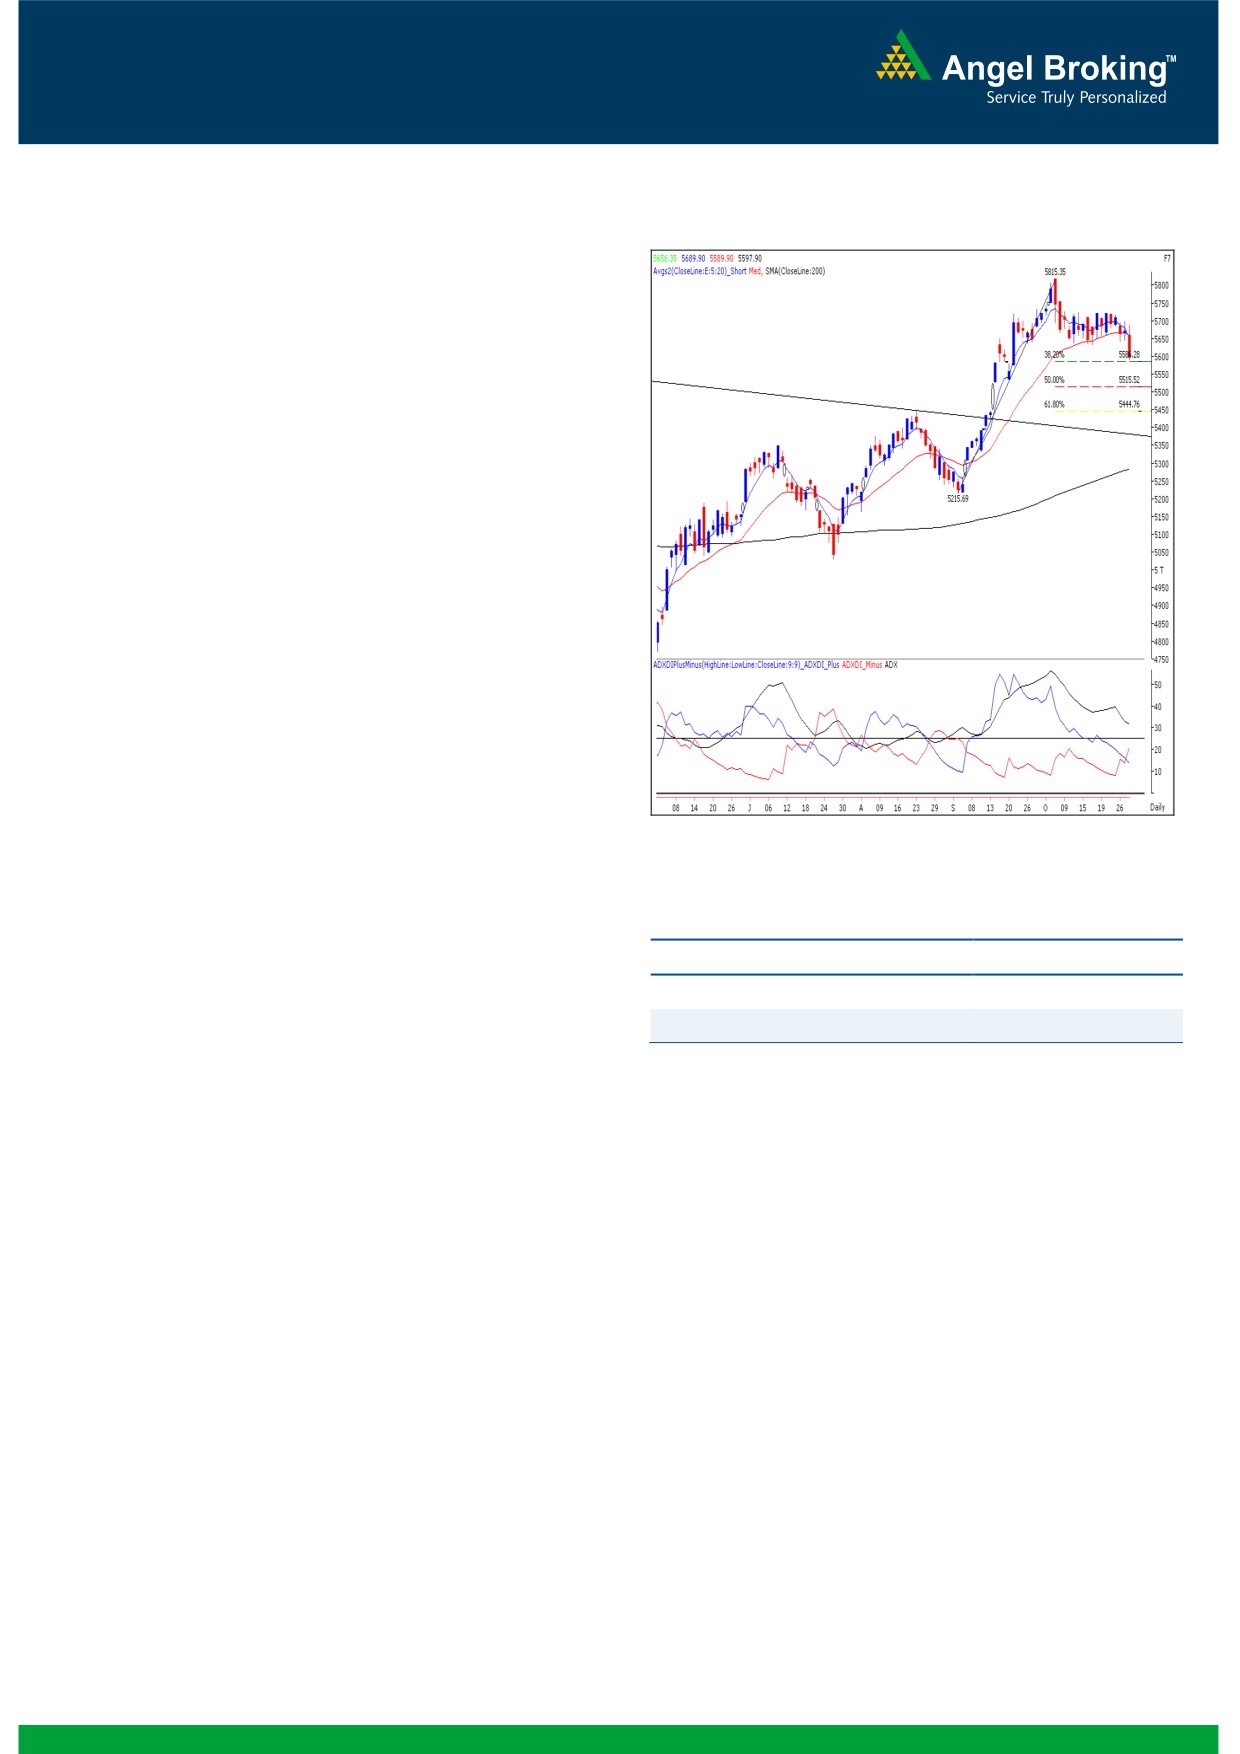
Exhibit 1: Nifty Daily Chart
Sensex (18431) / NIFTY (5598)
Yesterday, our benchmark indices opened on a flat note on
the back of mixed global cues. Subsequently, we observed
some volatility before the announcement of RBI Monetary
policy. However, the outcome (RBI has trimmed the CRR by
25 bps and kept the Repo rate unchanged) from the policy
aided the bears and as a result, indices corrected
significantly in the session. Undoubtedly, yesterday’s fall was
led by the Banking sector as many banking stocks collapsed
during the day. The other major draggers were the Realty,
Capital Goods and Consumer Durables counters. IT and
Teck stocks managed to close marginally in the positive
territory. The advance to decline ratio was strongly in favor
of declining counters (A=997 D=1801) (Source
-
Formation
The ’20-day EMA’ and the ’20-week EMA’ are placed at
18650 / 5667 and 17986 / 5456 levels, respectively.
The monthly ‘RSI’ oscillator is moving higher from the 50
Source: Falcon:
mark and the positive in the ADX (9) indicator is intact.
Actionable points:
The negative crossover in the weekly ‘Stochastic’
oscillator is still intact.
View for the day
Bearish below 5589
The 38.2% and 50% Fibonacci Retracement levels of the
Expected targets
5550 - 5515
rise from 17250 to 19138 / 5216 to 5815 are placed at
Resistance levels
5635 - 5690
18416 / 5586 and 18194 / 5515, respectively.
Trading strategy:
On the flipside, 18535 / 5633 level would now act as a strong
As expected, RBI Monetary policy set the direction for the
intraday resistance for our market.
market after a consolidation of 14 trading sessions. The
prices have finally managed to come out of the narrow
trading range. In the process, the hourly chart now depicts a
breakdown from the ‘Channel’ pattern mentioned in our
earlier reports. This is also supported by the negative
crossover in daily ‘5 & 20 EMA’ and the ADX (9) indicator.
All these technical evidences suggest short term pessimism in
the market. Hence, going forward, if indices sustain below
yesterday’s low of 18393 / 5589, then we may witness
further correction in the market and indices then may slide
towards 18194 / 5515, which is 50% Fibonacci Retracement
levels of the rise from 17250 to 19138 / 5216 to 5815,
respectively.
1
Daily Technical Report
October 31, 2012
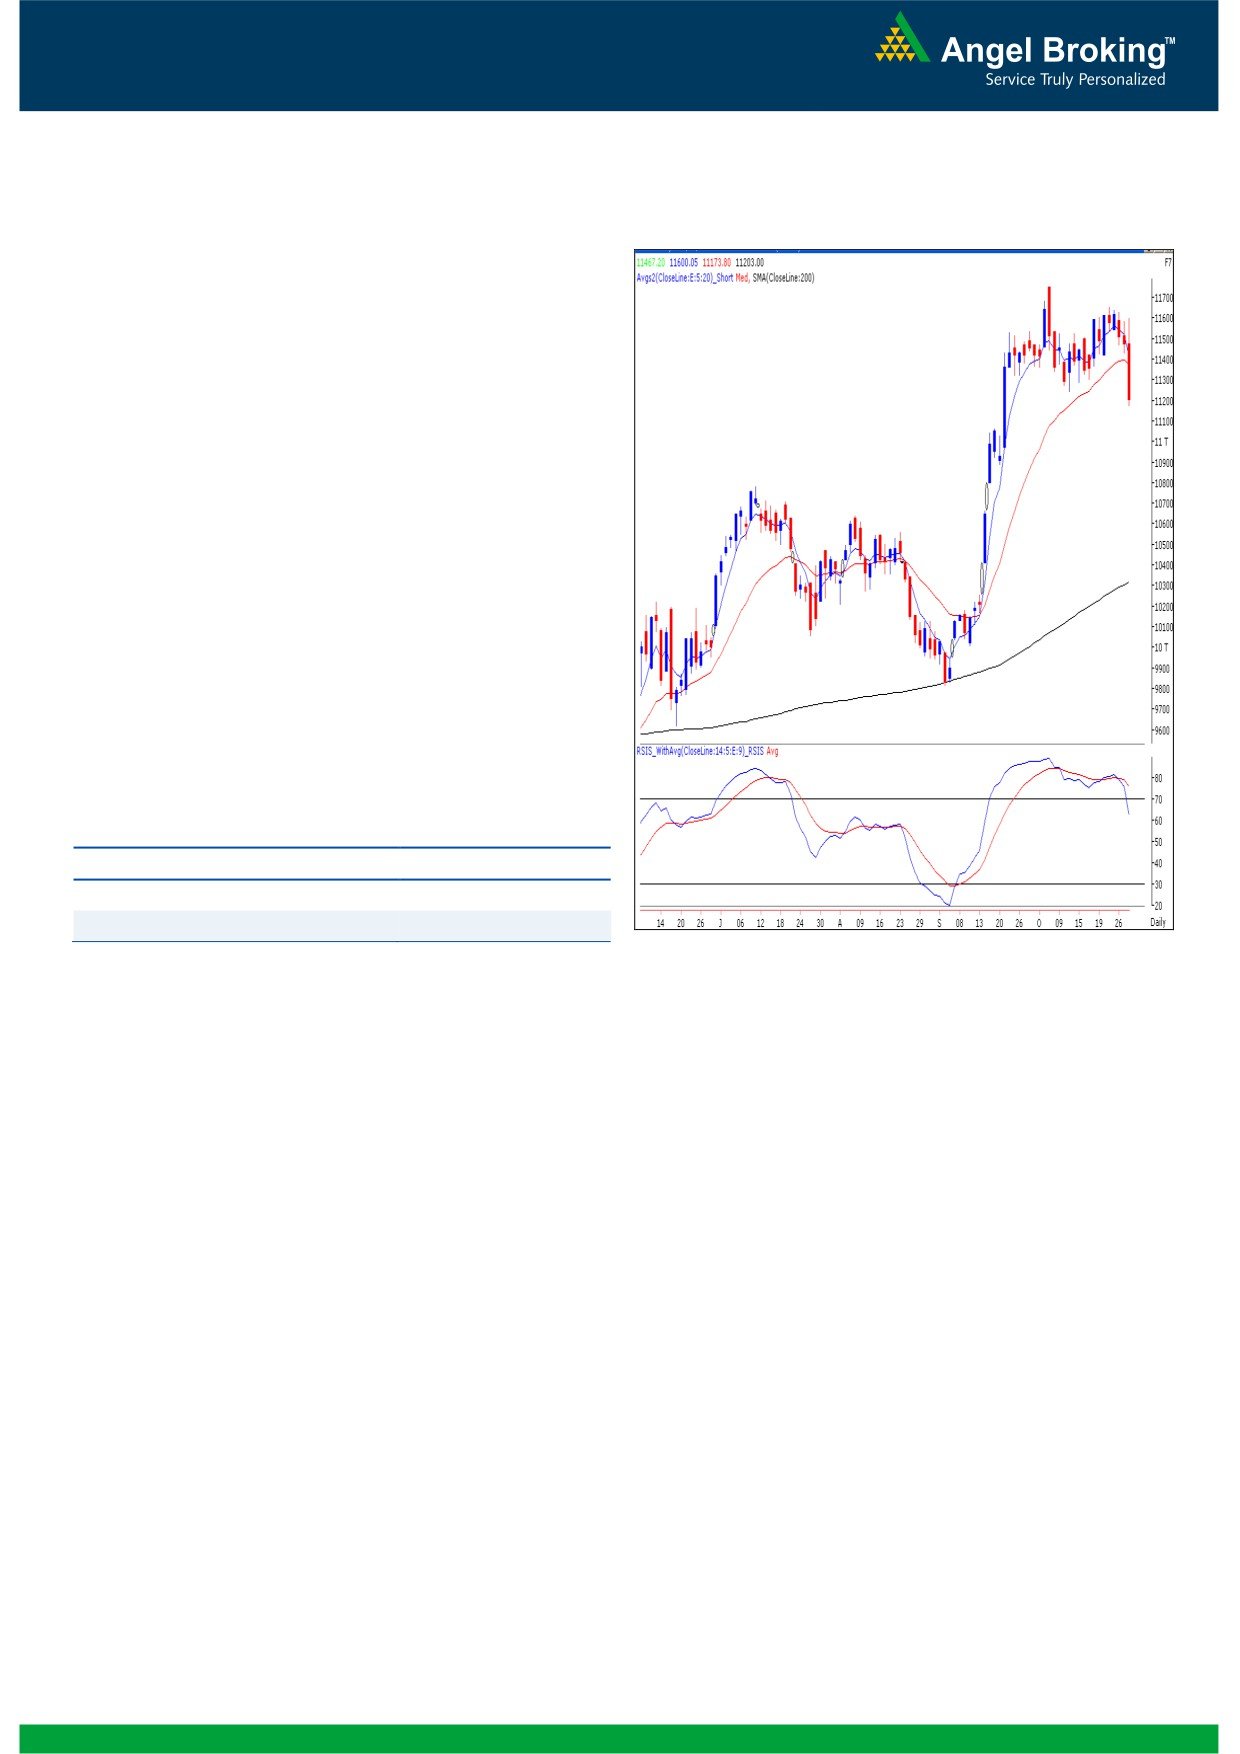
Exhibit 2: Bank Nifty Daily Chart
Bank Nifty Outlook - (11203)
Yesterday, Bank Nifty opened on a pessimistic note and
dragged lower after the RBI monetary policy
announcement to close with a loss of 2.35%. The impact
of the negative crossover in “RSI - Smoothened” oscillator
was seen once the index traded below the 11432 mark.
The Bank Nifty has finally moved out of its range of 11745
- 11245. The momentum oscillators on the daily chart
continue with their sell signals. However, looking at the
oversold condition of momentum oscillators on the hourly
chart some minor pullback or consolidation in the index
cannot be ruled out during intraday trade. On the
downside, if the index sustains below, yesterday’s low of
11174 then it is likely to drift towards 11070 - 11007
level. On the upside 11358 - 11415 levels are likely to act
as resistance in coming trading session.
Actionable points:
View for the day
Bearish Below 11174
Expected Targets
11070 - 11007
Resistance Levels
11358 - 11415
Source: Falcon:
2
Daily Technical Report
October 31, 2012
Daily Pivot Levels for Nifty 50 Stocks
SCRIPS
S2
S1
PIVOT
R1
R2
SENSEX
18,189
18,310
18,514
18,635
18,839
NIFTY
5,526
5,562
5,626
5,662
5,726
BANKNIFTY
10,899
11,051
11,326
11,477
11,752
ACC
1,346
1,362
1,391
1,408
1,437
AMBUJACEM
198
201
206
208
213
ASIANPAINT
3,829
3,859
3,902
3,931
3,974
AXISBANK
1,131
1,158
1,198
1,225
1,266
BAJAJ-AUTO
1,777
1,789
1,804
1,817
1,831
BANKBARODA
677
698
732
752
786
BHARTIARTL
265
268
271
274
277
BHEL
218
224
227
233
236
BPCL
333
336
339
342
345
CAIRN
332
334
335
337
339
CIPLA
350
352
356
358
362
COALINDIA
342
344
348
350
353
DLF
192
196
201
204
209
DRREDDY
1,683
1,704
1,721
1,742
1,760
GAIL
349
352
358
361
366
GRASIM
3,223
3,262
3,333
3,372
3,442
HCLTECH
595
601
608
614
622
HDFC
737
744
754
761
771
HDFCBANK
622
628
636
642
651
HEROMOTOCO
1,788
1,830
1,869
1,912
1,951
HINDALCO
108
110
112
113
116
HINDUNILVR
539
545
549
555
560
ICICIBANK
1,000
1,023
1,055
1,077
1,110
IDFC
153
156
159
163
165
INFY
2,311
2,335
2,350
2,374
2,389
ITC
281
282
285
287
290
JINDALSTEL
365
373
382
390
399
JPASSOCIAT
82
84
88
90
93
KOTAKBANK
586
593
603
609
619
LT
1,592
1,615
1,654
1,678
1,717
LUPIN
557
561
566
570
574
M&M
848
861
880
893
912
MARUTI
1,302
1,346
1,383
1,427
1,464
NTPC
164
165
167
168
170
ONGC
268
270
273
275
277
PNB
697
713
741
757
785
POWERGRID
111
112
114
115
116
RANBAXY
515
518
522
525
529
RELIANCE
792
798
805
810
817
RELINFRA
461
471
484
495
508
SBIN
1,979
2,027
2,113
2,161
2,247
SESAGOA
163
165
167
169
171
SIEMENS
669
676
682
689
695
SUNPHARMA
677
680
684
687
691
TATAMOTORS
237
243
250
255
263
TATAPOWER
103
104
106
107
109
TATASTEEL
385
389
396
400
408
TCS
1,295
1,303
1,313
1,321
1,330
ULTRACEMCO
1,982
1,998
2,017
2,032
2,051
WIPRO
339
343
346
351
354
3
Daily Technical Report
October 31, 2012
Research Team Tel: 022 - 39357800
DISCLAIMER
This document is solely for the personal information of the recipient, and must not be singularly used as the basis of any investment
decision. Nothing in this document should be construed as investment or financial advice. Each recipient of this document should make
such investigations as they deem necessary to arrive at an independent evaluation of an investment in the securities of the companies
referred to in this document (including the merits and risks involved), and should consult their own advisors to determine the merits and
risks of such an investment.
Angel Broking Limited, its affiliates, directors, its proprietary trading and investment businesses may, from time to time, make
investment decisions that are inconsistent with or contradictory to the recommendations expressed herein. The views contained in this
document are those of the analyst, and the company may or may not subscribe to all the views expressed within.
Reports based on technical and derivative analysis center on studying charts of a stock's price movement, outstanding positions and
trading volume, as opposed to focusing on a company's fundamentals and, as such, may not match with a report on a company's
fundamentals.
The information in this document has been printed on the basis of publicly available information, internal data and other reliable
sources believed to be true, but we do not represent that it is accurate or complete and it should not be relied on as such, as this
document is for general guidance only. Angel Broking Limited or any of its affiliates/ group companies shall not be in any way
responsible for any loss or damage that may arise to any person from any inadvertent error in the information contained in this report.
Angel Broking Limited has not independently verified all the information contained within this document. Accordingly, we cannot testify,
nor make any representation or warranty, express or implied, to the accuracy, contents or data contained within this document. While
Angel Broking Limited endeavours to update on a reasonable basis the information discussed in this material, there may be regulatory,
compliance, or other reasons that prevent us from doing so.
This document is being supplied to you solely for your information, and its contents, information or data may not be reproduced,
redistributed or passed on, directly or indirectly.
Angel Broking Limited and its affiliates may seek to provide or have engaged in providing corporate finance, investment banking or
other advisory services in a merger or specific transaction to the companies referred to in this report, as on the date of this report or in
the past.
Neither Angel Broking Limited, nor its directors, employees or affiliates shall be liable for any loss or damage that may arise from or in
connection with the use of this information.
Note: Please refer to the important `Stock Holding Disclosure' report on the Angel website (Research Section). Also, please refer to the
latest update on respective stocks for the disclosure status in respect of those stocks. Angel Broking Limited and its affiliates may have
investment positions in the stocks recommended in this report.
Research Team
Shardul Kulkarni
-
Head - Technicals
Sameet Chavan
-
Technical Analyst
Sacchitanand Uttekar
-
Technical Analyst
Mehul Kothari
-
Technical Analyst
Ankur Lakhotia
-
Technical Analyst
Angel Broking Pvt. Ltd.
Registered Office: G-1, Ackruti Trade Centre, Rd. No. 7, MIDC, Andheri (E), Mumbai - 400 093.
Corporate Office: 6th Floor, Ackruti Star, MIDC, Andheri (E), Mumbai - 400 093. Tel: (022) 3952 6600
Sebi Registration No: INB 010996539
4