Daily Technical Report
November 30, 2012
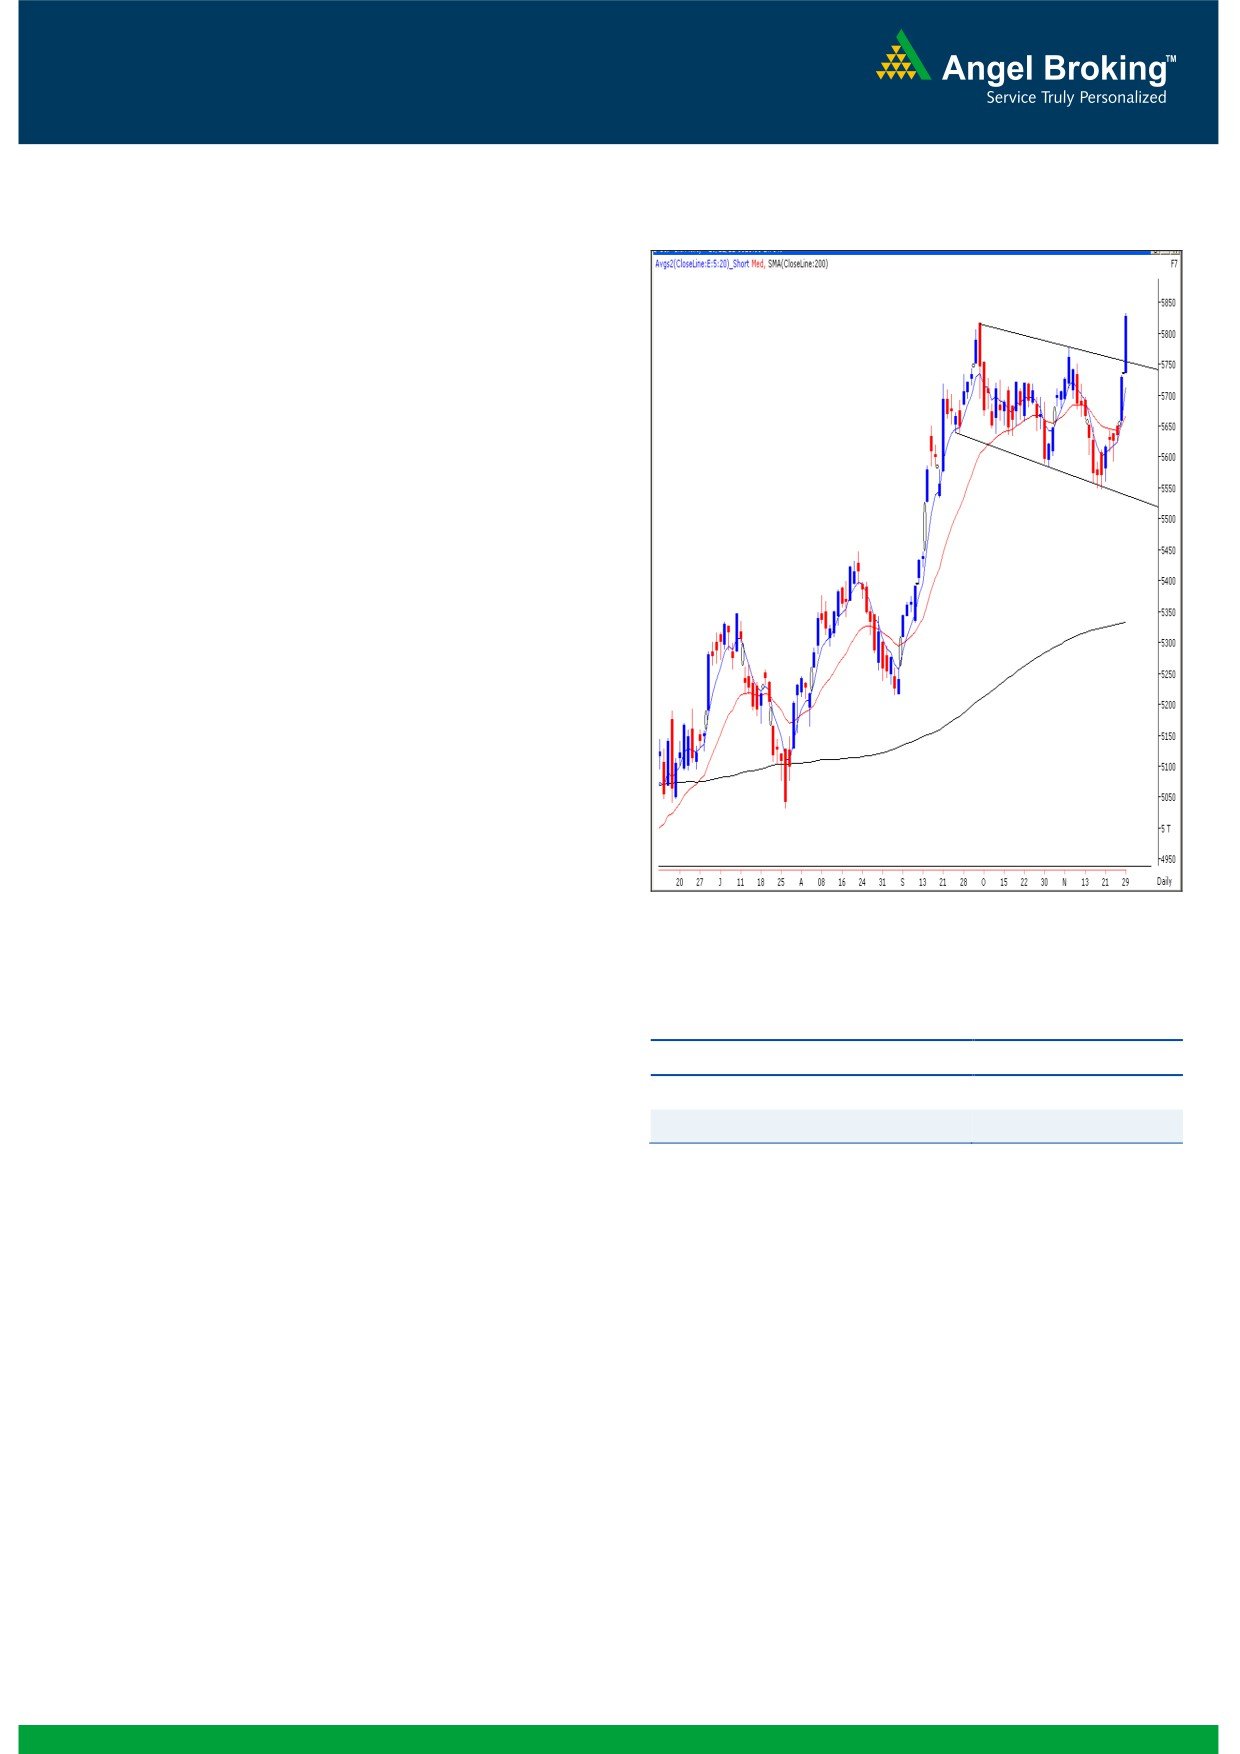
Exhibit 1: Nifty Daily Chart
Sensex (19171) / NIFTY (5825)
Yesterday once again we witnessed a gap up opening on the
back of positive Asian cues and markets surged higher to
close beyond 5800 mark. Most of the sectors contributed to
the rally. Once again Realty counters were the major gainers
followed by Banking and Auto sector. The Teck and IT stocks
remained under pressure and ended with marginal loss. The
advance to decline ratio was strongly in favor of advancing
Formation
The ’20-day EMA’ and the ’20-week EMA’ are placed at
18638 / 5667 and 18267 / 5547 levels, respectively.
The negative crossover in weekly ‘RSI - Smoothened’ is
still intact.
We are witnessing a ‘Channel’ pattern breakout at 5750
level on the daily chart.
Trading strategy:
For the second consecutive session we have witnessed a gap
up opening in-line with the global cues. As a result, indices
opened above Tuesday’s high of 18863 / 5733 level and
Source: Falcon:
then precisely met with our target of 19137 / 5815 during
the latter part of the day. Yesterday’s strong intraday rally
was the impact of positive crossover of daily ‘5 & 20 EMA’
Actionable points:
and the ‘RSI-Smoothened’ oscillator mentioned in our
previous report. We are also witnessing a ‘Channel’ pattern
View for the day
Bullish Above 5834
breakout on the daily chart. In addition, our benchmark
Expected Targets
5900
indices have closed at ’52-week high’ and we expect further
Support Levels
5789 - 5750
upside in the coming trading sessions. Considering the
‘Channel’ pattern breakout mentioned above, we now
expect the indices to move towards 19697 - 19811 / 5900 -
5944 levels. However, a brief consolidation
/ minor
correction cannot be ruled out as Indices have now rallied
almost 4% in last two sessions. Nevertheless, bias remains on
the positive side and we advise positional traders to buy into
every decline. The breakout point of the channel pattern i.e.
18900 / 5750 level is now expected to act as a strong
support in coming trading sessions.
1
Daily Technical Report
November 30, 2012
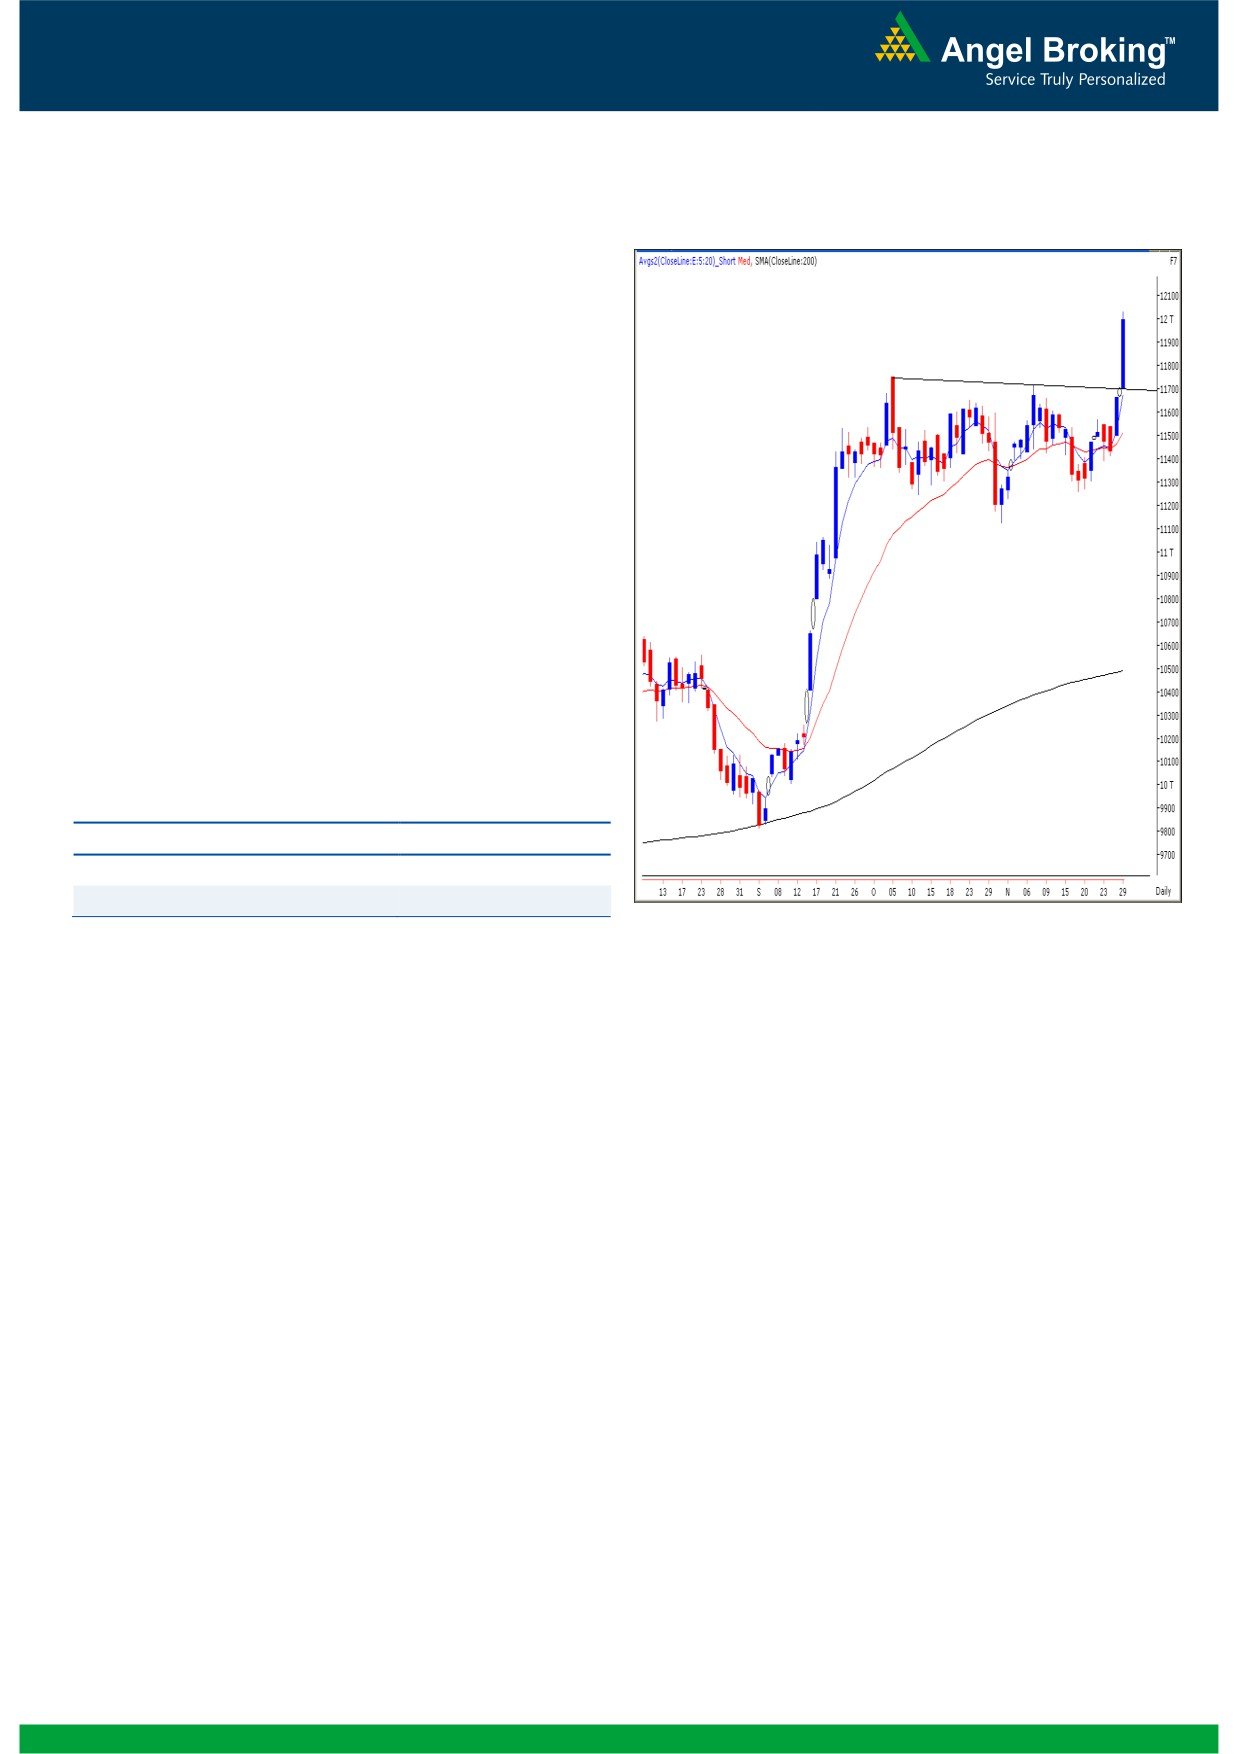
Exhibit 2: Bank Nifty Hourly Chart
Bank Nifty Outlook - (11993)
Yesterday, in line with the benchmark indices the Bank
Nifty too showed significant optimism and tested the
psychological 12000 mark. On the Daily chart, we are
witnessing a horizontal trend line breakout at 11745 level.
In addition, the momentum oscillators are positively poised
which suggests further upside in the coming trading
sessions. Hence, if the Bank Nifty, trades convincingly
above yesterday’s high of 12035 then the index may rally
higher towards 12128 - 12200 levels. On the flipside,
since the hourly chart structure is in overbought condition,
a minor consolidation or a pullback from current levels
cannot be ruled out. In this scenario, 11820 level may act
as a decent support. Bias remains positive and traders are
advised to buy on every decline.
Actionable points:
View for the day
Bullish Above 12035
Expected Targets
12128 - 12200
Support Levels
11820 - 11714
Source: Falcon:
2
Daily Technical Report
November 30, 2012
Research Team Tel: 022 - 39357800
DISCLAIMER
This document is solely for the personal information of the recipient, and must not be singularly used as the basis of any investment
decision. Nothing in this document should be construed as investment or financial advice. Each recipient of this document should make
such investigations as they deem necessary to arrive at an independent evaluation of an investment in the securities of the companies
referred to in this document (including the merits and risks involved), and should consult their own advisors to determine the merits and
risks of such an investment.
Angel Broking Limited, its affiliates, directors, its proprietary trading and investment businesses may, from time to time, make
investment decisions that are inconsistent with or contradictory to the recommendations expressed herein. The views contained in this
document are those of the analyst, and the company may or may not subscribe to all the views expressed within.
Reports based on technical and derivative analysis center on studying charts of a stock's price movement, outstanding positions and
trading volume, as opposed to focusing on a company's fundamentals and, as such, may not match with a report on a company's
fundamentals.
The information in this document has been printed on the basis of publicly available information, internal data and other reliable
sources believed to be true, but we do not represent that it is accurate or complete and it should not be relied on as such, as this
document is for general guidance only. Angel Broking Limited or any of its affiliates/ group companies shall not be in any way
responsible for any loss or damage that may arise to any person from any inadvertent error in the information contained in this report.
Angel Broking Limited has not independently verified all the information contained within this document. Accordingly, we cannot testify,
nor make any representation or warranty, express or implied, to the accuracy, contents or data contained within this document. While
Angel Broking Limited endeavours to update on a reasonable basis the information discussed in this material, there may be regulatory,
compliance, or other reasons that prevent us from doing so.
This document is being supplied to you solely for your information, and its contents, information or data may not be reproduced,
redistributed or passed on, directly or indirectly.
Angel Broking Limited and its affiliates may seek to provide or have engaged in providing corporate finance, investment banking or
other advisory services in a merger or specific transaction to the companies referred to in this report, as on the date of this report or in
the past.
Neither Angel Broking Limited, nor its directors, employees or affiliates shall be liable for any loss or damage that may arise from or in
connection with the use of this information.
Note: Please refer to the important `Stock Holding Disclosure' report on the Angel website (Research Section). Also, please refer to the
latest update on respective stocks for the disclosure status in respect of those stocks. Angel Broking Limited and its affiliates may have
investment positions in the stocks recommended in this report.
Research Team
Shardul Kulkarni
-
Head - Technicals
Sameet Chavan
-
Technical Analyst
Sacchitanand Uttekar
-
Technical Analyst
Mehul Kothari
-
Technical Analyst
Ankur Lakhotia
-
Technical Analyst
Angel Broking Pvt. Ltd.
Registered Office: G-1, Ackruti Trade Centre, Rd. No. 7, MIDC, Andheri (E), Mumbai - 400 093.
Corporate Office: 6th Floor, Ackruti Star, MIDC, Andheri (E), Mumbai - 400 093. Tel: (022) 3952 6600
Sebi Registration No: INB 010996539
4