Daily Technical Report
October 30, 2012
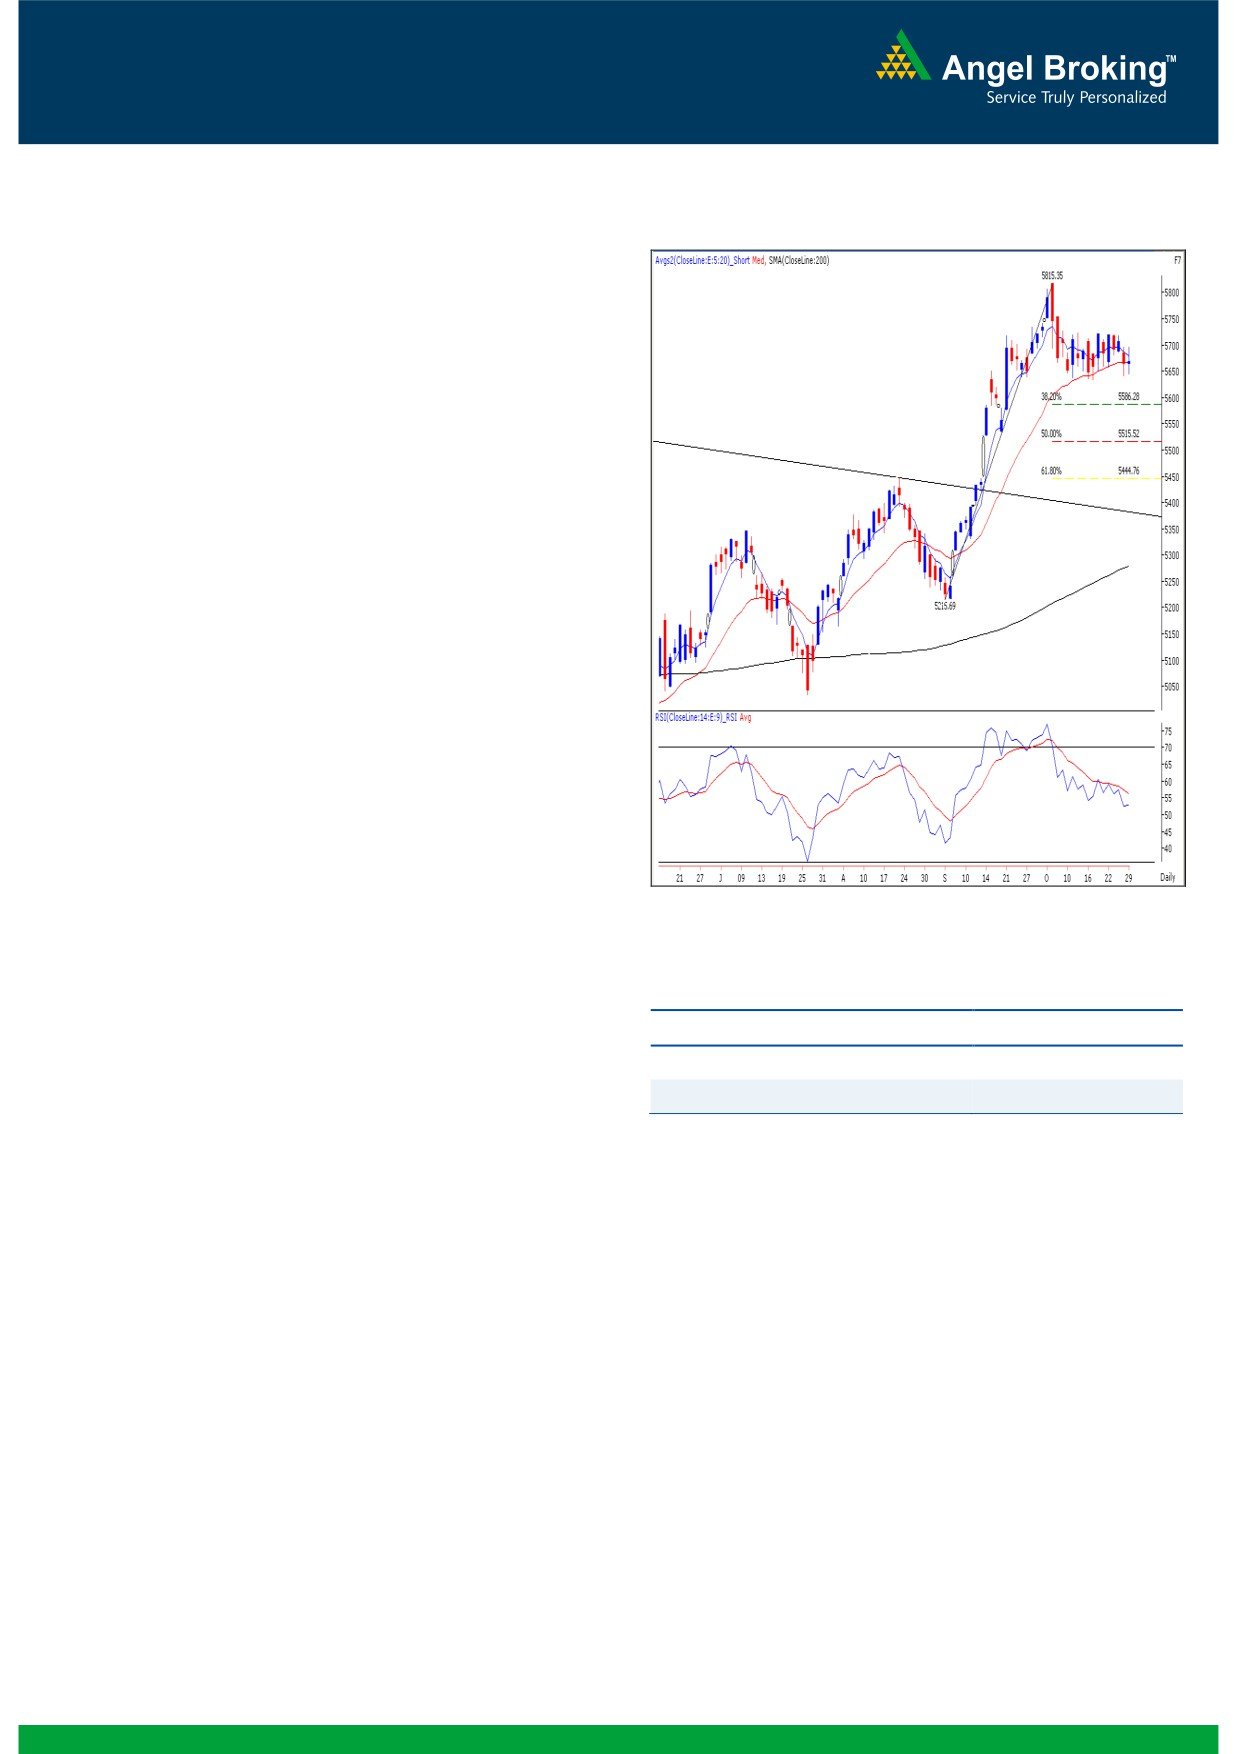
Exhibit 1: Nifty Daily Chart
Sensex (18636) / NIFTY (5666)
The beginning of the week was slightly on the optimistic side,
but once again Indices pared their early gains during the
second half and eventually closed on a flat note. Yesterday,
the Capital Goods, Realty and Power sectors were among
the major draggers; whereas the Oil & Gas heavyweight
Reliance Industries along with Capital Durables counters
supported the market. The advance to decline ratio was
strongly in favor of declining counters (A=1234 D=1604)
Formation
The ’20-day EMA’ and the ’20-week EMA’ are placed at
18650 / 5667 and 17986 / 5456 levels, respectively.
The monthly ‘RSI’ oscillator is moving higher from the 50
mark and the positive in the ADX (9) indicator is intact.
The negative crossover in the weekly ‘Stochastic’
oscillator is still intact.
At present, the value of the Daily ‘RSI’ oscillator is 52.58.
The RSI trading above the 50 mark shows strength of the
current up trend.
Source: Falcon:
The 38.2% and 50% Fibonacci Retracement levels of the
rise from 17250 to 19138 / 5216 to 5815 are placed at
Actionable points:
18416 / 5586 and 18194 / 5515, respectively.
View for the day
Neutral
Trading strategy:
Resistance Levels
5729 - 5757
Every trading session is proving out to be a replica of the
Support Levels
5633 - 5586
previous trading sessions. It’s been 14 trading sessions that
we have been experiencing a range-bound activity. The
Conversely, a breach of 18535 / 5633 level may trigger near-
markets are clearly awaiting some trigger on the domestic or
term pessimism in the market and as a result, the market may
the global front and today’s RBI Monetary Policy might just
slide towards 18416 / 5586 and 18194 / 5515, which are
be the event traders are looking for. The technical levels are
38.2% and 50% Fibonacci Retracement levels of the rise from
still unchanged. We continue to mention that the sustainable
17250 to 19138 / 5216 to 5815, respectively. Traders are
breakout or breakdown on either side of the trading range
advised to trade with strict stop losses as we expect the volatility
(18886 to 18535 /
5729 to 5633) will provide clear
to increase on account of the RBI monetary policy.
direction for our market. A move beyond 18886 / 5729 level
may push indices higher towards 18973 - 19138 / 5757 -
5816. A move beyond 19138 / 5816 would attract further
buying in the market and as a result, the up move may
extend towards 19542 - 19812 / 5850 - 5945 levels.
1
Daily Technical Report
October 30, 2012
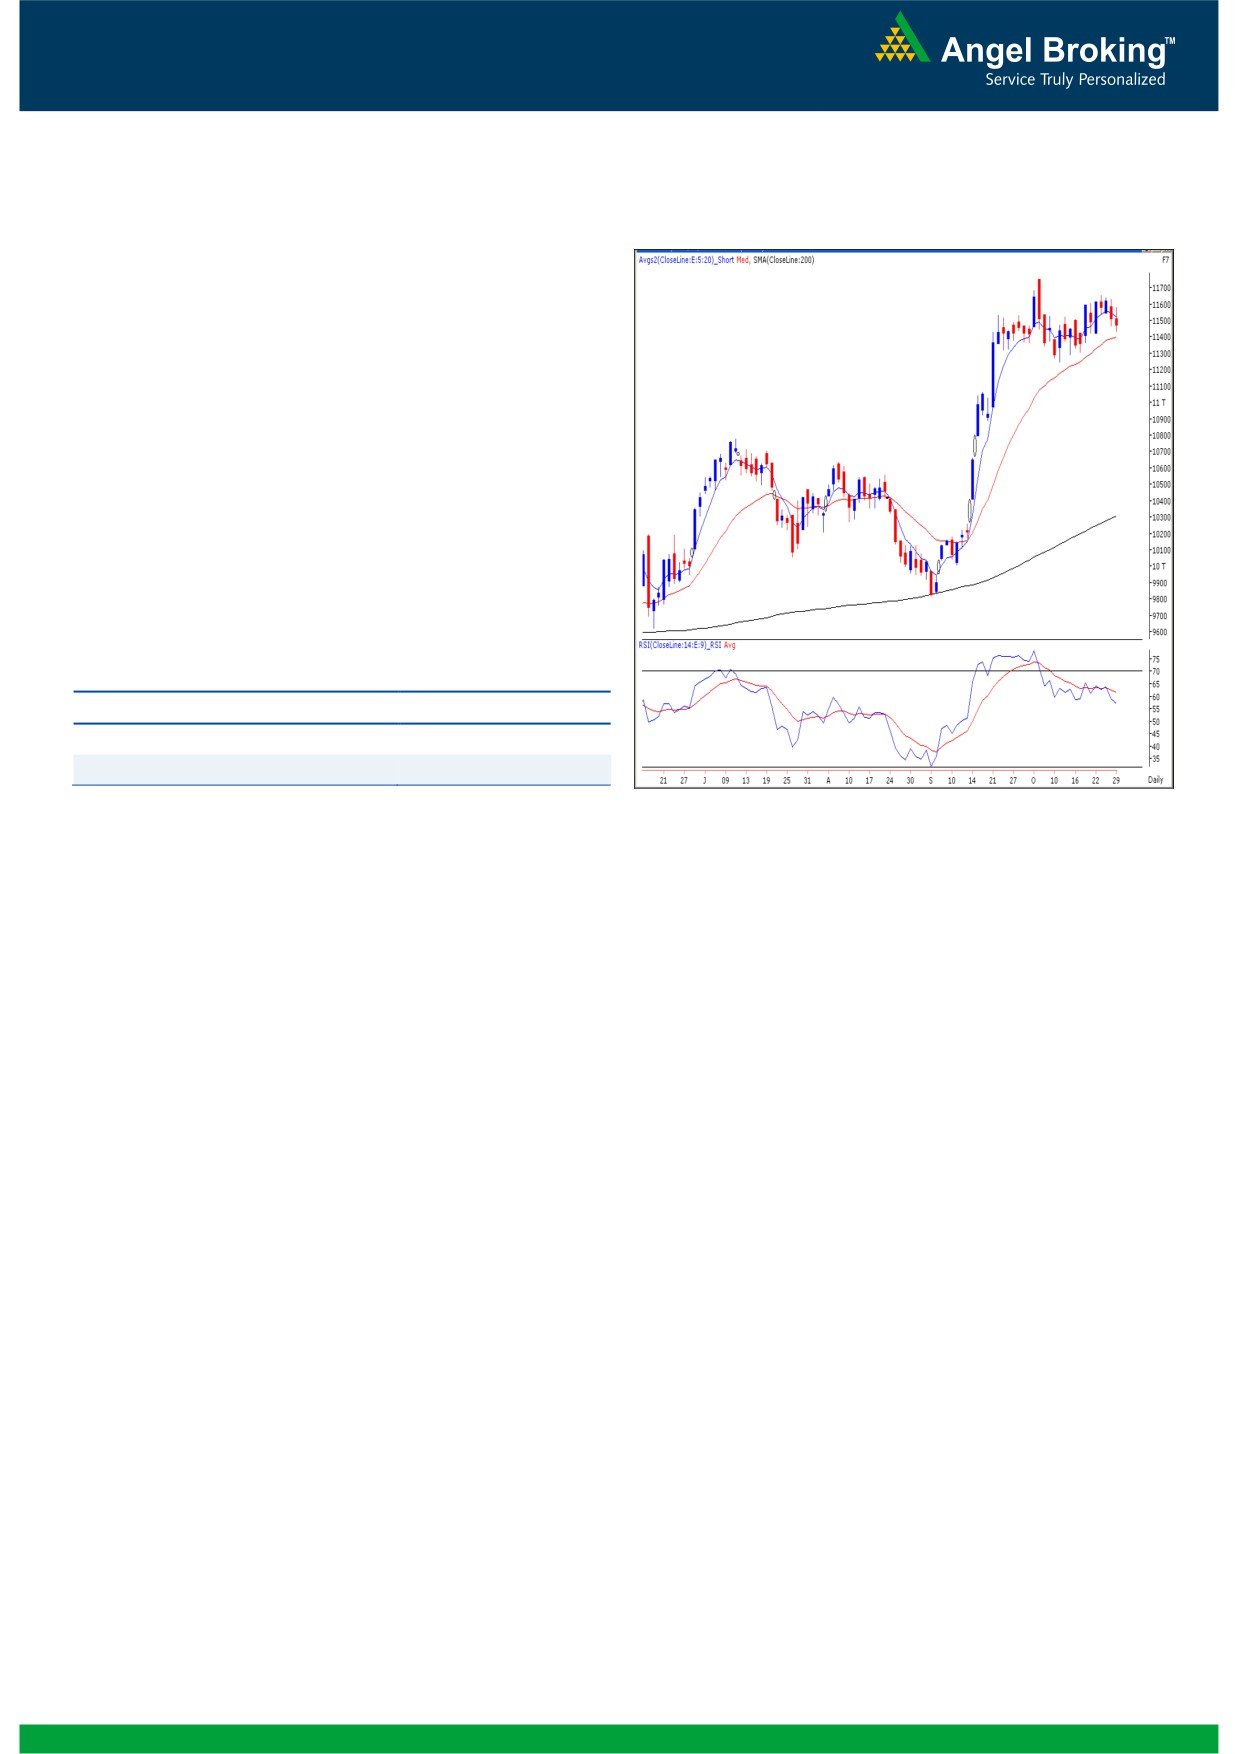
Exhibit 2: Bank Nifty Daily Chart
Bank Nifty Outlook - (11472)
Yesterday, Bank Nifty opened on a pessimistic note and
traded in a narrow range throughout the session. The
momentum oscillator “Stochastic” on the daily chart
continues with its sell signal. In addition, now we are
witnessing a negative crossover in “RSI- Smoothened”
oscillator on the daily chart. The impact of the negative
crossover would be seen if the index sustains below
yesterday’s low of 11432. In this case the index is likely to
drift towards 11364 - 11303 levels. On the upside 11535
- 11598 levels are likely to act as resistance for the day.
Actionable points:
View for the day
Bearish Below 11432
Expected Targets
11364 - 11303
Resistance Levels
11535 - 11598
Source: Falcon:
2
Daily Technical Report
October 30, 2012
Daily Pivot Levels for Nifty 50 Stocks
SCRIPS
S2
S1
PIVOT
R1
R2
SENSEX
18,479
18,557
18,650
18,729
18,822
NIFTY
5,616
5,641
5,670
5,694
5,723
BANKNIFTY
11,343
11,407
11,497
11,561
11,650
ACC
1,397
1,406
1,413
1,422
1,429
AMBUJACEM
206
208
210
211
213
ASIANPAINT
3,869
3,900
3,924
3,955
3,979
AXISBANK
1,198
1,210
1,225
1,237
1,252
BAJAJ-AUTO
1,780
1,795
1,804
1,819
1,828
BANKBARODA
741
748
756
763
771
BHARTIARTL
264
267
269
272
274
BHEL
214
220
233
239
252
BPCL
338
340
345
347
351
CAIRN
333
334
336
337
338
CIPLA
354
357
359
362
364
COALINDIA
344
347
352
355
360
DLF
198
201
204
206
209
DRREDDY
1,671
1,684
1,695
1,708
1,718
GAIL
353
357
362
366
371
GRASIM
3,317
3,349
3,397
3,429
3,478
HCLTECH
602
606
610
614
618
HDFC
746
752
757
763
768
HDFCBANK
633
637
640
644
647
HEROMOTOCO
1,846
1,875
1,898
1,927
1,949
HINDALCO
112
113
114
115
116
HINDUNILVR
536
541
546
552
557
ICICIBANK
1,051
1,060
1,072
1,081
1,093
IDFC
156
157
158
160
161
INFY
2,296
2,316
2,327
2,347
2,359
ITC
284
286
288
290
292
JINDALSTEL
378
383
390
395
402
JPASSOCIAT
87
89
90
92
93
KOTAKBANK
600
605
613
618
627
LT
1,660
1,674
1,697
1,711
1,734
LUPIN
556
561
568
572
580
M&M
874
881
890
898
907
MARUTI
1,344
1,353
1,363
1,372
1,382
NTPC
165
166
168
170
171
ONGC
271
273
275
276
278
PNB
734
745
754
765
774
POWERGRID
113
114
115
116
116
RANBAXY
512
518
524
530
536
RELIANCE
797
804
809
816
821
RELINFRA
479
487
492
499
504
SBIN
2,129
2,148
2,176
2,196
2,224
SESAGOA
164
166
169
171
174
SIEMENS
671
679
684
692
696
SUNPHARMA
676
682
686
692
697
TATAMOTORS
248
253
258
263
269
TATAPOWER
104
105
106
108
108
TATASTEEL
397
399
402
405
407
TCS
1,291
1,300
1,310
1,319
1,329
ULTRACEMCO
2,010
2,023
2,035
2,047
2,059
WIPRO
335
340
343
348
351
3
Daily Technical Report
October 30, 2012
Research Team Tel: 022 - 39357800
DISCLAIMER
This document is solely for the personal information of the recipient, and must not be singularly used as the basis of any investment
decision. Nothing in this document should be construed as investment or financial advice. Each recipient of this document should make
such investigations as they deem necessary to arrive at an independent evaluation of an investment in the securities of the companies
referred to in this document (including the merits and risks involved), and should consult their own advisors to determine the merits and
risks of such an investment.
Angel Broking Limited, its affiliates, directors, its proprietary trading and investment businesses may, from time to time, make
investment decisions that are inconsistent with or contradictory to the recommendations expressed herein. The views contained in this
document are those of the analyst, and the company may or may not subscribe to all the views expressed within.
Reports based on technical and derivative analysis center on studying charts of a stock's price movement, outstanding positions and
trading volume, as opposed to focusing on a company's fundamentals and, as such, may not match with a report on a company's
fundamentals.
The information in this document has been printed on the basis of publicly available information, internal data and other reliable
sources believed to be true, but we do not represent that it is accurate or complete and it should not be relied on as such, as this
document is for general guidance only. Angel Broking Limited or any of its affiliates/ group companies shall not be in any way
responsible for any loss or damage that may arise to any person from any inadvertent error in the information contained in this report.
Angel Broking Limited has not independently verified all the information contained within this document. Accordingly, we cannot testify,
nor make any representation or warranty, express or implied, to the accuracy, contents or data contained within this document. While
Angel Broking Limited endeavours to update on a reasonable basis the information discussed in this material, there may be regulatory,
compliance, or other reasons that prevent us from doing so.
This document is being supplied to you solely for your information, and its contents, information or data may not be reproduced,
redistributed or passed on, directly or indirectly.
Angel Broking Limited and its affiliates may seek to provide or have engaged in providing corporate finance, investment banking or
other advisory services in a merger or specific transaction to the companies referred to in this report, as on the date of this report or in
the past.
Neither Angel Broking Limited, nor its directors, employees or affiliates shall be liable for any loss or damage that may arise from or in
connection with the use of this information.
Note: Please refer to the important `Stock Holding Disclosure' report on the Angel website (Research Section). Also, please refer to the
latest update on respective stocks for the disclosure status in respect of those stocks. Angel Broking Limited and its affiliates may have
investment positions in the stocks recommended in this report.
Research Team
Shardul Kulkarni
-
Head - Technicals
Sameet Chavan
-
Technical Analyst
Sacchitanand Uttekar
-
Technical Analyst
Mehul Kothari
-
Technical Analyst
Ankur Lakhotia
-
Technical Analyst
Angel Broking Pvt. Ltd.
Registered Office: G-1, Ackruti Trade Centre, Rd. No. 7, MIDC, Andheri (E), Mumbai - 400 093.
Corporate Office: 6th Floor, Ackruti Star, MIDC, Andheri (E), Mumbai - 400 093. Tel: (022) 3952 6600
Sebi Registration No: INB 010996539
4