Daily Technical Report
October 29, 2012
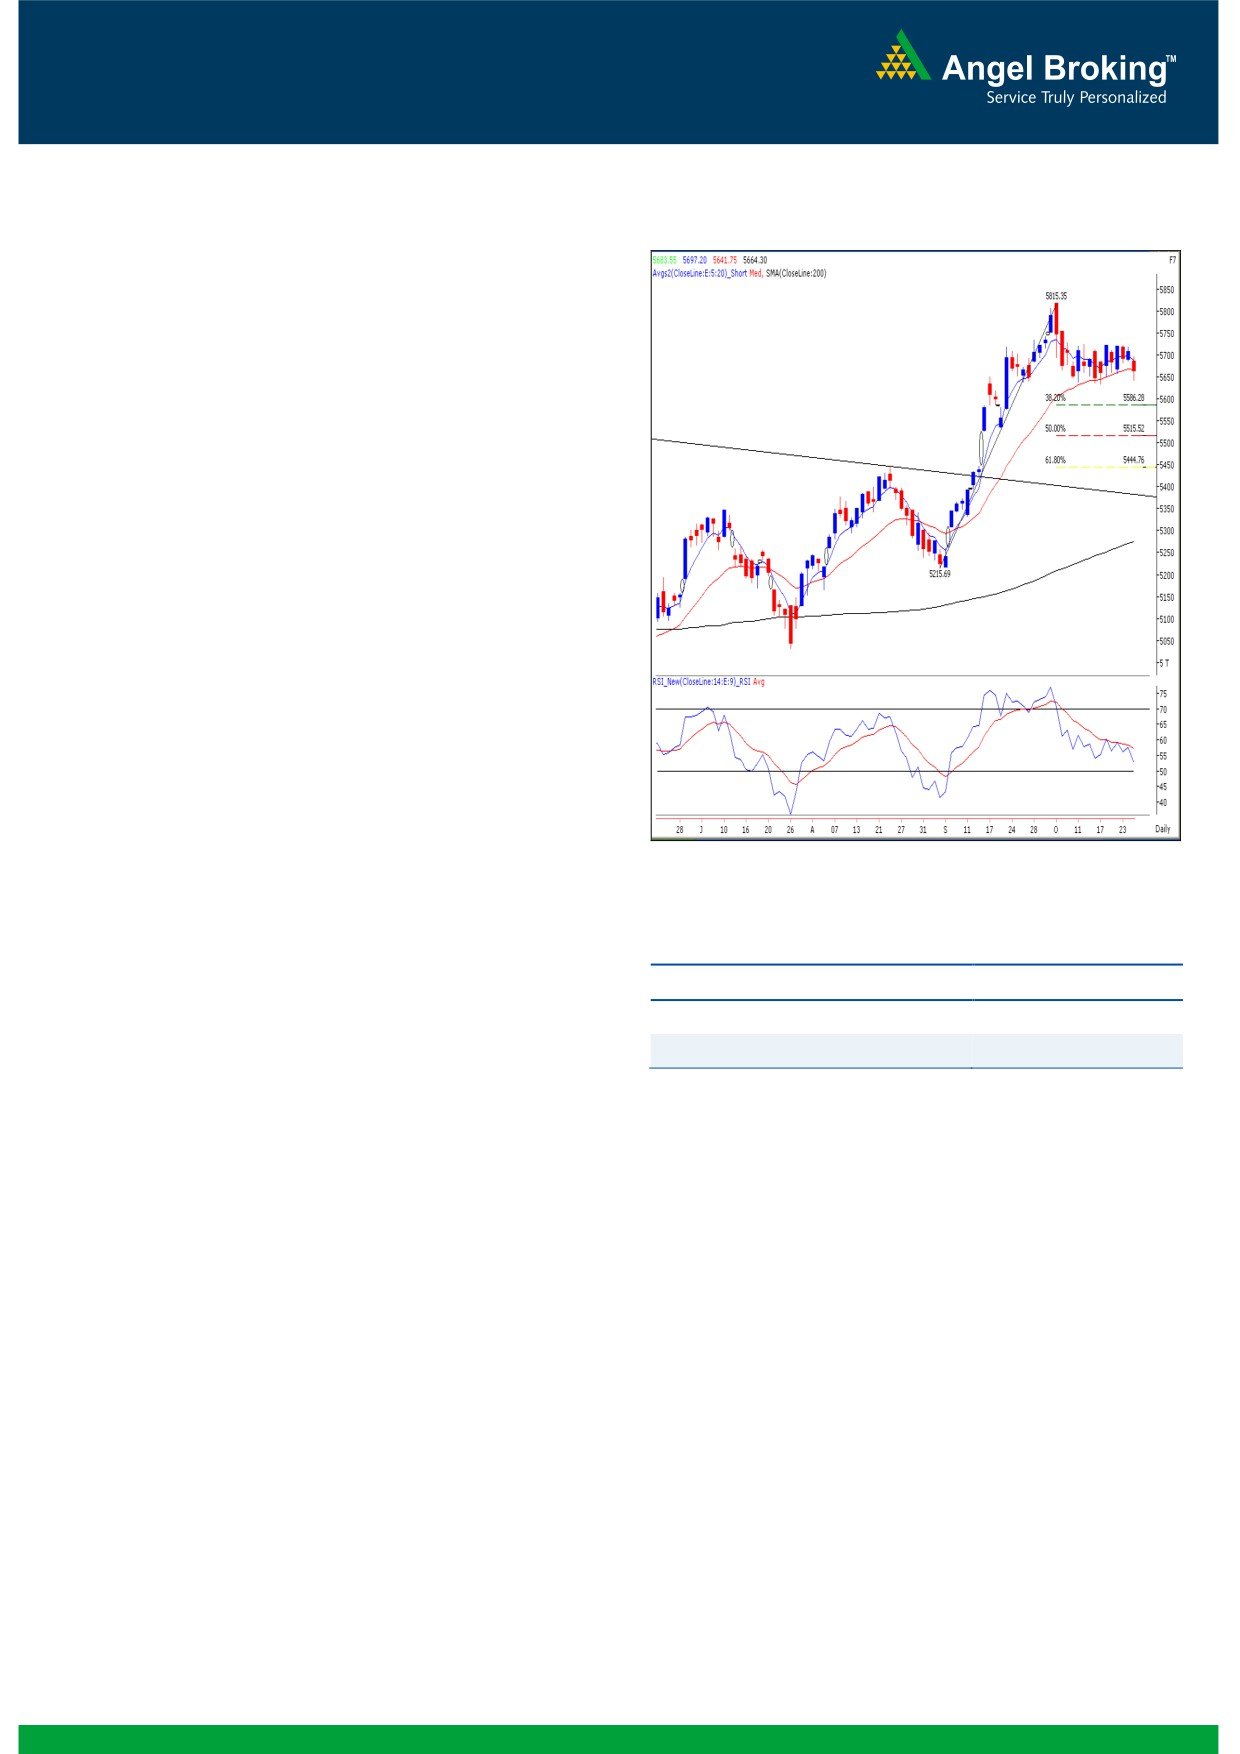
Exhibit 1: Nifty Daily Chart
Sensex (18625) / NIFTY (5664)
The first day of November series ended with weakness on
Friday where our Indices closed in red on the back of fall in
global markets and weakness in FMCG. However, markets
are still in the range of 5729 - 5633 levels. On sectoral
front, Consumer Durables and FMCG counters contributed
heavily in Friday’s fall. Auto counters remained resilient on
the back of M&M results. The advance to decline ratio was
strongly in favor of declining counters (A=1030 D=1801)
Formation
The ’20-day EMA’ and the ’20-week EMA’ are placed at
18650 / 5667 and 17986 / 5456 levels, respectively.
The monthly ‘RSI’ oscillator is moving higher from the 50
mark and the positive in the ADX (9) indicator is intact.
The negative crossover in the weekly ‘Stochastic’
oscillator is still intact.
At present, the value of the Daily ‘RSI’ oscillator is 52.58.
The RSI trading above the 50 mark shows strength of the
Source: Falcon:
current up trend.
Actionable points:
The 38.2% and 50% Fibonacci Retracement levels of the
rise from 17250 to 19138 / 5216 to 5815 are placed at
View for the day
Neutral
18416 / 5586 and 18194 / 5515, respectively.
Resistance Levels
5729 - 5757
Trading strategy:
Support Levels
5633 - 5586
The boredom continues in the market as prices are reluctant
to move out of the narrow trading range. It’s been nearly 10
On the flipside, the weekly ‘Stochastic’ is still negatively poised.
- 12 trading sessions that we have been experiencing a
The impact of this technical tool would be seen if indices
range-bound activity. As a result, the hourly chart now
sustain below 18535 / 5633. This may trigger near-term
depicts a ‘Channel’ pattern. Hence, we would continue to
pessimism in the market and as a result, the market may slide
await the sustainable breakout on either side from the
towards 18416 / 5586 and 18194 / 5515, which are 38.2%
trading range (breakout from the ‘Channel’ pattern) of
and 50% Fibonacci Retracement levels of the rise from 17250
18886 to 18535 / 5729 to 5633. The
’20-day EMA’
to 19138 / 5216 to 5815, respectively. Traders are advised to
continues to provide decent support to our market and the
trade with strict stop losses as we expect the volatility to
‘RSI’ oscillator is still above the 50 mark. As long as the ‘RSI’
increase post announcement of the RBI monetary policy.
oscillator stays above the 50 mark, the probability of the
market breaking out of the upper range of the ‘Channel’ i.e.
18886 / 5729 cannot be ruled out. In this scenario, we may
see a rally towards 18973 - 19138 / 5757 - 5816. A move
beyond 19138 / 5816 would attract immense optimism in
the market and as a result, the up move will get extended
towards 19542 - 19812 / 5850 - 5945 levels.
1
Daily Technical Report
October 29, 2012
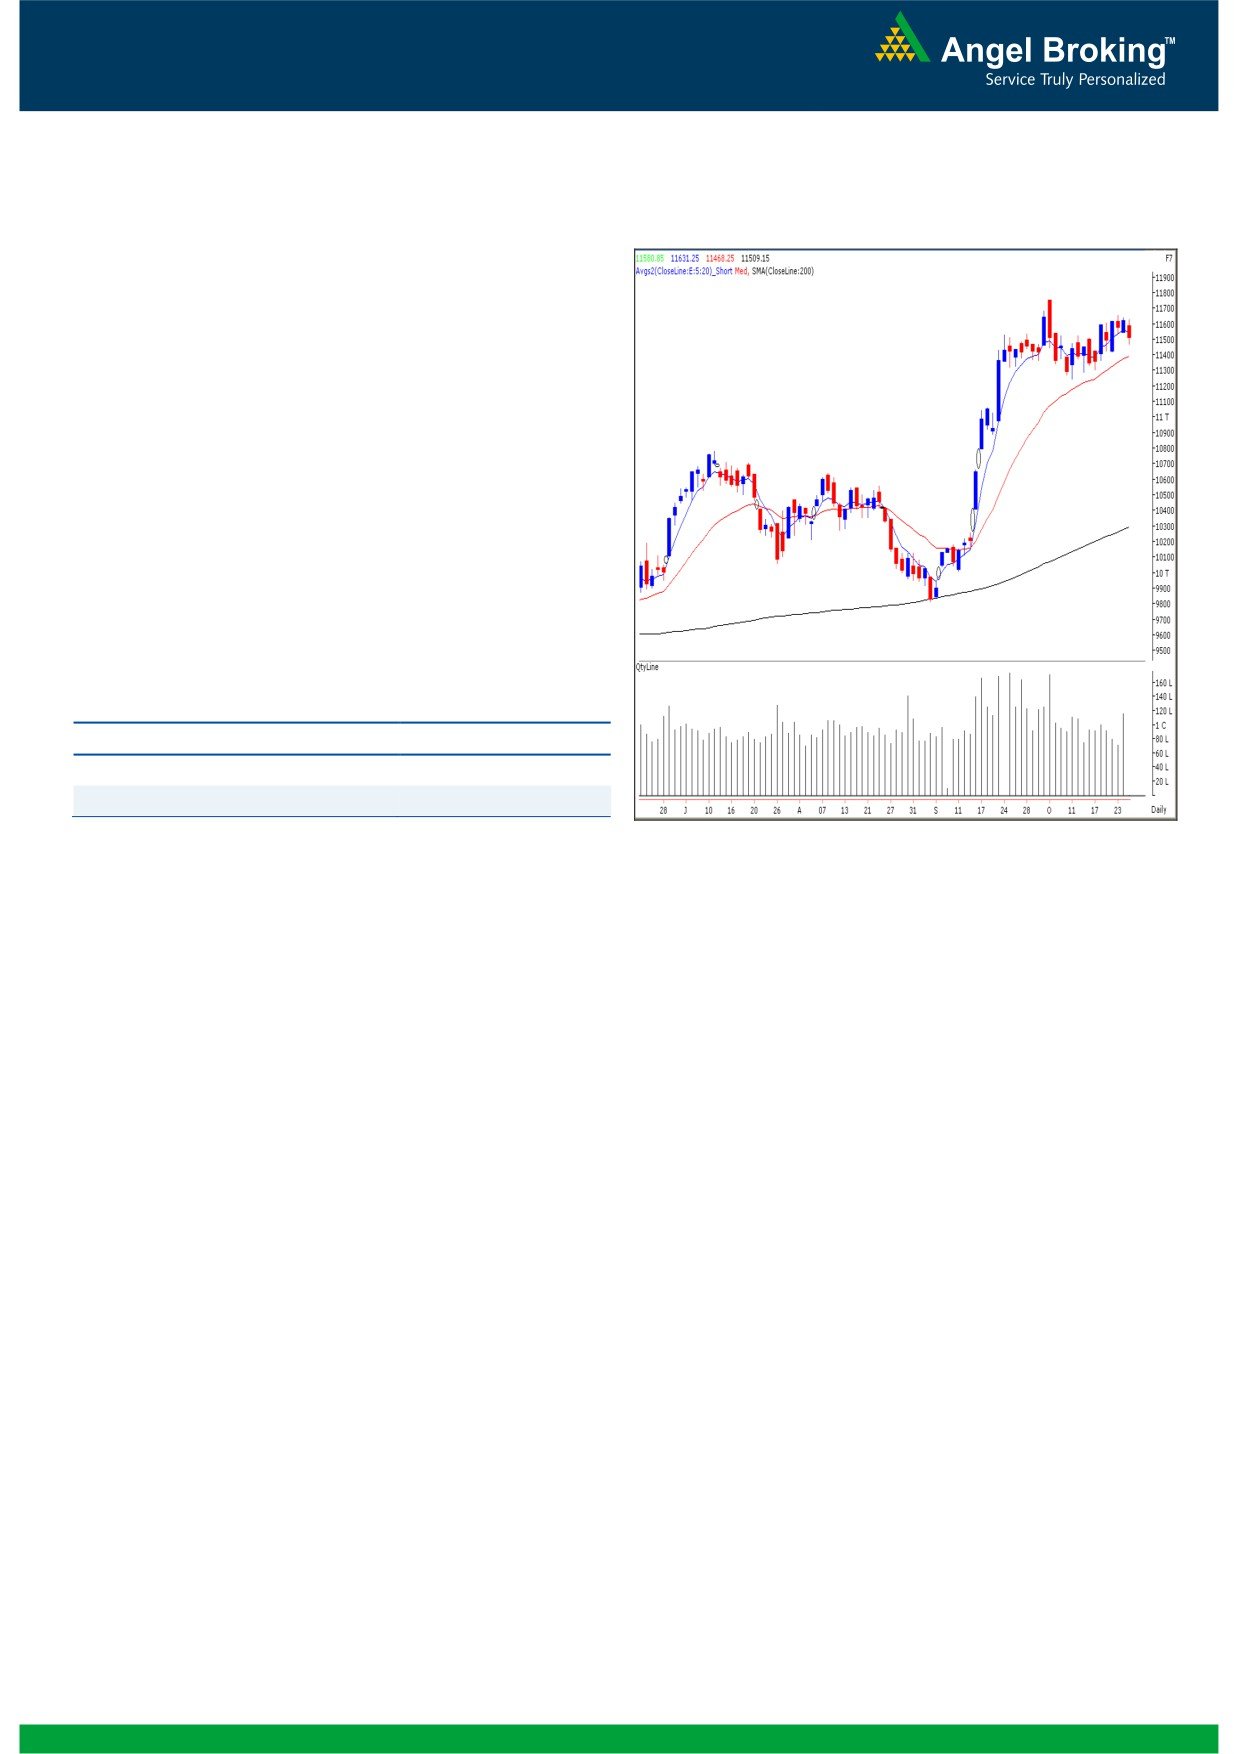
Exhibit 2: Bank Nifty Daily Chart
Bank Nifty Outlook - (11509)
On Friday, Bank Nifty opened on a flat note and dragged
lower to close with a loss of nearly 1%.However, in line
with our benchmark indices the index continued its
sideways trading activity in the mentioned range of 11745
- 11245. We are now witnessing a negative crossover in
momentum oscillator “Stochastic” on the daily chart. The
impact of this oscillator would be seen if the index sustains
below Friday’s low of 11468. In this scenario the index is
likely to drift towards 11419 - 11364 levels. On the
upside 11598 - 11643 levels are likely to act as resistance
for the day.
Actionable points:
View for the day
Bearish Below 11468
Expected Targets
11419 - 11364
Resistance Levels
11598 - 11643
Source: Falcon:
2
Daily Technical Report
October 29, 2012
Daily Pivot Levels for Nifty 50 Stocks
SCRIPS
S2
S1
PIVOT
R1
R2
SENSEX
18,466
18,546
18,638
18,717
18,809
NIFTY
5,612
5,638
5,668
5,694
5,723
BANKNIFTY
11,373
11,441
11,536
11,604
11,699
ACC
1,385
1,394
1,407
1,417
1,430
AMBUJACEM
202
205
207
210
213
ASIANPAINT
3,840
3,882
3,913
3,955
3,986
AXISBANK
1,210
1,221
1,233
1,244
1,257
BAJAJ-AUTO
1,730
1,759
1,777
1,806
1,824
BANKBARODA
751
757
766
772
781
BHARTIARTL
261
264
267
269
272
BHEL
234
238
242
246
249
BPCL
344
346
349
351
354
CAIRN
330
333
335
338
340
CIPLA
347
351
357
361
366
COALINDIA
351
353
355
357
359
DLF
198
201
203
205
208
DRREDDY
1,639
1,655
1,678
1,693
1,716
GAIL
355
360
363
367
371
GRASIM
3,368
3,389
3,411
3,433
3,455
HCLTECH
600
604
610
615
620
HDFC
744
751
759
766
773
HDFCBANK
627
632
636
641
645
HEROMOTOCO
1,780
1,825
1,850
1,895
1,920
HINDALCO
111
112
113
114
114
HINDUNILVR
535
544
556
565
578
ICICIBANK
1,058
1,068
1,085
1,096
1,113
IDFC
154
156
158
160
162
INFY
2,308
2,319
2,332
2,343
2,356
ITC
281
283
288
290
294
JINDALSTEL
376
381
385
390
394
JPASSOCIAT
87
89
92
94
97
KOTAKBANK
600
607
616
623
632
LT
1,679
1,694
1,704
1,719
1,728
LUPIN
555
560
566
572
578
M&M
849
865
875
891
901
MARUTI
1,350
1,358
1,368
1,376
1,386
NTPC
164
167
169
172
174
ONGC
271
273
275
276
278
PNB
708
729
766
786
823
POWERGRID
111
113
115
116
118
RANBAXY
514
520
526
532
538
RELIANCE
785
792
799
806
813
RELINFRA
481
486
493
497
504
SBIN
2,136
2,155
2,180
2,198
2,223
SESAGOA
166
168
169
171
173
SIEMENS
670
675
683
688
696
SUNPHARMA
677
681
687
691
697
TATAMOTORS
257
259
262
264
267
TATAPOWER
102
103
105
106
107
TATASTEEL
394
397
399
402
405
TCS
1,299
1,307
1,315
1,323
1,330
ULTRACEMCO
2,023
2,033
2,041
2,051
2,059
WIPRO
331
334
337
339
343
3
Daily Technical Report
October 29, 2012
Research Team Tel: 022 - 39357800
DISCLAIMER
This document is solely for the personal information of the recipient, and must not be singularly used as the basis of any investment
decision. Nothing in this document should be construed as investment or financial advice. Each recipient of this document should make
such investigations as they deem necessary to arrive at an independent evaluation of an investment in the securities of the companies
referred to in this document (including the merits and risks involved), and should consult their own advisors to determine the merits and
risks of such an investment.
Angel Broking Limited, its affiliates, directors, its proprietary trading and investment businesses may, from time to time, make
investment decisions that are inconsistent with or contradictory to the recommendations expressed herein. The views contained in this
document are those of the analyst, and the company may or may not subscribe to all the views expressed within.
Reports based on technical and derivative analysis center on studying charts of a stock's price movement, outstanding positions and
trading volume, as opposed to focusing on a company's fundamentals and, as such, may not match with a report on a company's
fundamentals.
The information in this document has been printed on the basis of publicly available information, internal data and other reliable
sources believed to be true, but we do not represent that it is accurate or complete and it should not be relied on as such, as this
document is for general guidance only. Angel Broking Limited or any of its affiliates/ group companies shall not be in any way
responsible for any loss or damage that may arise to any person from any inadvertent error in the information contained in this report.
Angel Broking Limited has not independently verified all the information contained within this document. Accordingly, we cannot testify,
nor make any representation or warranty, express or implied, to the accuracy, contents or data contained within this document. While
Angel Broking Limited endeavours to update on a reasonable basis the information discussed in this material, there may be regulatory,
compliance, or other reasons that prevent us from doing so.
This document is being supplied to you solely for your information, and its contents, information or data may not be reproduced,
redistributed or passed on, directly or indirectly.
Angel Broking Limited and its affiliates may seek to provide or have engaged in providing corporate finance, investment banking or
other advisory services in a merger or specific transaction to the companies referred to in this report, as on the date of this report or in
the past.
Neither Angel Broking Limited, nor its directors, employees or affiliates shall be liable for any loss or damage that may arise from or in
connection with the use of this information.
Note: Please refer to the important `Stock Holding Disclosure' report on the Angel website (Research Section). Also, please refer to the
latest update on respective stocks for the disclosure status in respect of those stocks. Angel Broking Limited and its affiliates may have
investment positions in the stocks recommended in this report.
Research Team
Shardul Kulkarni
-
Head - Technicals
Sameet Chavan
-
Technical Analyst
Sacchitanand Uttekar
-
Technical Analyst
Mehul Kothari
-
Technical Analyst
Ankur Lakhotia
-
Technical Analyst
Angel Broking Pvt. Ltd.
Registered Office: G-1, Ackruti Trade Centre, Rd. No. 7, MIDC, Andheri (E), Mumbai - 400 093.
Corporate Office: 6th Floor, Ackruti Star, MIDC, Andheri (E), Mumbai - 400 093. Tel: (022) 3952 6600
Sebi Registration No: INB 010996539
4