Daily Technical Report
April 29, 2013
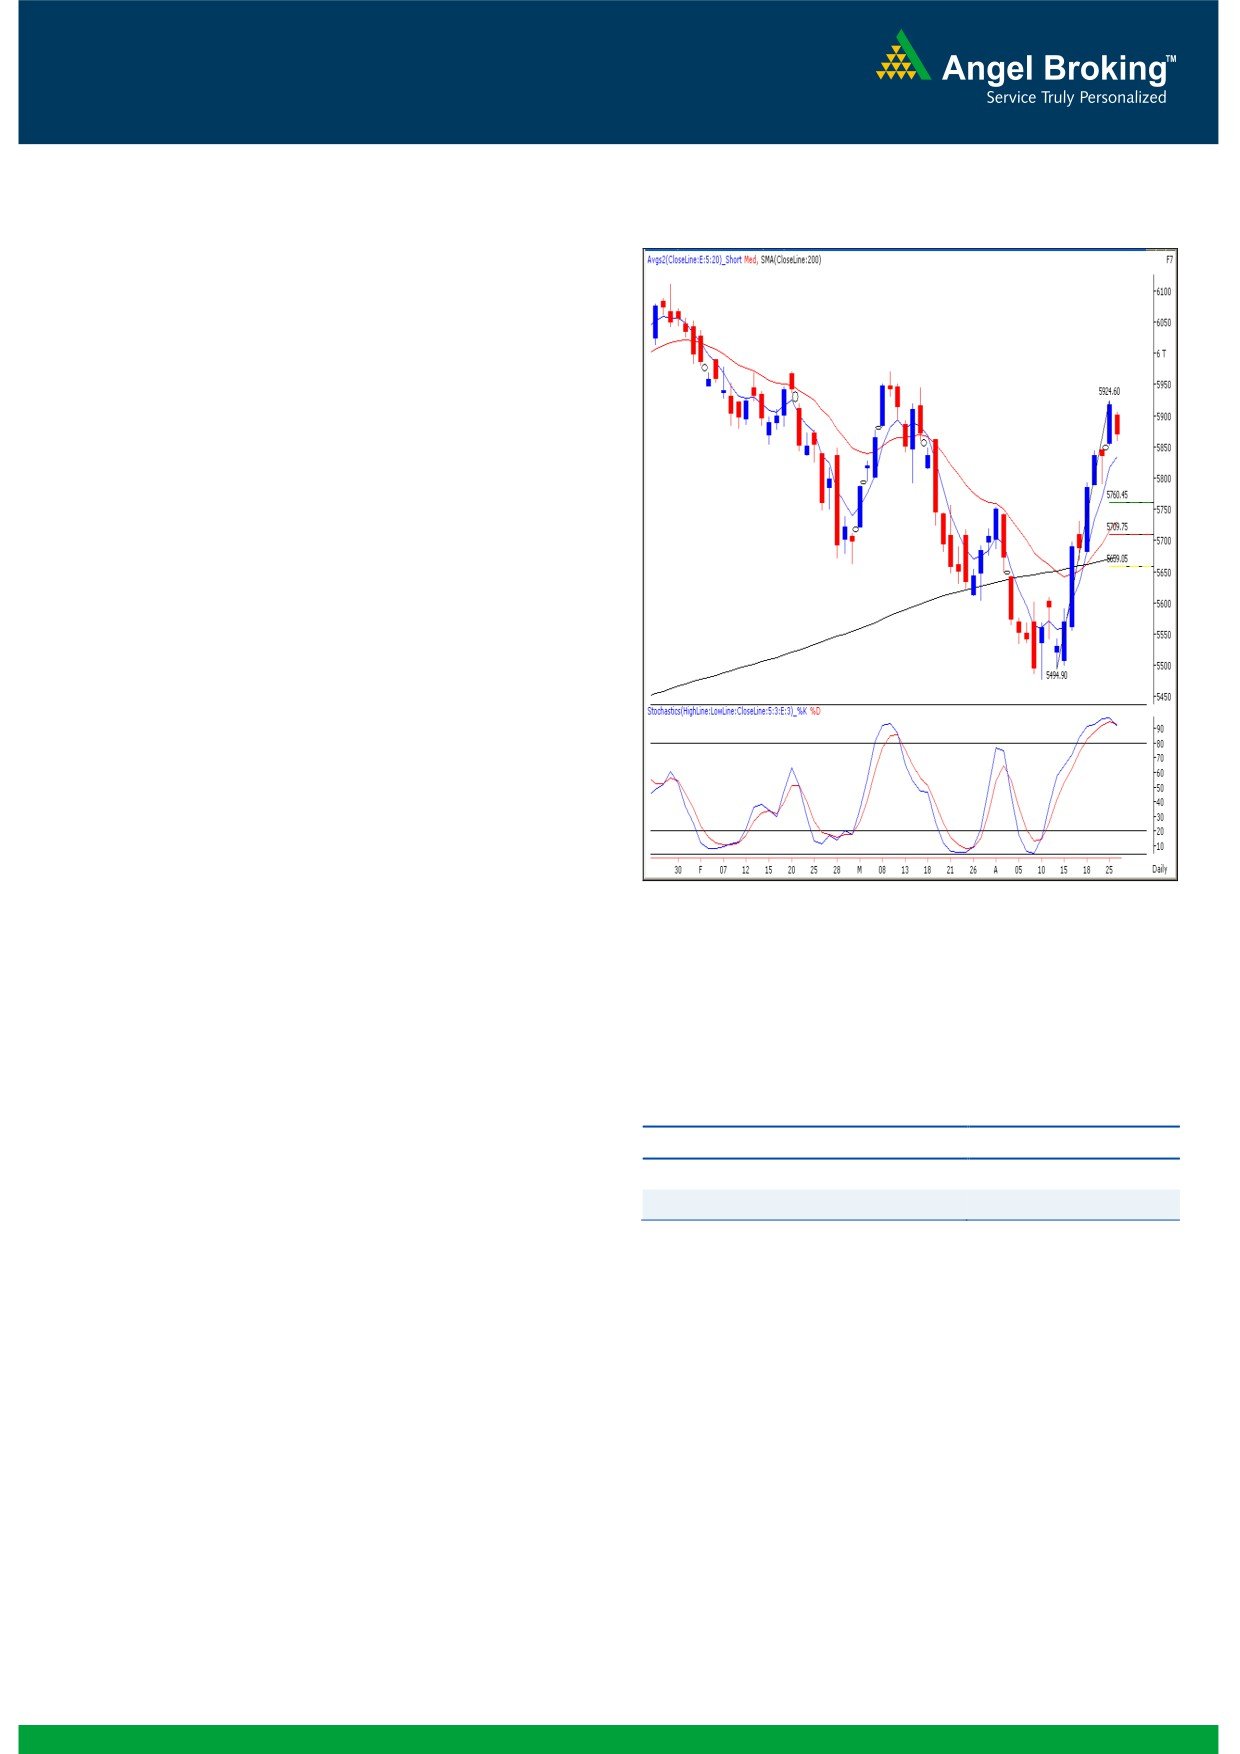
Exhibit 1: Sensex Daily Chart
Sensex (19287) / NIFTY (5871)
On Friday, indices opened on a flat note and thereafter
traded with a negative bias to close with a loss of 0.76%.
For the session most of the sectors ended in the red,
amongst which Realty, Oil & Gas and IT were among the
major losers, whereas Auto and Capital Goods counters
ended with gains. The advance to decline ratio was in
strongly in favor of declining counters (A=949 D=1356)
Formation
The ’20-week EMA’ and the ’20-day EMA’ are placed at
19038/ 5767 and 18902/ 5730 levels, respectively.
The ’89-day EMA’ and the ‘200-day SMA’ are placed at
19063/ 5773 and 18710 / 5673, respectively.
The ‘Lower Top - Lower Bottom’ formation on the weekly
chart is still intact.
The weekly momentum oscillators, ADX (9) indicator and
‘3 & 8 EMA’ are signaling a positive crossover.
Source: Falcon:
The 61.8% and 78.6% Fibonacci retracement levels of
the fall from 20204 / 6112 to 18144 / 5477 are placed
at 19416 / 5870 and 19765 / 5976.
Actionable points:
Trading strategy:
The benchmark Indices have moved well during the week
View
Bearish Below 5860
and have now tested the 61.80% Fibonacci retracement level
Expected Target
5820 - 5791
(19416 / 5870) of the fall from 20204 / 6112 to 18144 /
Resistance Levels
5900 - 5925
5477. On the weekly chart, we are observing that the
momentum oscillators. ADX (9) indicators and ‘3 & 8 EMA’
Hence, any sustainable move below 19192 / 5853 would
are positively poised. Any sustainable move beyond this
result in a near term loss of optimism. In this scenario,
week’s high of 19435 / 5925 would in turn push the indices
indices may correct towards 18941 / 5760 and 18790 /
towards the 78.60% Fibonacci retracement level placed at
5710, which are 38.20% and 50% Fibonacci retracement
19762 / 5976. On the flipside, the price action seen in the
levels of the rise from 18144 / 5495 to 19435 / 5925,
last trading session of the week can be termed as an ‘Inside
respectively.
Day’ pattern. This candlestick formation occurs when the
The ECB Governing Council meeting and the RBI Monetary
entire price range of a given day falls within the price range
Policy are scheduled to be declared in the coming week and
of the previous day. The pattern is often used to signal the
thus volatility may increase significantly in the coming
indecisiveness because neither the bulls nor the bears are
sessions. We thus advise traders to trade with strict stop
able to send the price beyond the range of the previous day.
losses and avoid taking undue risks.
The said pattern will be confirmed below Thursday’s low of
19192 / 5853. This is also supported by the negative
placement of daily ‘Stochastic’ oscillator.
1
Daily Technical Report
April 29, 2013
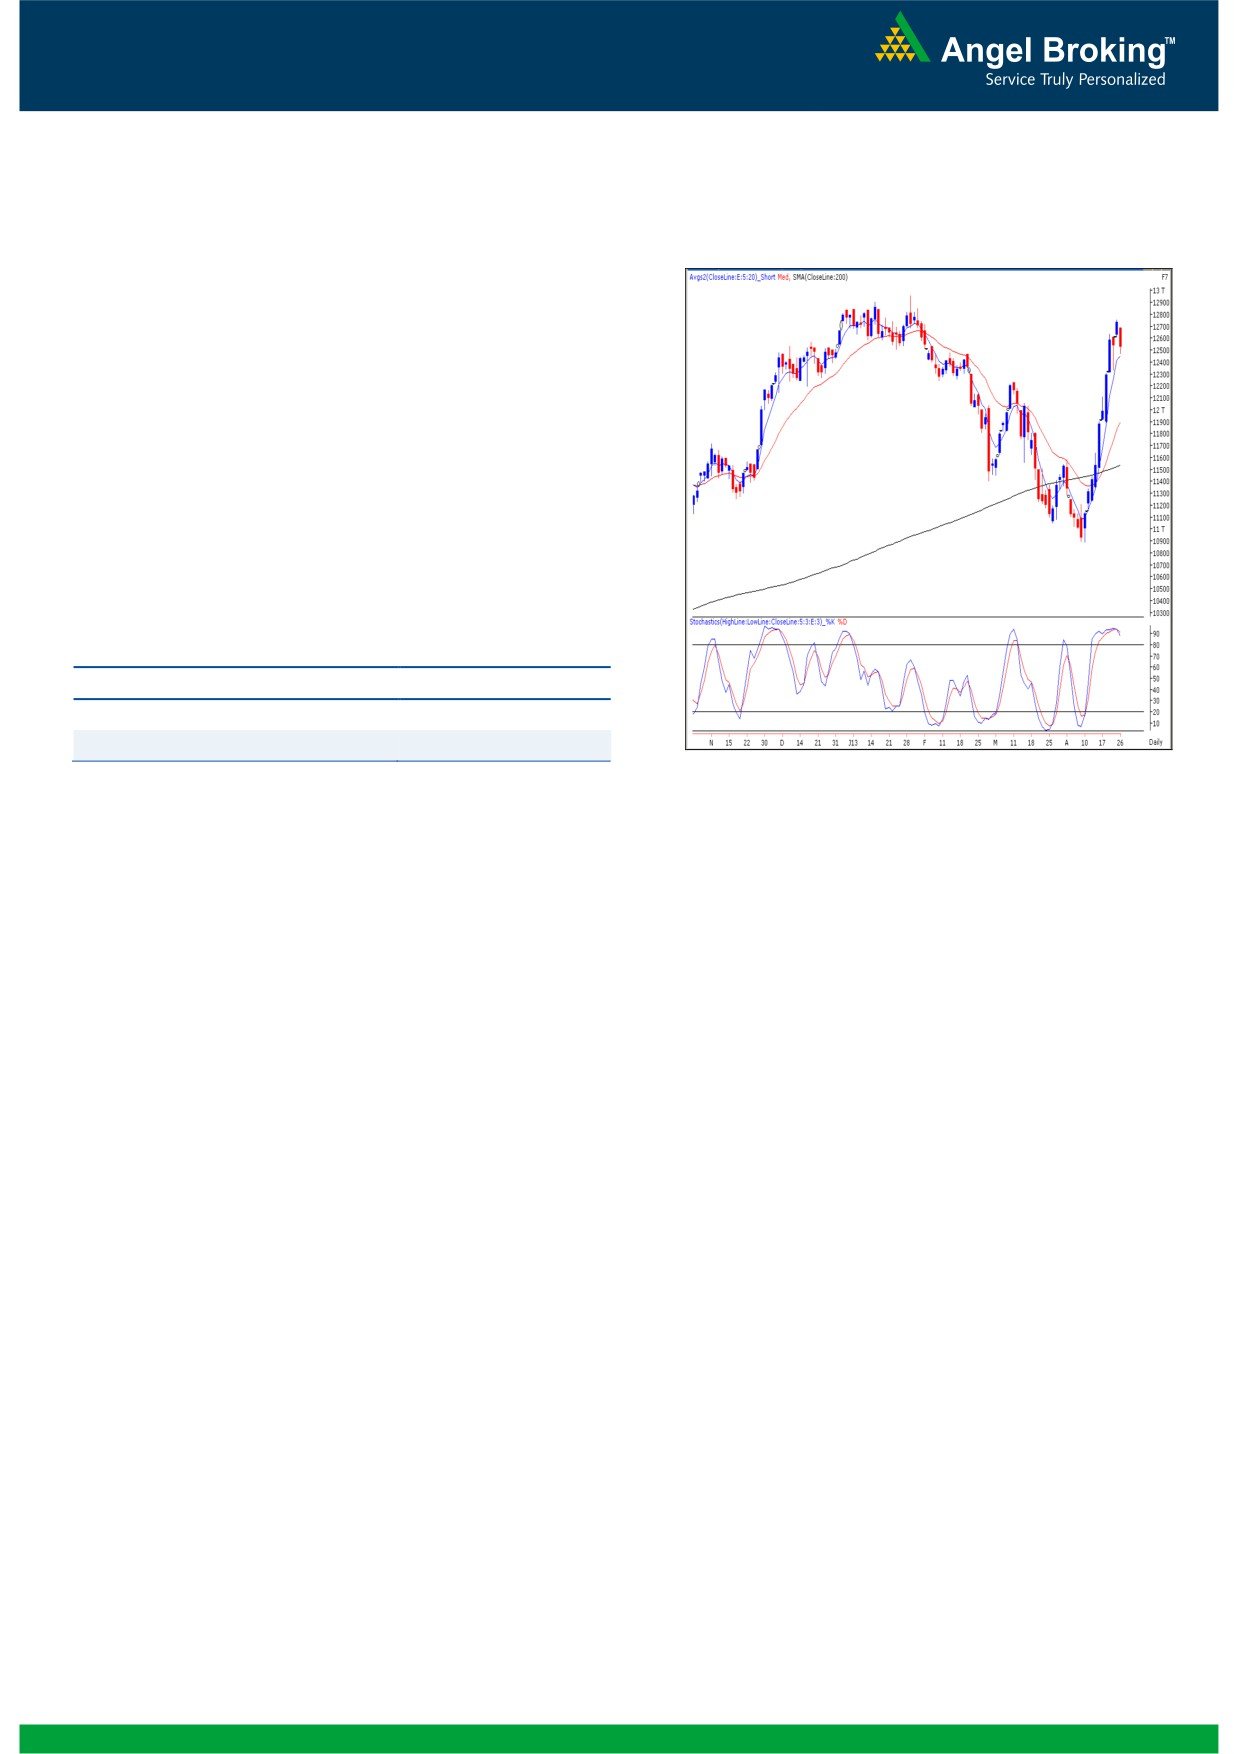
Exhibit 2: Bank Nifty Daily Chart
Bank Nifty Outlook - (12533)
On Friday, Bank Nifty opened on a pessimistic note and
traded volatile throughout the session to close with a loss of
1.52%. The index has closed near the critical level of 11535.
The negative divergence in the momentum oscillator ‘RSI’ on
the hourly chart is still intact. Hence we believe that going
forward the index is likely to correct if it sustains below
Friday’s low of 12470. In this case the Bank Nifty is likely to
drift lower towards 12330 - 12262 levels. On the upside
12680 - 12756 levels are likely to act as resistance for the
day.
Actionable points:
View
Bearish Below 12470
Expected Target
12330- 12262
Resistance level
12680 - 12756
Source: Falcon:
2
Daily Technical Report
April 29, 2013
Daily Pivot Levels for Nifty 50 Stocks
SCRIPS
S2
S1
PIVOT
R1
R2
SENSEX
19,172
19,229
19,307
19,365
19,442
NIFTY
5,833
5,852
5,880
5,899
5,926
BANKNIFTY
12,352
12,442
12,561
12,652
12,770
ACC
1,223
1,235
1,250
1,262
1,276
AMBUJACEM
183
185
189
191
195
ASIANPAINT
4,635
4,670
4,727
4,763
4,820
AXISBANK
1,452
1,469
1,484
1,502
1,517
BAJAJ-AUTO
1,805
1,850
1,878
1,923
1,950
BANKBARODA
683
690
700
707
717
BHARTIARTL
304
311
316
323
328
BHEL
185
187
190
191
194
BPCL
405
409
414
418
423
CAIRN
295
298
300
303
305
CIPLA
403
407
409
413
416
COALINDIA
310
315
319
324
329
DLF
229
234
241
245
252
DRREDDY
1,955
1,973
1,991
2,009
2,028
GAIL
338
344
349
355
360
GRASIM
2,845
2,881
2,936
2,972
3,028
HCLTECH
653
669
693
708
733
HDFC
848
861
870
882
891
HDFCBANK
679
684
688
693
697
HEROMOTOCO
1,537
1,567
1,606
1,636
1,675
HINDALCO
97
98
99
100
101
HINDUNILVR
454
459
468
474
483
ICICIBANK
1,089
1,117
1,153
1,181
1,217
IDFC
151
153
156
158
161
INDUSINDBK
445
452
460
466
474
INFY
2,182
2,197
2,217
2,232
2,253
ITC
315
317
318
320
322
JINDALSTEL
305
310
318
323
330
JPASSOCIAT
72
74
76
77
79
KOTAKBANK
688
700
708
721
729
LT
1,490
1,515
1,531
1,556
1,571
LUPIN
672
679
686
692
699
M&M
868
879
892
903
917
MARUTI
1,519
1,596
1,645
1,722
1,770
NMDC
124
125
127
128
130
NTPC
151
153
155
157
160
ONGC
318
321
326
329
334
PNB
760
766
776
782
791
POWERGRID
109
110
110
111
111
RANBAXY
452
456
461
464
470
RELIANCE
767
780
802
815
838
RELINFRA
352
359
371
378
390
SBIN
2,242
2,265
2,300
2,323
2,357
SESAGOA
149
151
153
155
158
SUNPHARMA
941
949
962
969
982
TATAMOTORS
287
292
295
299
303
TATAPOWER
94
94
95
96
97
TATASTEEL
296
301
309
313
321
TCS
1,348
1,358
1,376
1,387
1,404
ULTRACEMCO
1,855
1,881
1,908
1,935
1,962
3
Daily Technical Report
April 29, 2013
Research Team Tel: 022 - 30940000
DISCLAIMER
This document is solely for the personal information of the recipient, and must not be singularly used as the basis of any investment
decision. Nothing in this document should be construed as investment or financial advice. Each recipient of this document should make
such investigations as they deem necessary to arrive at an independent evaluation of an investment in the securities of the companies
referred to in this document (including the merits and risks involved), and should consult their own advisors to determine the merits and
risks of such an investment.
Angel Broking Limited, its affiliates, directors, its proprietary trading and investment businesses may, from time to time, make
investment decisions that are inconsistent with or contradictory to the recommendations expressed herein. The views contained in this
document are those of the analyst, and the company may or may not subscribe to all the views expressed within.
Reports based on technical and derivative analysis center on studying charts of a stock's price movement, outstanding positions and
trading volume, as opposed to focusing on a company's fundamentals and, as such, may not match with a report on a company's
fundamentals.
The information in this document has been printed on the basis of publicly available information, internal data and other reliable
sources believed to be true, but we do not represent that it is accurate or complete and it should not be relied on as such, as this
document is for general guidance only. Angel Broking Limited or any of its affiliates/ group companies shall not be in any way
responsible for any loss or damage that may arise to any person from any inadvertent error in the information contained in this report.
Angel Broking Limited has not independently verified all the information contained within this document. Accordingly, we cannot testify,
nor make any representation or warranty, express or implied, to the accuracy, contents or data contained within this document. While
Angel Broking Limited endeavors to update on a reasonable basis the information discussed in this material, there may be regulatory,
compliance, or other reasons that prevent us from doing so.
This document is being supplied to you solely for your information, and its contents, information or data may not be reproduced,
redistributed or passed on, directly or indirectly.
Angel Broking Limited and its affiliates may seek to provide or have engaged in providing corporate finance, investment banking or
other advisory services in a merger or specific transaction to the companies referred to in this report, as on the date of this report or in
the past.
Neither Angel Broking Limited, nor its directors, employees or affiliates shall be liable for any loss or damage that may arise from or in
connection with the use of this information.
Note: Please refer to the important `Stock Holding Disclosure' report on the Angel website (Research Section). Also, please refer to the
latest update on respective stocks for the disclosure status in respect of those stocks. Angel Broking Limited and its affiliates may have
investment positions in the stocks recommended in this report.
Research Team
Shardul Kulkarni
-
Head - Technicals
Sameet Chavan
-
Technical Analyst
Sacchitanand Uttekar
-
Technical Analyst
Ankur Lakhotia
-
Technical Analyst
Angel Broking Pvt. Ltd.
Registered Office: G-1, Ackruti Trade Centre, Rd. No. 7, MIDC, Andheri (E), Mumbai - 400 093.
Corporate Office: 6th Floor, Ackruti Star, MIDC, Andheri (E), Mumbai - 400 093. Tel: (022) 30940000
Sebi Registration No: INB 010996539
4