Daily Technical Report
March 28, 2013
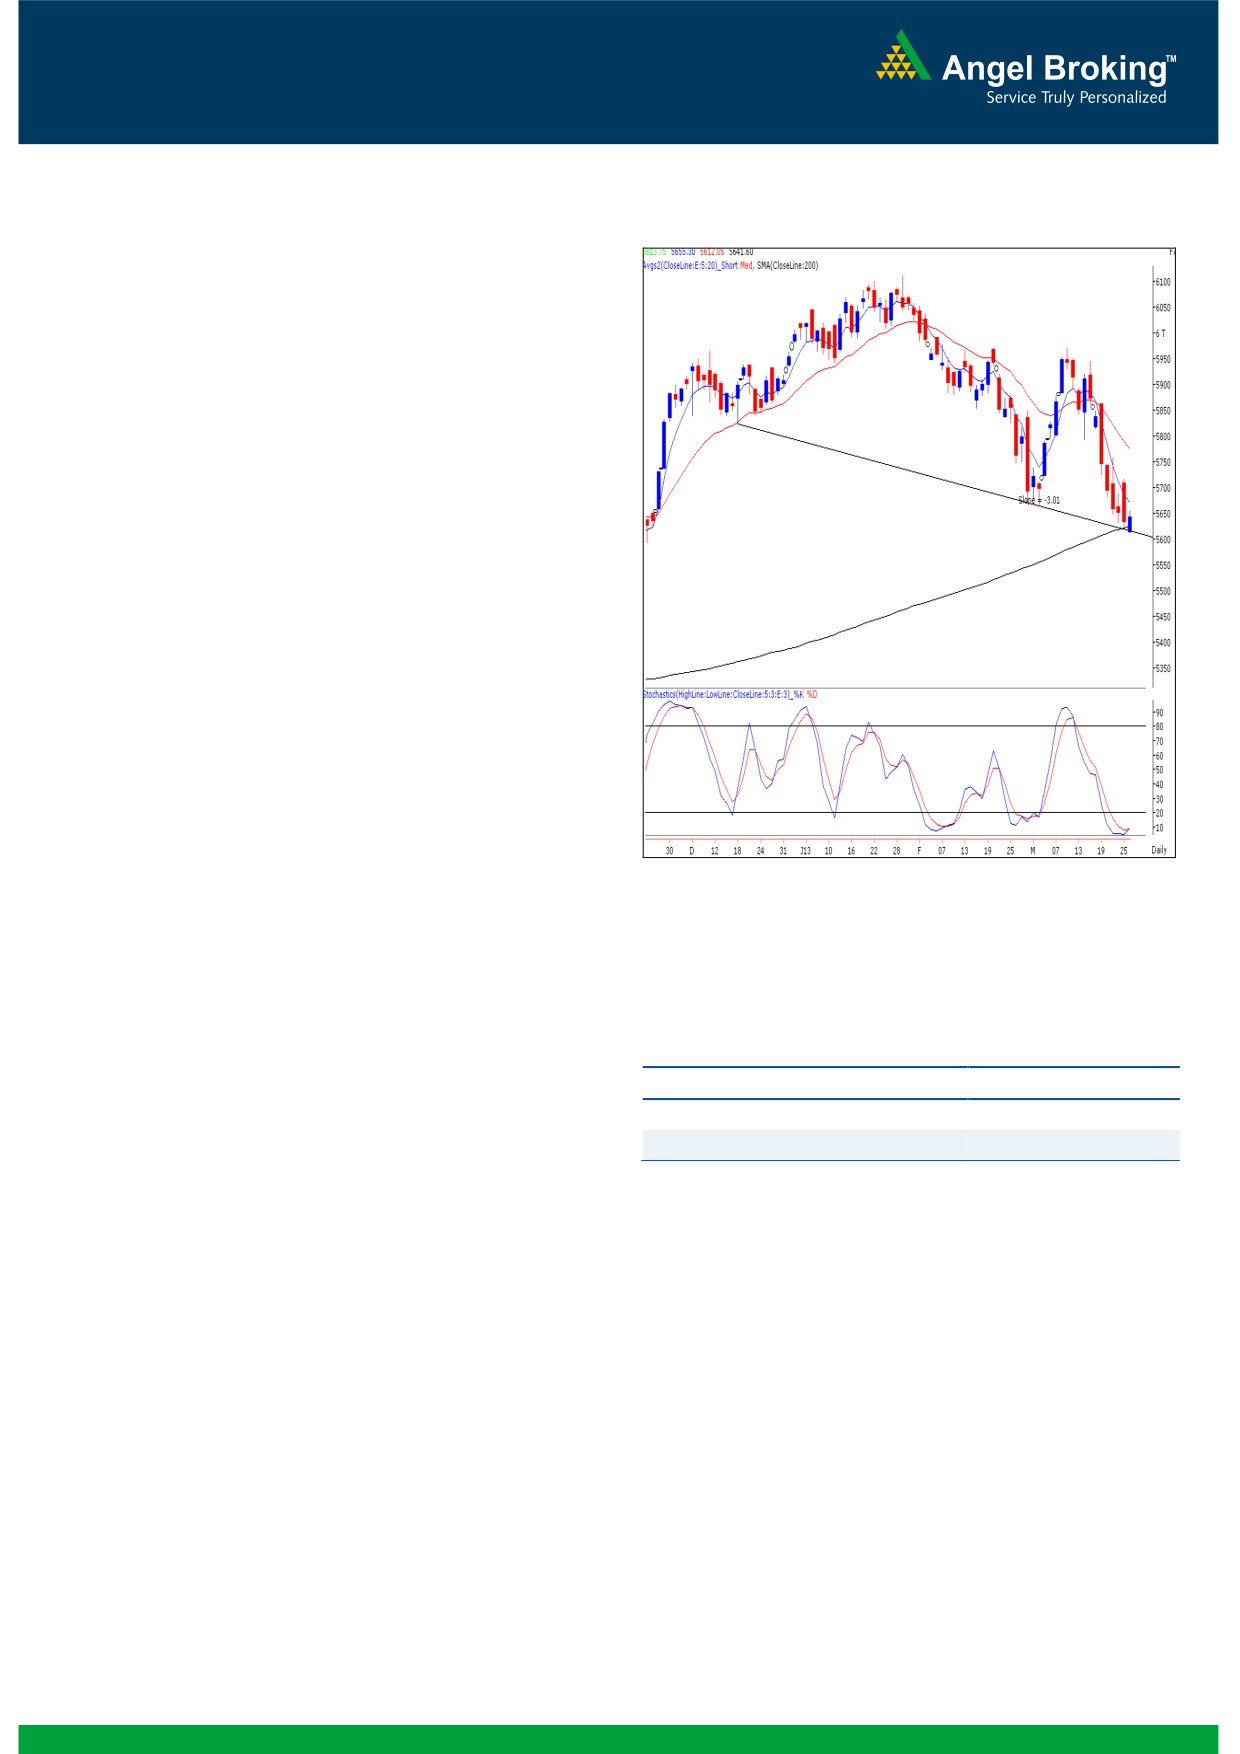
Exhibit 1: Nifty Daily Chart
Sensex (18705) / NIFTY (5642)
On Tuesday, our benchmark indices opened lower in-line
with weak global cues. Subsequently, indices traded within
the narrow range throughout the session and eventually
closed marginally in the positive territory. The Oil & Gas,
Realty and Capital Goods counters were among the major
losers whereas Consumer Durables, FMCG and Teck stocks
ended with some gains. The advance to decline ratio was in
favor of declining counters (A=1290 D=1459) (Source-
Formation
The ’20-day EMA’ and the ’20-week EMA’ are placed at
19121 / 5775 and 19146 / 5796 levels, respectively.
The ‘200 Day SMA’ is placed at 18536 / 5621.
The ‘Lower Top Lower Bottom’ formation on weekly
chart is confirmed for the first time after January 14,
2011.
Source: Falcon:
We are witnessing a ‘Downward Sloping’ trend line
support drawn by joining the lows of December 18,
2012 and March 04, 2013.
Actionable points:
Trading strategy:
Indices opened lower and precisely tested the mentioned
View
Neutral
'Downward Sloping Trend Line' for yet another session. As
Resistance levels
5655 - 5720
expected, indices found decent support near this trend line
Support levels
5612 - 5593
and bounced back from the lows to close marginally on the
higher side. The daily 'Stochastic' oscillator is placed well
inside the oversold territory and now signaling a positive
crossover. Hence, going forward, we may witness a bounce
back once indices sustain above Tuesday's high of 18759 /
5655. In this case, indices may bounce towards 18875 -
18950 / 5695 - 5720 levels. On the flip side Tuesday's low
of 18612 / 5612 may provide decent support for the market.
Traders are advised to remain cautious and place strict stop
losses as the March derivative expiry may spring up some
surprising moves in the index.
1
Daily Technical Report
March 28, 2013
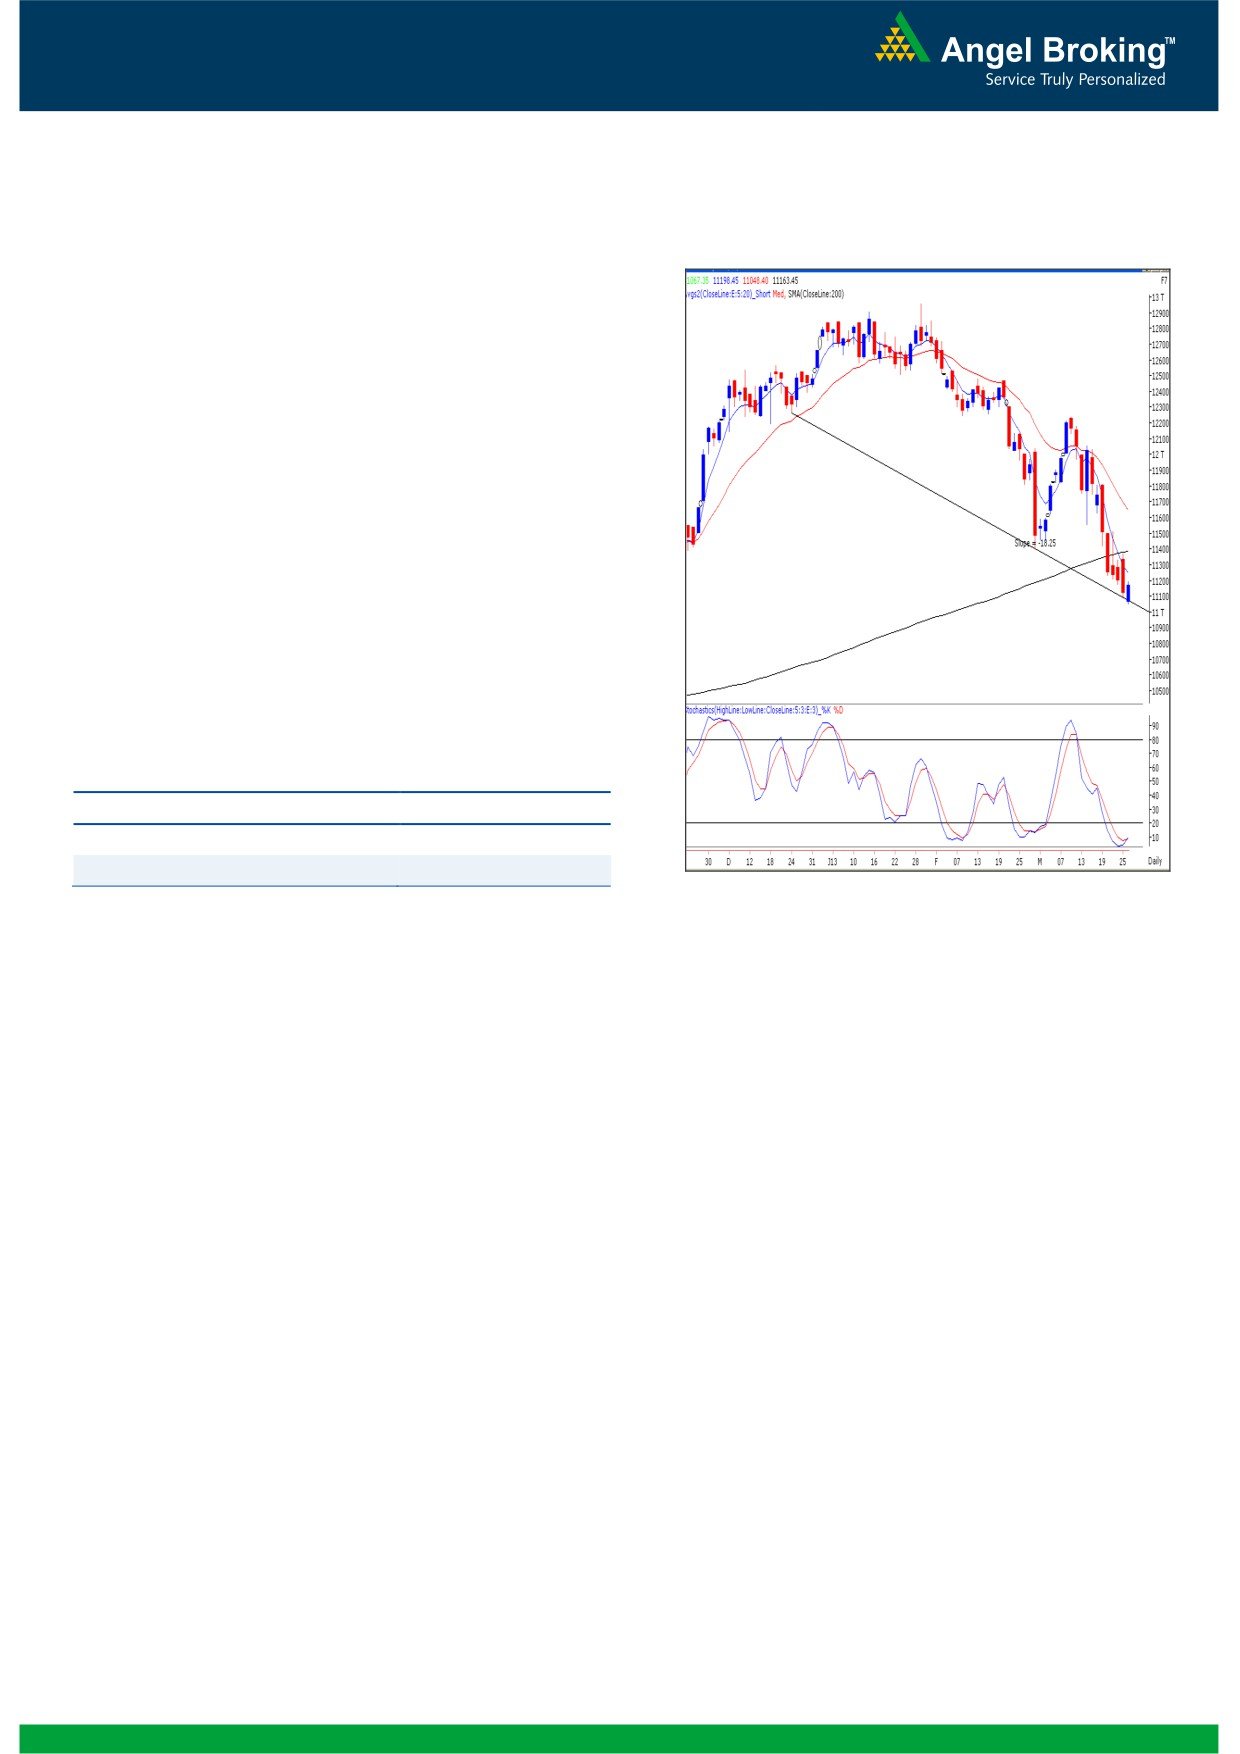
Exhibit 2: Bank Nifty Daily Chart
Bank Nifty Outlook - (11163)
On Tuesday, Bank Nifty opened with a downside gap in
line with our benchmark indices and traded in a narrow
range throughout the session. At this juncture the index is
hovering around the trend line support formed by joining
the significant lows of December 24, 2012 and February
28, 2013. The positive divergence in ‘RSI’ momentum
oscillator on the daily and hourly chart mentioned in our
previous report is still intact. Therefore traders are advised
to refrain from creating fresh short positions in the index.
The coming session is likely to be highly volatile on
account of derivatives expiry and hence traders are
advised to avoid taking undue risk. For the day
11021 -
10940 levels are likely to act as support and 11347 -
11373 levels are likely to act as resistance for the day.
Actionable points:
View
Neutral
Resistance Levels
11347 - 11373
Support Level
11021 - 10940
Source: Falcon:
2
Daily Technical Report
March 28, 2013
Research Team Tel: 022 - 30940000
DISCLAIMER
This document is solely for the personal information of the recipient, and must not be singularly used as the basis of any investment
decision. Nothing in this document should be construed as investment or financial advice. Each recipient of this document should make
such investigations as they deem necessary to arrive at an independent evaluation of an investment in the securities of the companies
referred to in this document (including the merits and risks involved), and should consult their own advisors to determine the merits and
risks of such an investment.
Angel Broking Limited, its affiliates, directors, its proprietary trading and investment businesses may, from time to time, make
investment decisions that are inconsistent with or contradictory to the recommendations expressed herein. The views contained in this
document are those of the analyst, and the company may or may not subscribe to all the views expressed within.
Reports based on technical and derivative analysis center on studying charts of a stock's price movement, outstanding positions and
trading volume, as opposed to focusing on a company's fundamentals and, as such, may not match with a report on a company's
fundamentals.
The information in this document has been printed on the basis of publicly available information, internal data and other reliable
sources believed to be true, but we do not represent that it is accurate or complete and it should not be relied on as such, as this
document is for general guidance only. Angel Broking Limited or any of its affiliates/ group companies shall not be in any way
responsible for any loss or damage that may arise to any person from any inadvertent error in the information contained in this report.
Angel Broking Limited has not independently verified all the information contained within this document. Accordingly, we cannot testify,
nor make any representation or warranty, express or implied, to the accuracy, contents or data contained within this document. While
Angel Broking Limited endeavors to update on a reasonable basis the information discussed in this material, there may be regulatory,
compliance, or other reasons that prevent us from doing so.
This document is being supplied to you solely for your information, and its contents, information or data may not be reproduced,
redistributed or passed on, directly or indirectly.
Angel Broking Limited and its affiliates may seek to provide or have engaged in providing corporate finance, investment banking or
other advisory services in a merger or specific transaction to the companies referred to in this report, as on the date of this report or in
the past.
Neither Angel Broking Limited, nor its directors, employees or affiliates shall be liable for any loss or damage that may arise from or in
connection with the use of this information.
Note: Please refer to the important `Stock Holding Disclosure' report on the Angel website (Research Section). Also, please refer to the
latest update on respective stocks for the disclosure status in respect of those stocks. Angel Broking Limited and its affiliates may have
investment positions in the stocks recommended in this report.
Research Team
Shardul Kulkarni
-
Head - Technicals
Sameet Chavan
-
Technical Analyst
Sacchitanand Uttekar
-
Technical Analyst
Ankur Lakhotia
-
Technical Analyst
Angel Broking Pvt. Ltd.
Registered Office: G-1, Ackruti Trade Centre, Rd. No. 7, MIDC, Andheri (E), Mumbai - 400 093.
Corporate Office: 6th Floor, Ackruti Star, MIDC, Andheri (E), Mumbai - 400 093. Tel: (022) 30940000
Sebi Registration No: INB 010996539
4