Daily Technical Report
February 28, 2013
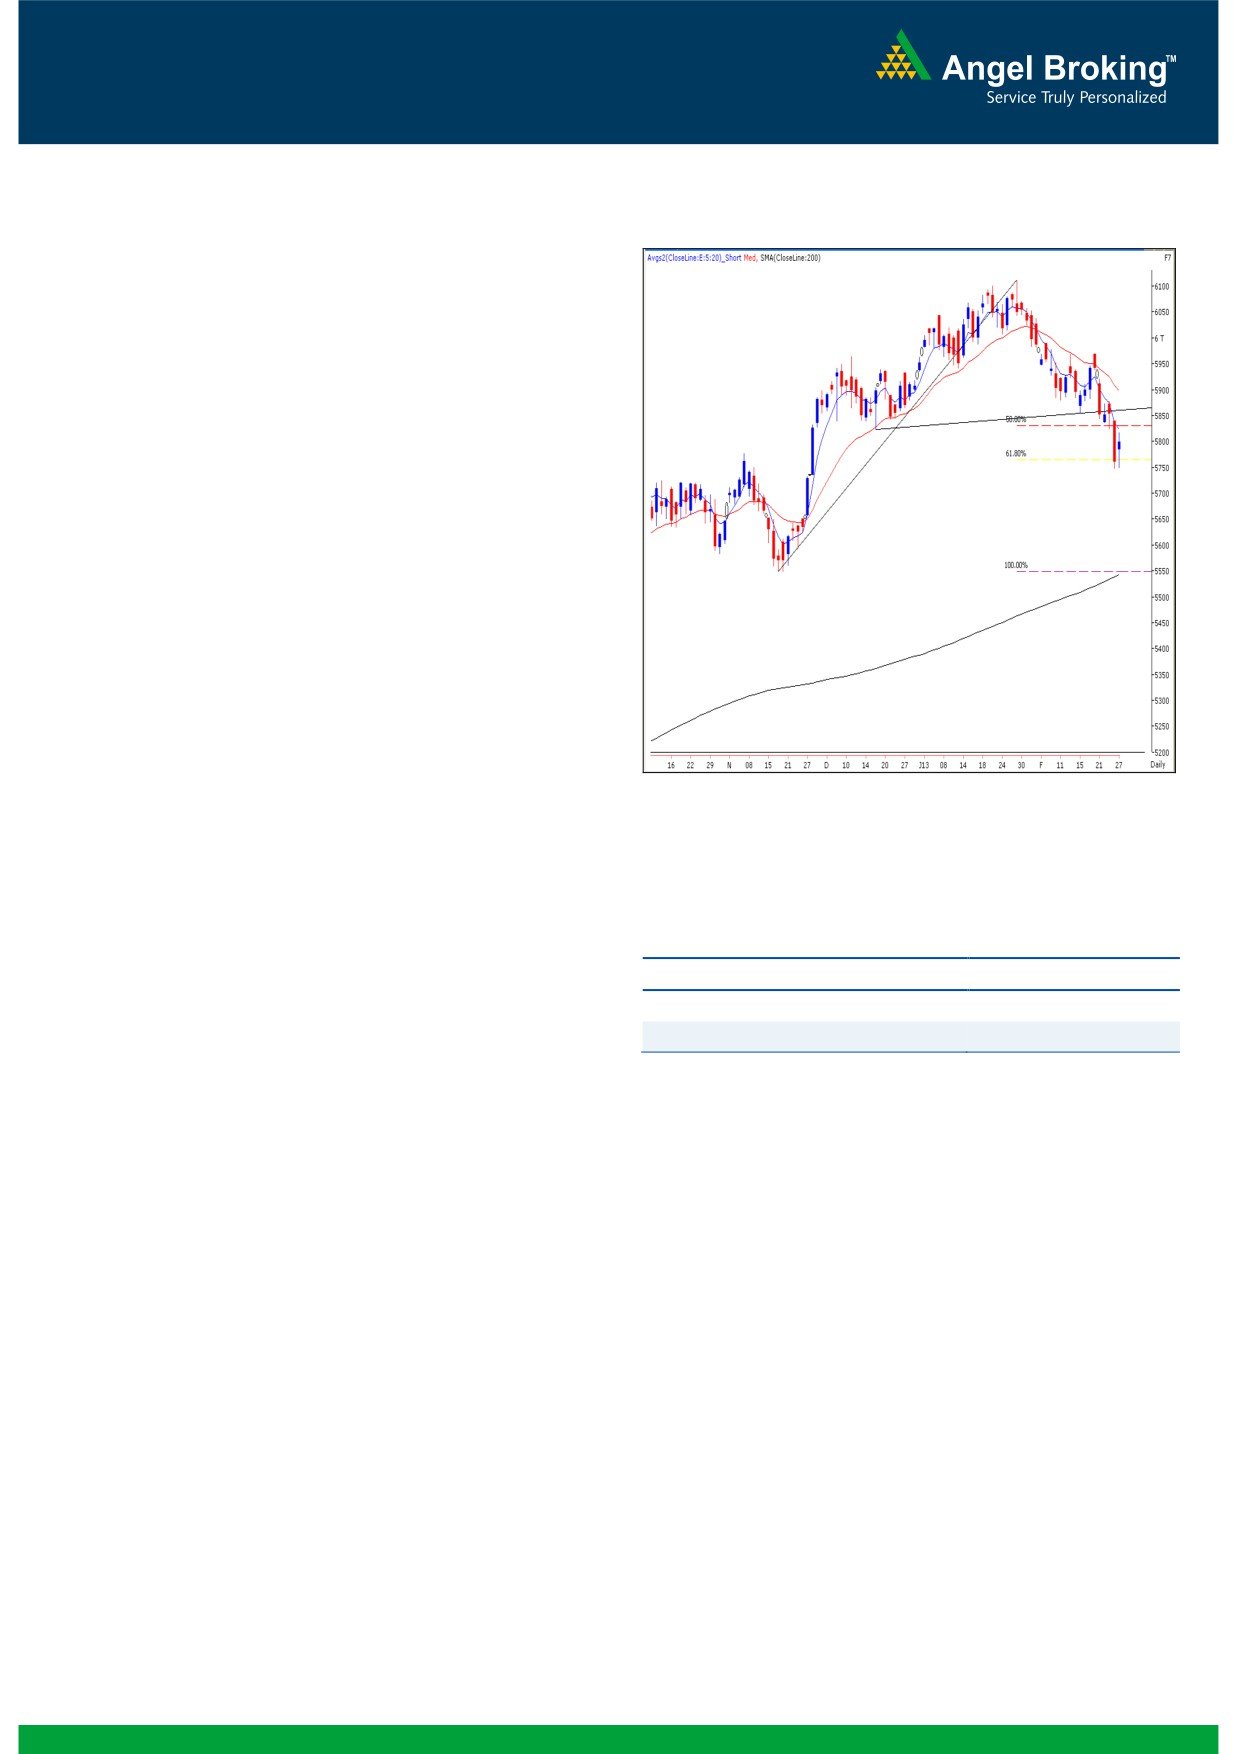
Exhibit 1: Nifty Daily Chart
Sensex (19152) / NIFTY (5797)
Yesterday's trading session opened higher as suggested by
the SGX Nifty and a strong up move post midsession led
indices to close well inside the positive territory. During the
day, most of the sectors ended on a gaining side except for
IT and Teck counters. It was evident that traders did not want
to go into the Budget session with heavy positions and some
degree of short covering was seen in major index counters.
The advance to decline ratio was marginally in favor of
advancing counters (A=1441 D=1359) (Source
-
Formation
The ’20-day EMA’ and the ’20-week EMA’ are placed at
19514 / 5898 and 19203 / 5820 levels, respectively.
The Nifty has broken down from the ‘Upward Sloping
Trend Line’ (as shown in the chart).
Source: Falcon:
The weekly ‘RSI Smoothened’ and ‘3 & 8 EMA’ are
signaling a negative crossover.
Actionable points:
Trading strategy:
View
SELL BELOW 5748
Despite positive opening indices were struggling at higher
Expected target
5700 - 5650
level during the initial hour of the trade. However, post
Resistance levels
5839 - 5875
midsession, we witnessed a bounce which led indices to close
in the positive territory. Yesterday's movement was within
Tuesday’s price range and has thus led to the formation of
an ‘Inside day’ Japanese candlestick pattern. Hence, we
continue to mention that Tuesday’s high of 19294 / 5839
would act as an immediate resistance in the coming trading
sessions. Only a sustainable move beyond this level would
push indices higher to test 19514 - 19620 / 5900 - 5938.
On the flipside, 18976 / 5748 remains to be a crucial
support level for the market. A violation of this level may
trigger strong pessimism and lead to fall towards 18850 -
18600 / 5700 - 5650 levels.
The coming trading session is likely to trade with high
volatility on account of announcement of Union Budget 2013
and derivatives expiry. Hence, we advise traders to remain
light on positions and avoid taking undue risks.
1
Daily Technical Report
February 28, 2013
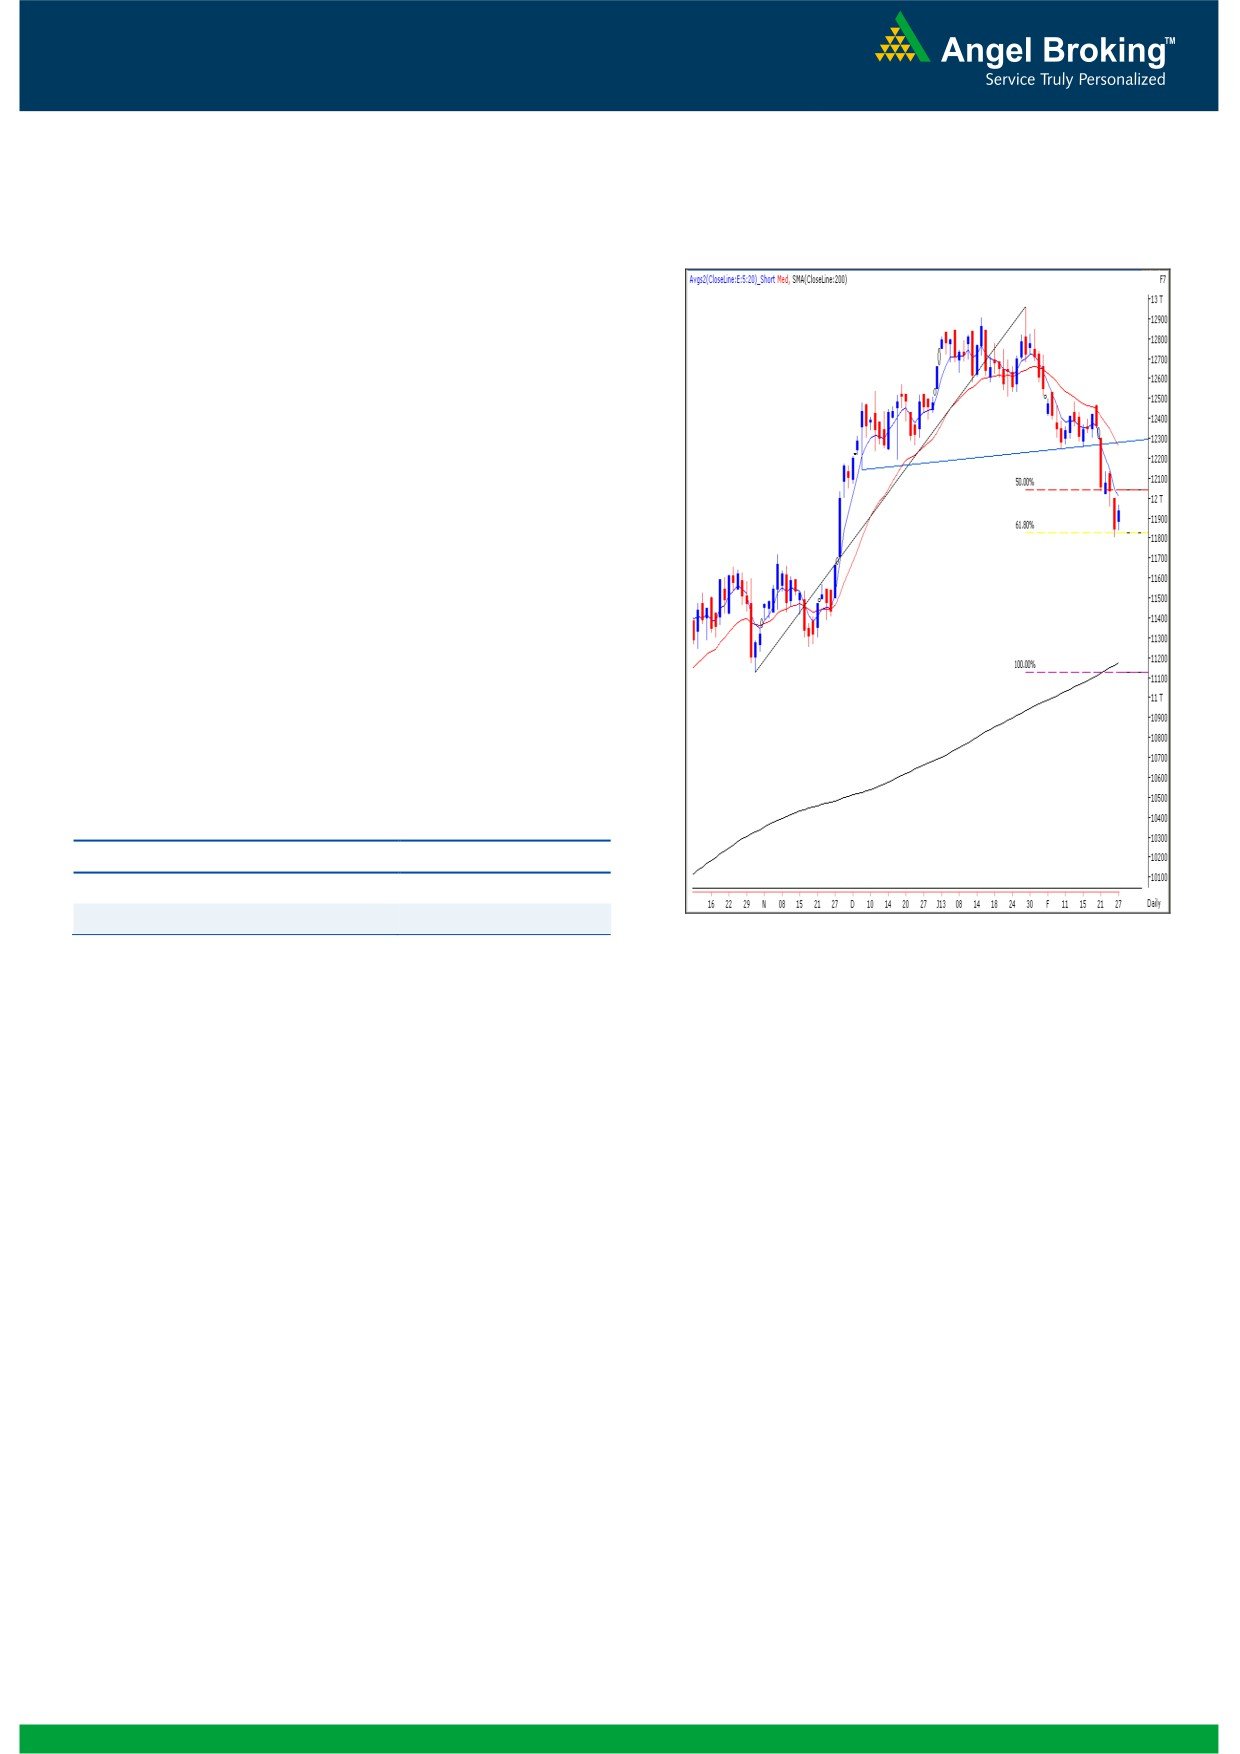
Exhibit 2: Bank Nifty Daily Chart
Bank Nifty Outlook - (11931)
Yesterday, Bank Nifty opened on a flat note and traded in
a narrow range throughout the session to close with a gain
of 0.72%. On the daily chart we are witnessing a ‘Bullish
Harami’ candlestick pattern at
61.8% Fibonacci
retracement of the rise from
11125
-
12961. The
mentioned pattern requires confirmation in the form of a
close above 11971 level. A close above the 11971 level
may push the index higher towards 12140 - 12190 level.
On the downside 11800 - 11719 levels are likely to act as
support for the day. Traders holding short positions in the
index should maintain a strict stop loss of 12140. The
mentioned candlestick pattern would be negated only if
the index closes below the 11808 mark.
Actionable points:
View
Neutral
Resistance Levels
11971 - 12140 - 1210
Support levels
11800 - 11719
Source: Falcon:
2
Daily Technical Report
February 28, 2013
Research Team Tel: 022 - 30940000
DISCLAIMER
This document is solely for the personal information of the recipient, and must not be singularly used as the basis of any investment
decision. Nothing in this document should be construed as investment or financial advice. Each recipient of this document should make
such investigations as they deem necessary to arrive at an independent evaluation of an investment in the securities of the companies
referred to in this document (including the merits and risks involved), and should consult their own advisors to determine the merits and
risks of such an investment.
Angel Broking Limited, its affiliates, directors, its proprietary trading and investment businesses may, from time to time, make
investment decisions that are inconsistent with or contradictory to the recommendations expressed herein. The views contained in this
document are those of the analyst, and the company may or may not subscribe to all the views expressed within.
Reports based on technical and derivative analysis center on studying charts of a stock's price movement, outstanding positions and
trading volume, as opposed to focusing on a company's fundamentals and, as such, may not match with a report on a company's
fundamentals.
The information in this document has been printed on the basis of publicly available information, internal data and other reliable
sources believed to be true, but we do not represent that it is accurate or complete and it should not be relied on as such, as this
document is for general guidance only. Angel Broking Limited or any of its affiliates/ group companies shall not be in any way
responsible for any loss or damage that may arise to any person from any inadvertent error in the information contained in this report.
Angel Broking Limited has not independently verified all the information contained within this document. Accordingly, we cannot testify,
nor make any representation or warranty, express or implied, to the accuracy, contents or data contained within this document. While
Angel Broking Limited endeavours to update on a reasonable basis the information discussed in this material, there may be regulatory,
compliance, or other reasons that prevent us from doing so.
This document is being supplied to you solely for your information, and its contents, information or data may not be reproduced,
redistributed or passed on, directly or indirectly.
Angel Broking Limited and its affiliates may seek to provide or have engaged in providing corporate finance, investment banking or
other advisory services in a merger or specific transaction to the companies referred to in this report, as on the date of this report or in
the past.
Neither Angel Broking Limited, nor its directors, employees or affiliates shall be liable for any loss or damage that may arise from or in
connection with the use of this information.
Note: Please refer to the important `Stock Holding Disclosure' report on the Angel website (Research Section). Also, please refer to the
latest update on respective stocks for the disclosure status in respect of those stocks. Angel Broking Limited and its affiliates may have
investment positions in the stocks recommended in this report.
Research Team
Shardul Kulkarni
-
Head - Technicals
Sameet Chavan
-
Technical Analyst
Sacchitanand Uttekar
-
Technical Analyst
Mehul Kothari
-
Technical Analyst
Ankur Lakhotia
-
Technical Analyst
Angel Broking Pvt. Ltd.
Registered Office: G-1, Ackruti Trade Centre, Rd. No. 7, MIDC, Andheri (E), Mumbai - 400 093.
Corporate Office: 6th Floor, Ackruti Star, MIDC, Andheri (E), Mumbai - 400 093. Tel: (022) 30940000
Sebi Registration No: INB 010996539
4