Daily Technical Report
October 26, 2012
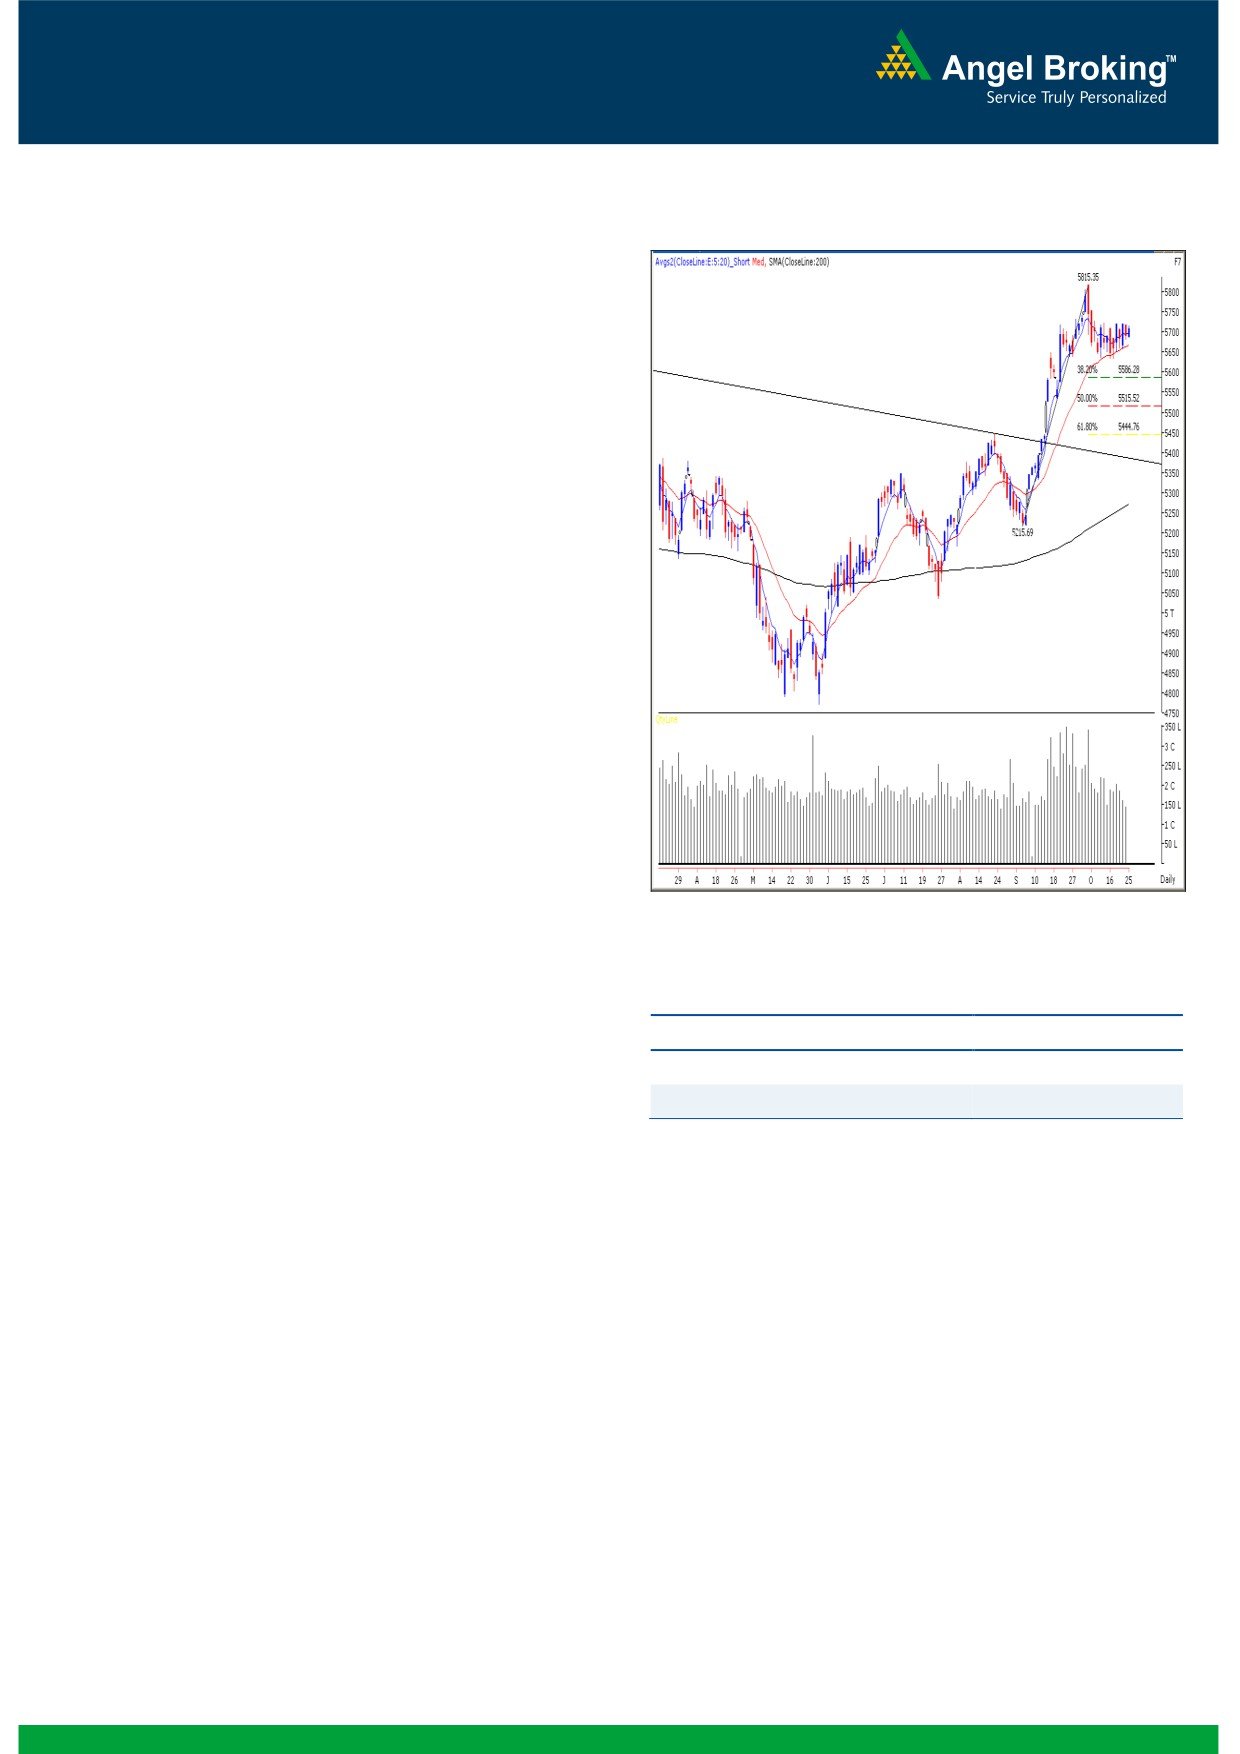
Exhibit 1: Nifty Daily Chart
Sensex (18759) / NIFTY (5705)
Similar to the previous trading sessions, yesterday once
again our benchmark indices traded in a narrow range
throughout the day. Despite F&O expiry, our markets were
directionless and traded with choppiness to close just above
the 5700 mark. On sectoral front, we witnessed a mixed
scenario where, Realty, Healthcare and Teck counters ended
in red. However, Auto, Consumer Goods and Banking sector
provided some support to the indices. The advance to
decline ratio was in favor of declining counters (A=1288
Formation
The ’20-day EMA’ and the ’20-week EMA’ are placed at
18617/ 5654 and 17919/ 5434 levels, respectively.
The monthly ‘RSI’ oscillator is moving higher from the 50
mark and the positive in ADX (9) indicator is intact.
The negative crossover in weekly ‘Stochastic’ oscillator is
still intact.
At present, the value of Daily ‘RSI’ oscillator is 56.38.
The RSI trading above the 50 mark shows strength of the
Source: Falcon:
current up trend.
The 38.2% and 50% Fibonacci Retracement levels of the
Actionable points:
rise from 17250 to 19138 / 5216 to 5815 are placed at
18416 / 5586 and 18194 / 5515, respectively.
View for the day
Neutral
Trading strategy:
Resistance Levels
5729 - 5757
Support Levels
5633
The derivative contract for the October series proved to be a
phase of consolidation for the markets. The October series
showed just a 1 % gain in comparison to the 6% up move in
September. Overall, the markets are still stuck in trading
range of 18886 to 18535 / 5729 to 5633 and there is no
significant change on the daily chart. Hence, we reiterate our
view that only a sustainable breakout / breakdown on either
side of the range would give clarity of the near term trend. A
move beyond 5729 would push indices towards their next
resistance and we may then expect our indices to move
towards 18973 - 19138 / 5757 - 5816. A breach of 18535
/ 5633 level would reinforce the selling momentum and in
this case we may witness a correction towards 18416 -
18194 / 5586 - 5515 levels.
1
Daily Technical Report
October 26, 2012
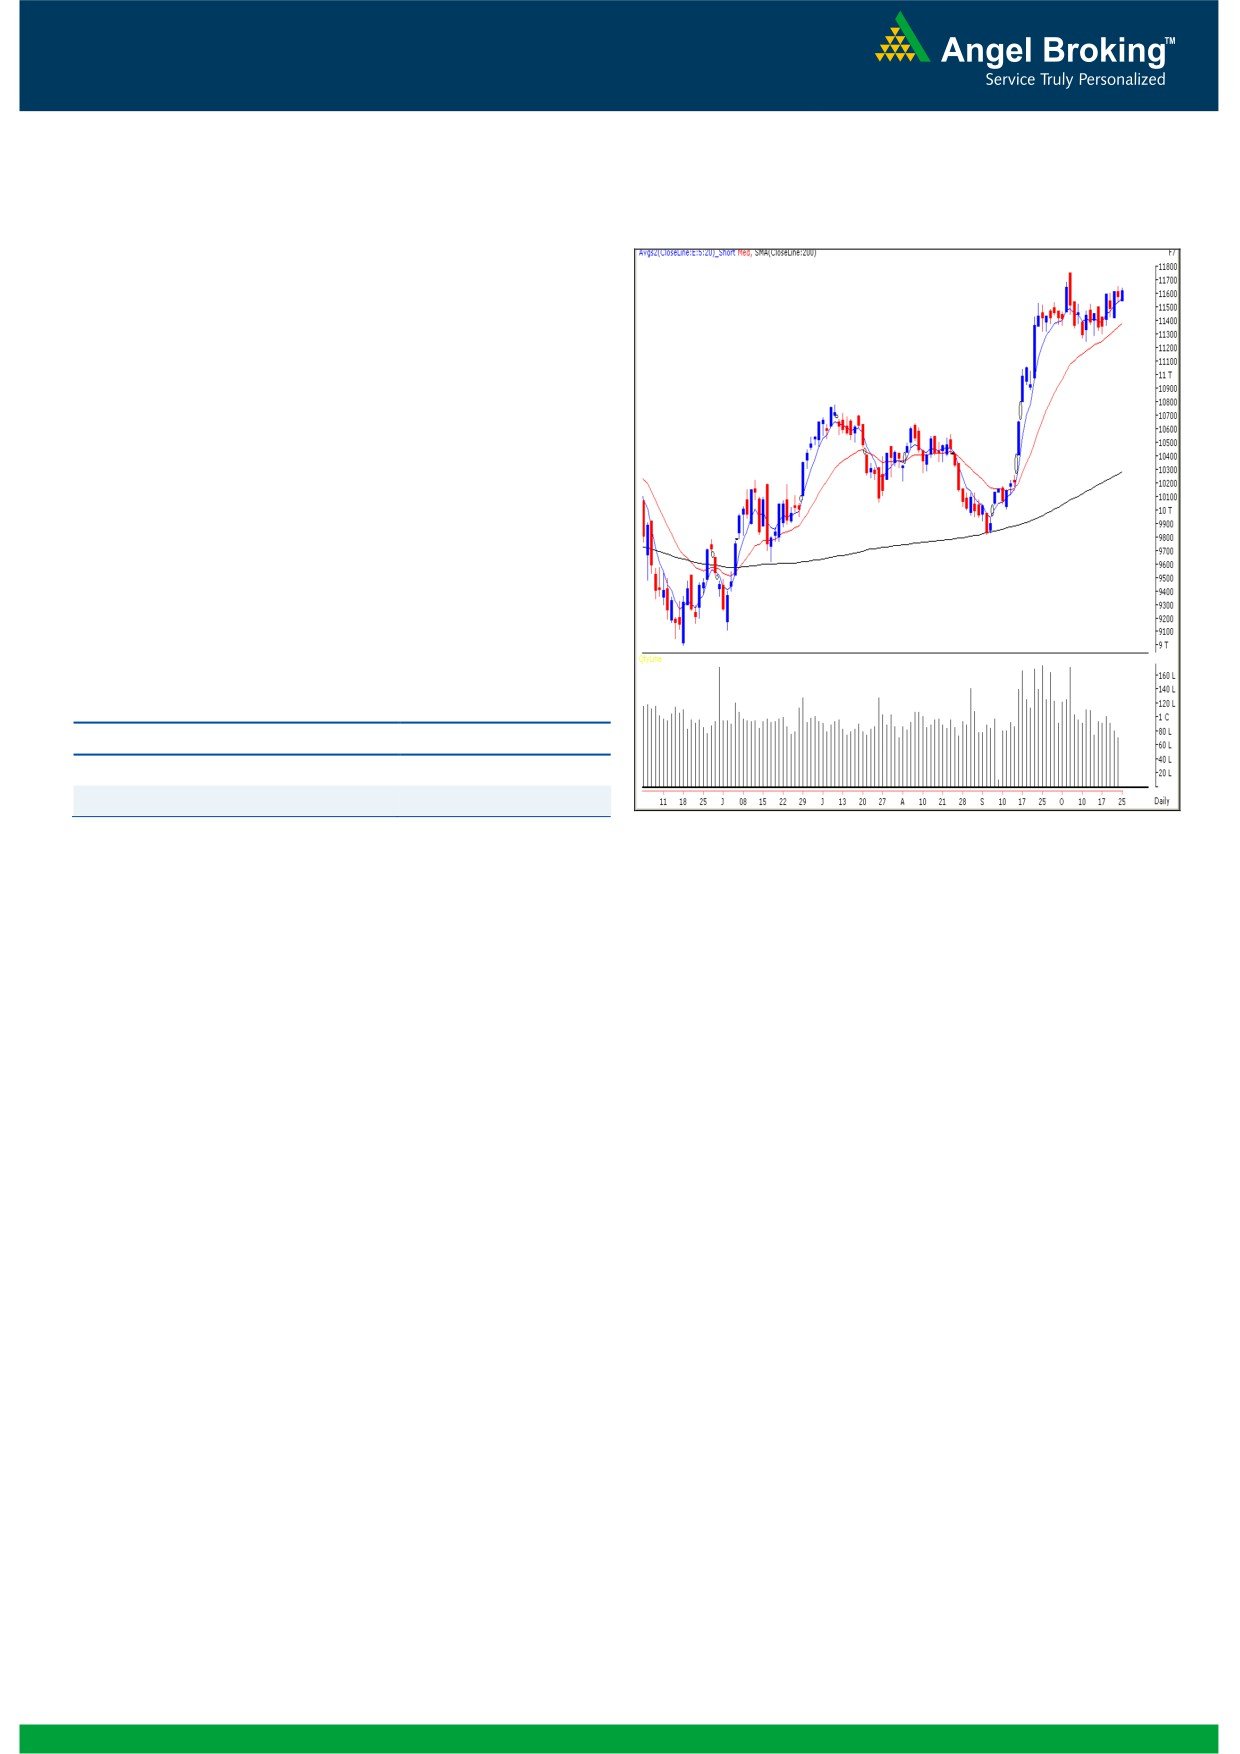
Exhibit 2: Bank Nifty Daily Chart
Bank Nifty Outlook - (11615)
Yesterday, yet again Bank Nifty opened on a flat note and
traded in a narrow range throughout the day to close with
a minimal gain of 0.31%. The index continued its sideways
trading activity in the mentioned range of 11745 - 11245.
In line with our benchmark indices there is no major
change in the chart structure of Bank Nifty. Thus, we
reiterate our view that any fresh positions in the index
should be created only if the index sustains outside the
said range. In the mentioned range 11690 - 11732 levels
are likely to act as resistance and 11534 - 11511 levels
are likely to act as support in coming trading session.
Actionable points:
View for the day
Neutral
Resistance Levels
11690 - 11732
Support Levels
11534 - 11511
Source: Falcon:
2
Daily Technical Report
October 26, 2012
Research Team Tel: 022 - 39357800
DISCLAIMER
This document is solely for the personal information of the recipient, and must not be singularly used as the basis of any investment
decision. Nothing in this document should be construed as investment or financial advice. Each recipient of this document should make
such investigations as they deem necessary to arrive at an independent evaluation of an investment in the securities of the companies
referred to in this document (including the merits and risks involved), and should consult their own advisors to determine the merits and
risks of such an investment.
Angel Broking Limited, its affiliates, directors, its proprietary trading and investment businesses may, from time to time, make
investment decisions that are inconsistent with or contradictory to the recommendations expressed herein. The views contained in this
document are those of the analyst, and the company may or may not subscribe to all the views expressed within.
Reports based on technical and derivative analysis center on studying charts of a stock's price movement, outstanding positions and
trading volume, as opposed to focusing on a company's fundamentals and, as such, may not match with a report on a company's
fundamentals.
The information in this document has been printed on the basis of publicly available information, internal data and other reliable
sources believed to be true, but we do not represent that it is accurate or complete and it should not be relied on as such, as this
document is for general guidance only. Angel Broking Limited or any of its affiliates/ group companies shall not be in any way
responsible for any loss or damage that may arise to any person from any inadvertent error in the information contained in this report.
Angel Broking Limited has not independently verified all the information contained within this document. Accordingly, we cannot testify,
nor make any representation or warranty, express or implied, to the accuracy, contents or data contained within this document. While
Angel Broking Limited endeavours to update on a reasonable basis the information discussed in this material, there may be regulatory,
compliance, or other reasons that prevent us from doing so.
This document is being supplied to you solely for your information, and its contents, information or data may not be reproduced,
redistributed or passed on, directly or indirectly.
Angel Broking Limited and its affiliates may seek to provide or have engaged in providing corporate finance, investment banking or
other advisory services in a merger or specific transaction to the companies referred to in this report, as on the date of this report or in
the past.
Neither Angel Broking Limited, nor its directors, employees or affiliates shall be liable for any loss or damage that may arise from or in
connection with the use of this information.
Note: Please refer to the important `Stock Holding Disclosure' report on the Angel website (Research Section). Also, please refer to the
latest update on respective stocks for the disclosure status in respect of those stocks. Angel Broking Limited and its affiliates may have
investment positions in the stocks recommended in this report.
Research Team
Shardul Kulkarni
-
Head - Technicals
Sameet Chavan
-
Technical Analyst
Sacchitanand Uttekar
-
Technical Analyst
Mehul Kothari
-
Technical Analyst
Ankur Lakhotia
-
Technical Analyst
Angel Broking Pvt. Ltd.
Registered Office: G-1, Ackruti Trade Centre, Rd. No. 7, MIDC, Andheri (E), Mumbai - 400 093.
Corporate Office: 6th Floor, Ackruti Star, MIDC, Andheri (E), Mumbai - 400 093. Tel: (022) 3952 6600
Sebi Registration No: INB 010996539
4