Daily Technical Report
April 26, 2013
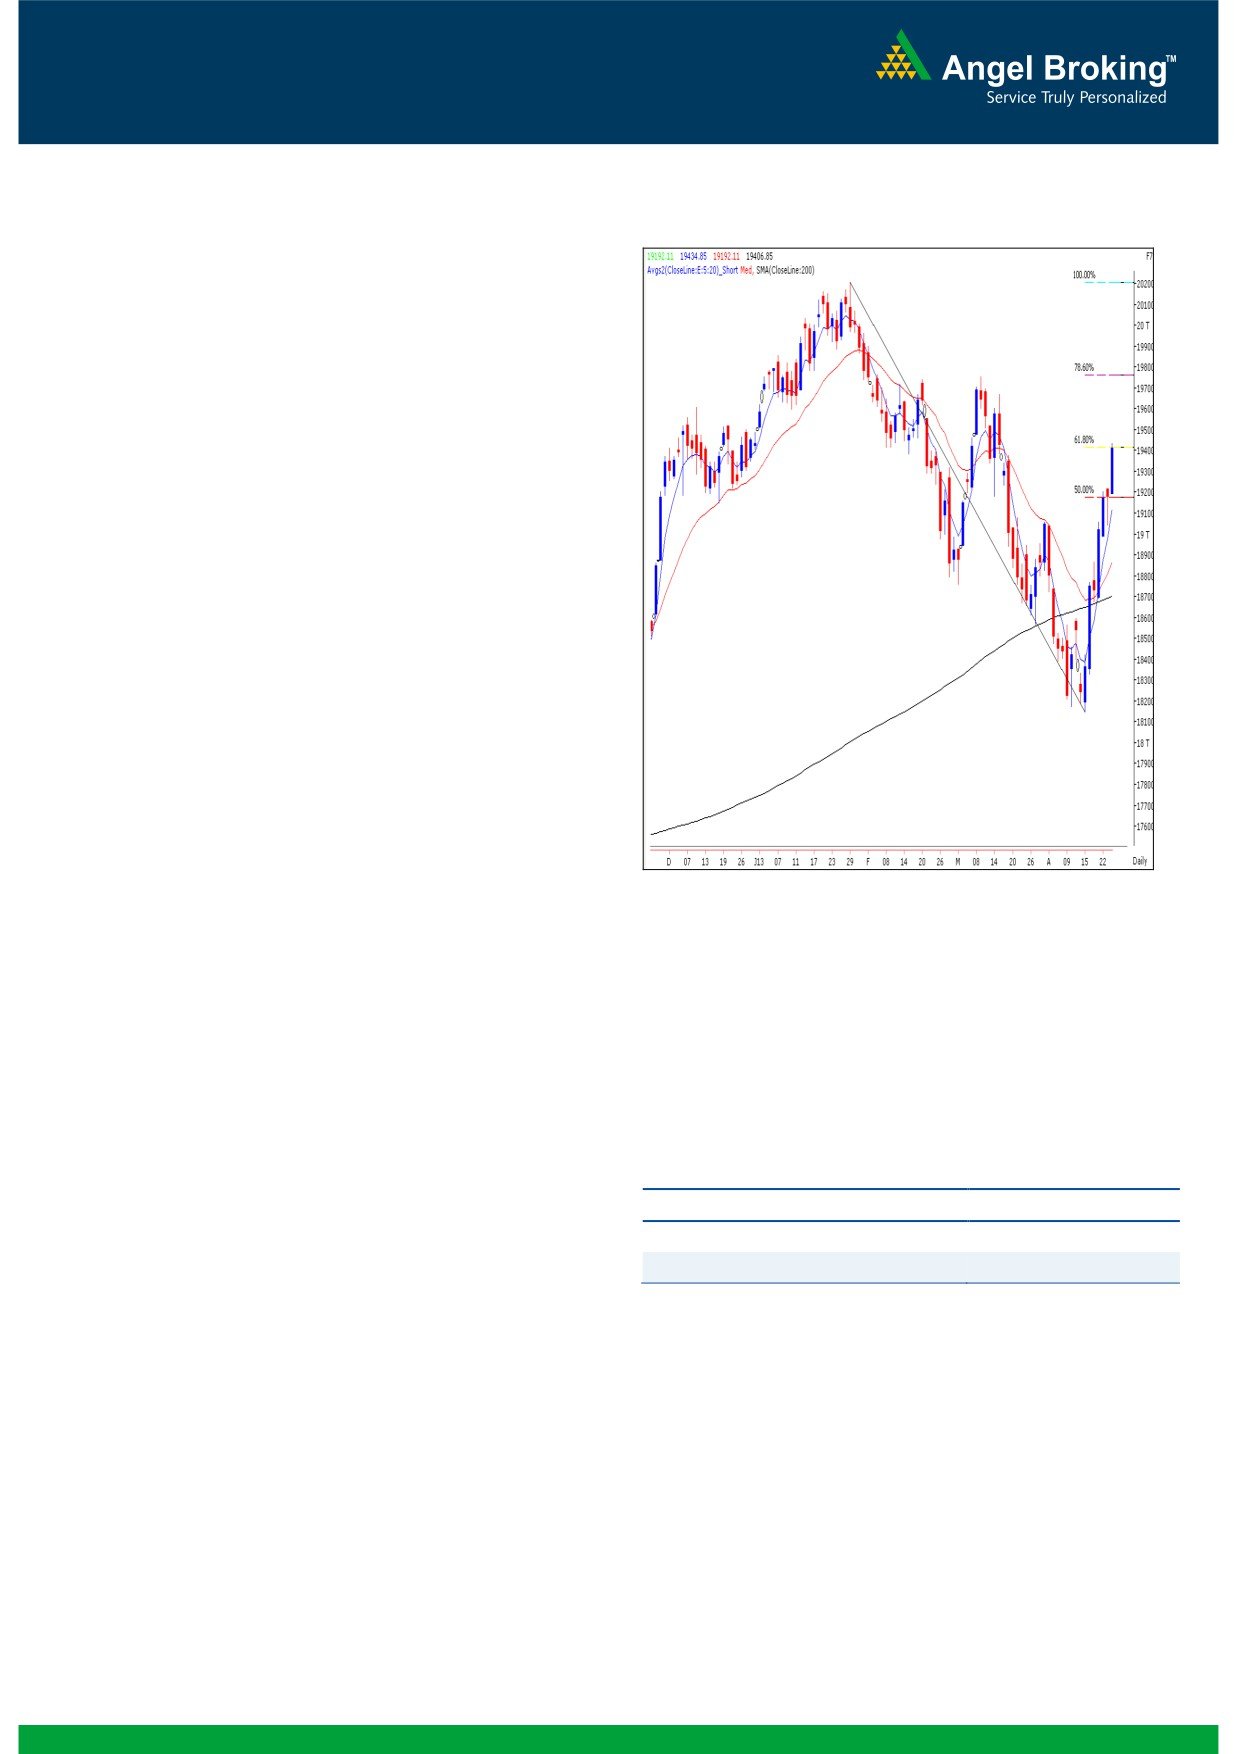
Exhibit 1: Sensex Daily Chart
Sensex (19407) / NIFTY (5916)
Yesterday, indices opened higher in-line with positive global
cues and moved higher right from the initial trade of the
session. After a brief correction in the second half we
witnessed a sharp bounce during the last half an hour of
trade and markets ended well inside the positive territory.
During the day, Auto, Health Care and Oil & Gas counters
were among the major gainers; whereas IT, Teck and Realty
sectors ended in the red. The advance to decline ratio was in
favor of advancing counters (A=1221 D=1158)
(Source-
Formation
The ’20-week EMA’ and the ’20-day EMA’ are placed at
19050 / 5771 and 18862 / 5715 levels, respectively.
The ’89-day EMA’ and the ‘200-day SMA’ are placed at
19058 / 5770 and 18701 / 5670, respectively.
The ‘Lower Top - Lower Bottom’ formation on the weekly
chart is still intact.
Source: Falcon:
The weekly momentum oscillators and daily ‘5 & 20
EMA’ have signaled a positive crossover.
The 61.8% and 78.6% Fibonacci retracement levels of
the fall from 20204 / 6112 to 18144 / 5477 are placed
at 19416 / 5870 and 19765 / 5976.
Actionable points:
Trading strategy:
As expected, yesterday we witnessed tremendous volatility on
View
Neutral
account of April month derivative expiry. The price action can
Resistance levels
5925 - 5971
easily be described as Tug-of-war between the bulls and the
Support level
5853
bears. In our previous report, we had mentioned a ‘Hanging
Man’ pattern, which got negated as indices managed to
open well above the high of the pattern. In the process,
On the flipside, a break of yesterday’s low of 19192 / 5853
indices managed to break the stiff resistance of 19416 /
may lead to a correction and indices may fall towards the
5870. The Nifty has now closed above the psychological
support levels of 18950 - 18870 / 5765 - 5732. The
level of 5900 mark. Considering the current optimism and
momentum oscillators on the daily chart have now entered
FII buying, it can be inferred that if the markets can sustain
extreme overbought territory. Hence, possibility of
above yesterday’s high of 19435 / 5925 then they may test
consolidation or correction near 19755 / 5971 cannot be
the 19755 / 5971 level which nearly coincides with the
ruled out. Hence, we advise traders to book at least partial
78.60% Fibonacci retracement of the fall from 20204 /
profits and trade with strict stop losses.
6112 to 18144 / 5477.
1
Daily Technical Report
April 26, 2013
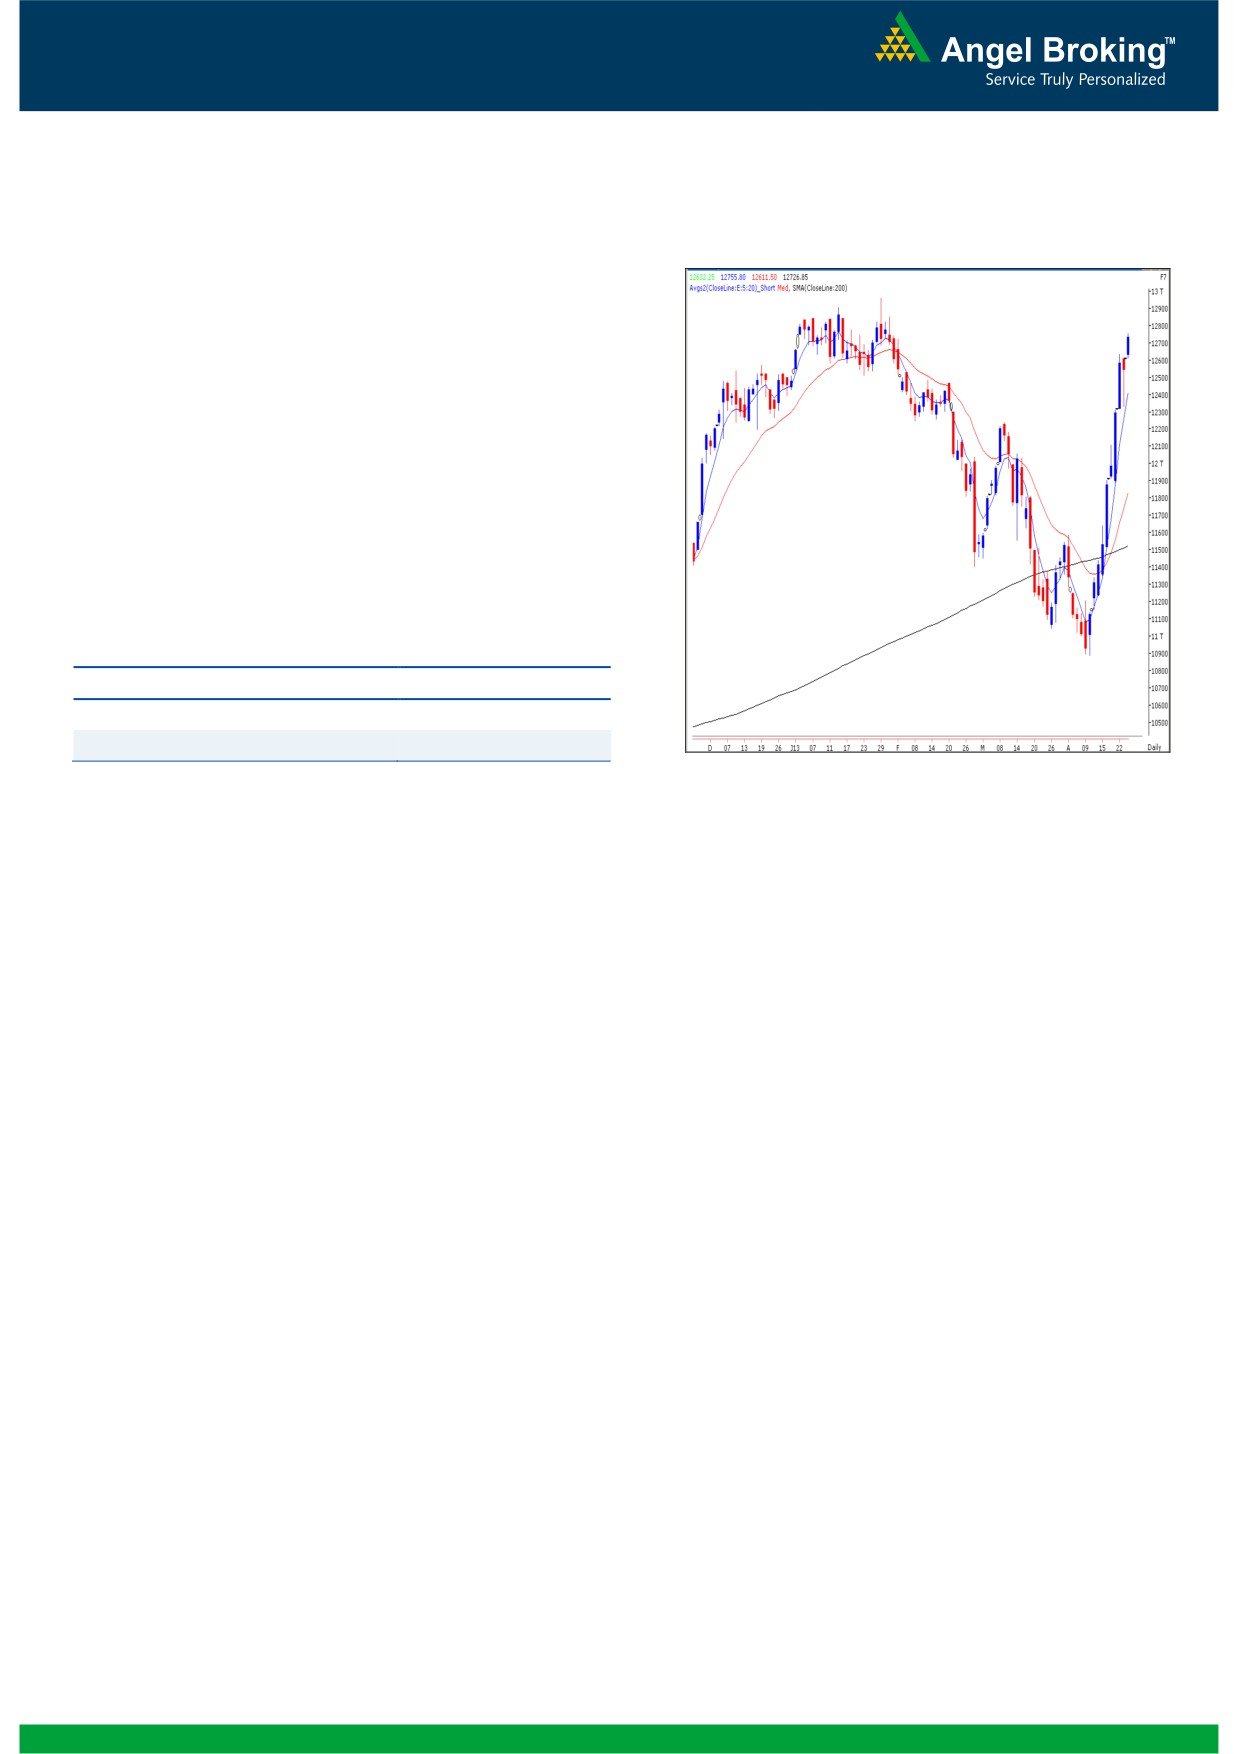
Exhibit 2: Bank Nifty Daily Chart
Bank Nifty Outlook - (12727)
Yesterday, Bank Nifty too opened with and upside gap in-
line with the benchmark indices but traded in a 100 point
range throughout the session. Considering the negative
divergence of the momentum oscillator ‘RSI’ in the hourly
chart, we believe that a break of the 11535 mark would
result in a loss of momentum in the index. In this case the
index is likely to drift lower towards 12330 - 12262 levels.
Conversely, a sustainable move beyond yesterday’s high of
12756 may push the Bank Nifty higher to test 12834 /
12980 levels.
Actionable points:
View
Neutral
Resistance level
12834- 12980
Support Levels
12535 - 12330
Source: Falcon:
2
Daily Technical Report
April 26, 2013
Daily Pivot Levels for Nifty 50 Stocks
SCRIPS
S2
S1
PIVOT
R1
R2
SENSEX
19,102
19,254
19,345
19,497
19,587
NIFTY
5,827
5,872
5,898
5,943
5,969
BANKNIFTY
12,554
12,640
12,698
12,785
12,842
ACC
1,209
1,232
1,246
1,269
1,283
AMBUJACEM
183
187
190
194
198
ASIANPAINT
4,612
4,632
4,660
4,680
4,709
AXISBANK
1,425
1,464
1,492
1,531
1,559
BAJAJ-AUTO
1,793
1,815
1,835
1,857
1,877
BANKBARODA
679
694
708
723
737
BHARTIARTL
293
298
304
310
315
BHEL
183
188
191
196
200
BPCL
405
411
416
421
426
CAIRN
287
293
297
302
306
CIPLA
391
399
404
412
417
COALINDIA
310
314
316
320
322
DLF
236
239
245
248
253
DRREDDY
1,878
1,935
1,968
2,025
2,058
GAIL
320
332
341
353
362
GRASIM
2,834
2,909
2,954
3,029
3,074
HCLTECH
702
711
723
731
743
HDFC
815
839
862
886
909
HDFCBANK
673
681
688
696
703
HEROMOTOCO
1,521
1,570
1,609
1,657
1,696
HINDALCO
96
97
98
99
100
HINDUNILVR
461
470
478
487
495
ICICIBANK
1,150
1,164
1,176
1,190
1,202
IDFC
154
156
159
161
164
INDUSINDBK
452
460
469
477
487
INFY
2,207
2,217
2,234
2,244
2,260
ITC
311
316
319
324
327
JINDALSTEL
321
325
329
333
337
JPASSOCIAT
75
76
78
80
82
KOTAKBANK
683
697
706
720
729
LT
1,489
1,504
1,516
1,531
1,543
LUPIN
669
680
690
701
710
M&M
864
887
903
925
941
MARUTI
1,520
1,555
1,577
1,613
1,635
NMDC
126
127
129
130
132
NTPC
146
151
153
158
161
ONGC
314
320
328
335
343
PNB
771
778
787
795
804
POWERGRID
106
108
110
112
114
RANBAXY
446
454
459
467
473
RELIANCE
799
809
818
828
837
RELINFRA
366
372
380
385
394
SBIN
2,275
2,305
2,324
2,354
2,373
SESAGOA
150
152
153
156
157
SUNPHARMA
927
954
970
996
1,012
TATAMOTORS
280
287
291
298
303
TATAPOWER
93
94
95
96
97
TATASTEEL
308
310
312
315
317
TCS
1,379
1,390
1,411
1,422
1,442
ULTRACEMCO
1,842
1,886
1,913
1,957
1,984
3
Daily Technical Report
April 26, 2013
Research Team Tel: 022 - 30940000
DISCLAIMER
This document is solely for the personal information of the recipient, and must not be singularly used as the basis of any investment
decision. Nothing in this document should be construed as investment or financial advice. Each recipient of this document should make
such investigations as they deem necessary to arrive at an independent evaluation of an investment in the securities of the companies
referred to in this document (including the merits and risks involved), and should consult their own advisors to determine the merits and
risks of such an investment.
Angel Broking Limited, its affiliates, directors, its proprietary trading and investment businesses may, from time to time, make
investment decisions that are inconsistent with or contradictory to the recommendations expressed herein. The views contained in this
document are those of the analyst, and the company may or may not subscribe to all the views expressed within.
Reports based on technical and derivative analysis center on studying charts of a stock's price movement, outstanding positions and
trading volume, as opposed to focusing on a company's fundamentals and, as such, may not match with a report on a company's
fundamentals.
The information in this document has been printed on the basis of publicly available information, internal data and other reliable
sources believed to be true, but we do not represent that it is accurate or complete and it should not be relied on as such, as this
document is for general guidance only. Angel Broking Limited or any of its affiliates/ group companies shall not be in any way
responsible for any loss or damage that may arise to any person from any inadvertent error in the information contained in this report.
Angel Broking Limited has not independently verified all the information contained within this document. Accordingly, we cannot testify,
nor make any representation or warranty, express or implied, to the accuracy, contents or data contained within this document. While
Angel Broking Limited endeavors to update on a reasonable basis the information discussed in this material, there may be regulatory,
compliance, or other reasons that prevent us from doing so.
This document is being supplied to you solely for your information, and its contents, information or data may not be reproduced,
redistributed or passed on, directly or indirectly.
Angel Broking Limited and its affiliates may seek to provide or have engaged in providing corporate finance, investment banking or
other advisory services in a merger or specific transaction to the companies referred to in this report, as on the date of this report or in
the past.
Neither Angel Broking Limited, nor its directors, employees or affiliates shall be liable for any loss or damage that may arise from or in
connection with the use of this information.
Note: Please refer to the important `Stock Holding Disclosure' report on the Angel website (Research Section). Also, please refer to the
latest update on respective stocks for the disclosure status in respect of those stocks. Angel Broking Limited and its affiliates may have
investment positions in the stocks recommended in this report.
Research Team
Shardul Kulkarni
-
Head - Technicals
Sameet Chavan
-
Technical Analyst
Sacchitanand Uttekar
-
Technical Analyst
Ankur Lakhotia
-
Technical Analyst
Angel Broking Pvt. Ltd.
Registered Office: G-1, Ackruti Trade Centre, Rd. No. 7, MIDC, Andheri (E), Mumbai - 400 093.
Corporate Office: 6th Floor, Ackruti Star, MIDC, Andheri (E), Mumbai - 400 093. Tel: (022) 30940000
Sebi Registration No: INB 010996539
4