Daily Technical Report
March 26, 2013
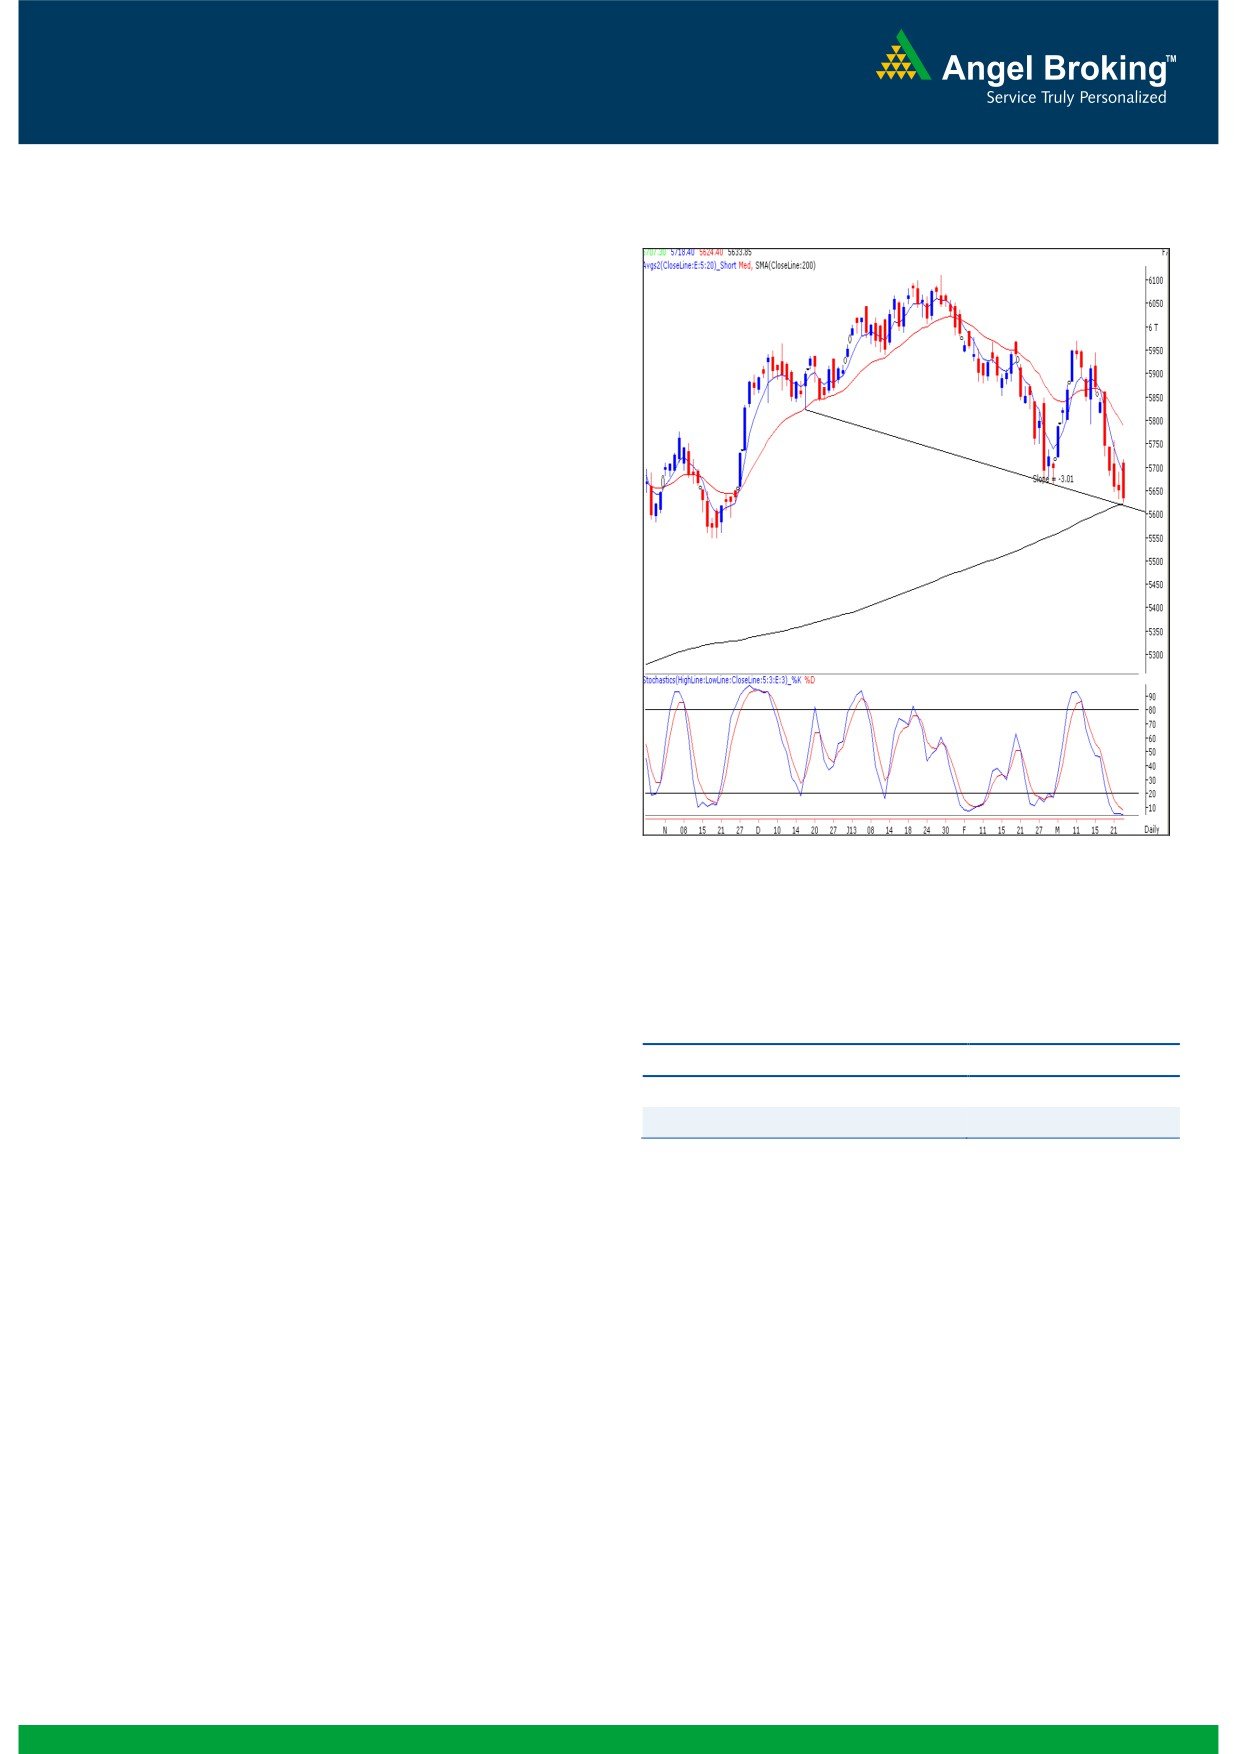
Exhibit 1: Nifty Daily Chart
Sensex (18681) / NIFTY (5634)
Yesterday for the 3rd consecutive session, the markets pared
all gains during the last hour of trade and eventually closed
marginally in the negative territory. The Capital Goods, Auto
and Metal counters were among the major losers whereas
Realty, Power and Oil & Gas stocks ended with some gains.
The advance to decline ratio was strongly in favor of
declining
counters
(A=1028 D=1884) (Source-
Formation
The ’20-day EMA’ and the ’20-week EMA’ are placed at
19165 / 5789 and 19146 / 5796 levels, respectively.
The ‘200 Day SMA’ is placed at 18536 / 5621.
The ‘Lower Top Lower Bottom’ formation on weekly
chart is confirmed for the first time after January 14,
2011.
We are witnessing a ‘Downward Sloping’ trend line
Source: Falcon:
support drawn by joining the lows of December 18,
2012 and March 04, 2013.
Actionable points:
Trading strategy:
Yesterday, we witnessed a gap up opening by nearly a
View
Neutral
percent in-line with other positive Asian bourses. Indices then
Resistance levels
5691 - 5720
slipped into a consolidation mode and lingered around the
Support levels
5620 - 5593
hourly ’20 EMA’ placed at 18875 / 5695. However, just
before the start of the final hour, we witnessed tremendous
selling pressure which eventually dragged indices
significantly lower from day’s high. In this process, indices
traded just below last week’s low of 18669 / 5631. The
‘Downward Sloping Trend Line’ mentioned in our earlier
report is now being tested for the second time in two
consecutive sessions. Considering the strong support zone of
this trend line and ‘200 day SMA’, we reiterate that Fresh
short positions should not be initiated at current levels as the
risk to reward ratio is unfavorable. For the day, we expect
18610 / 5593 to act as a decent support level. On the
flipside, the daily ‘Stochastic’ momentum oscillator is placed
well inside the extreme oversold. Hence, possibilities of a
near term bounce towards 19083 - 19240 / 5758 - 5820
levels cannot be ruled out.
1
Daily Technical Report
March 26, 2013
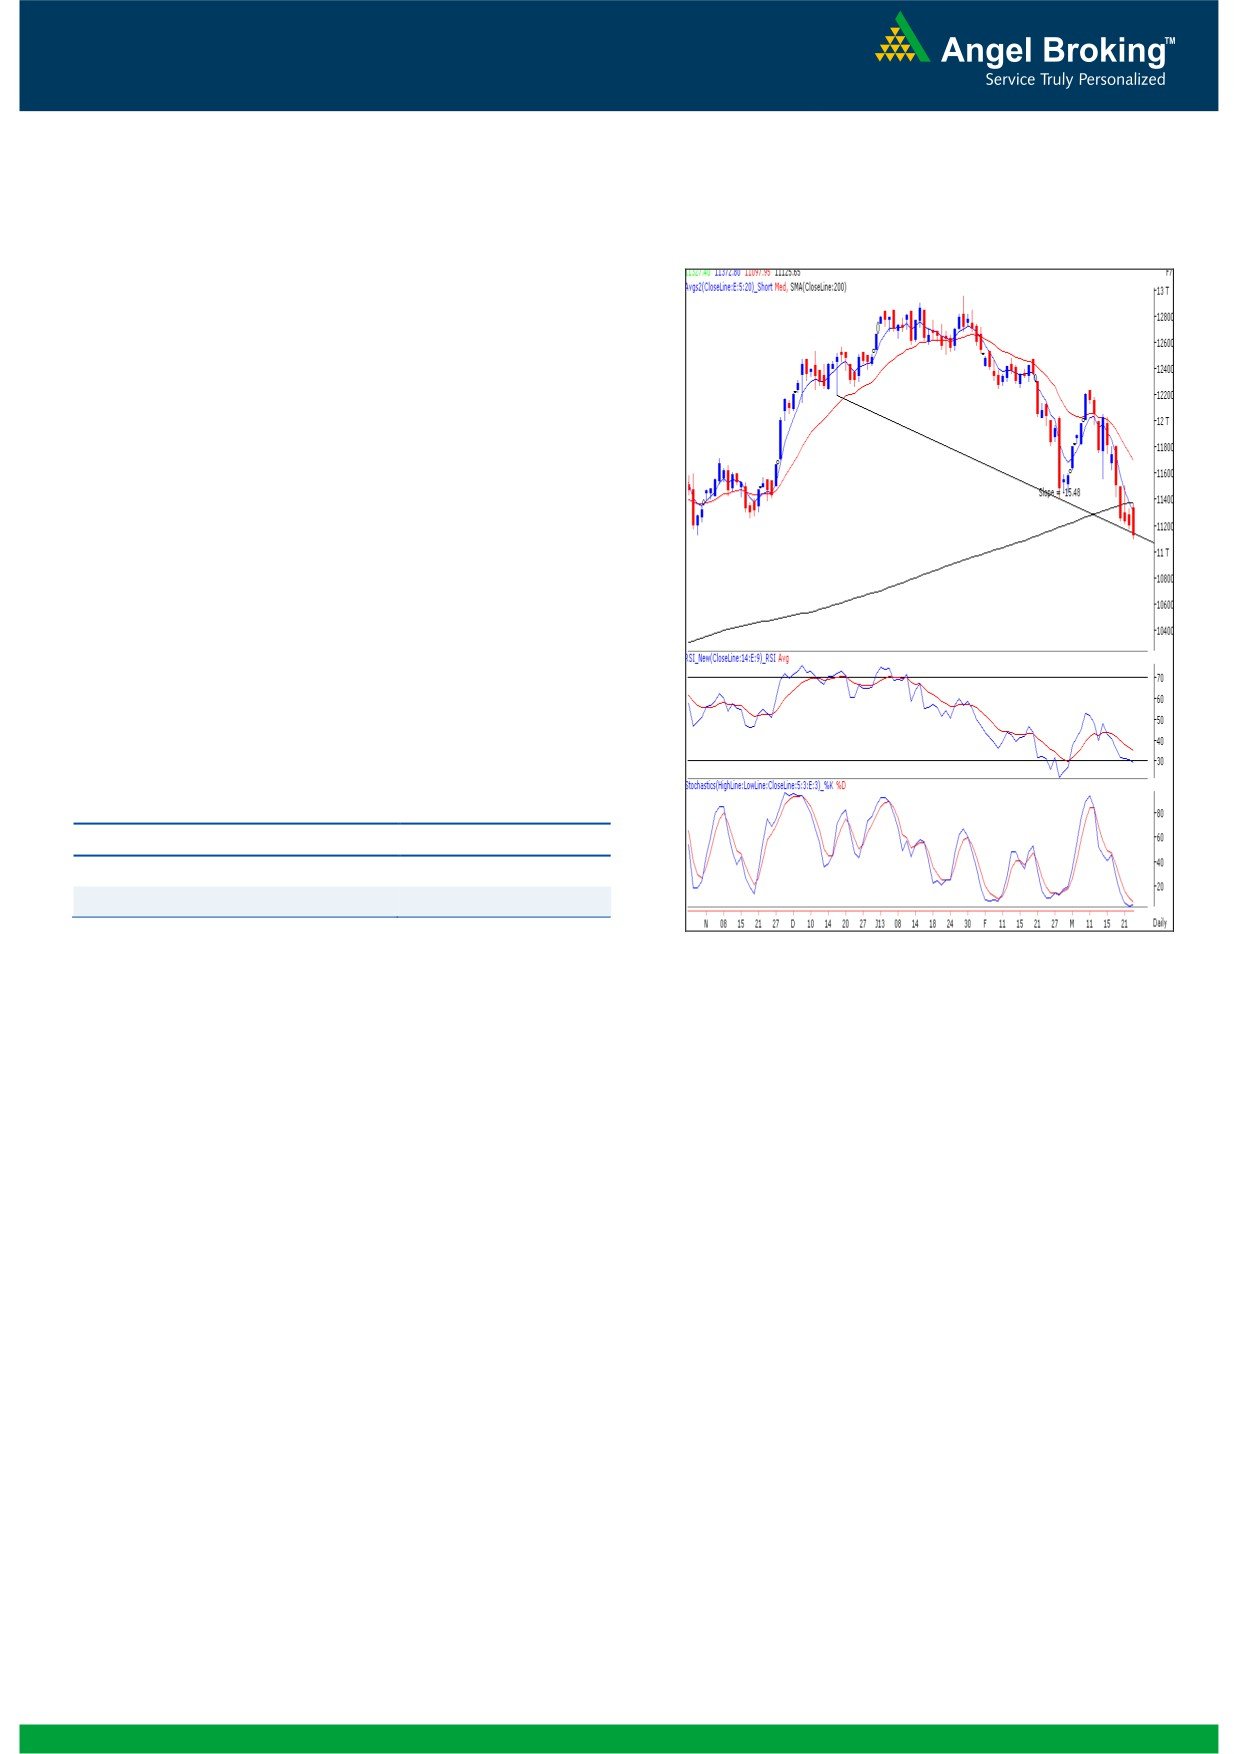
Exhibit 2: Bank Nifty Daily Chart
Bank Nifty Outlook - (11126)
Yesterday, Bank Nifty opened on a positive note and
traded in a narrow range during first half of the session.
However during the second half selling pressure near the
resistance level of 11395 led the index lower to close at
the mentioned support of 11125. At this juncture the index
is hovering around the trend line support formed by
joining the significant lows of December 24, 2012 and
February 28, 2013. In addition the index has formed ‘Last
Engulfing Bottom’ candlestick pattern coupled with positive
divergence in ‘RSI’ momentum oscillator on the daily and
hourly chart. The mentioned pattern is a bullish reversal
pattern but requires confirmation in the form of a close
above the 11373 mark. For the day
11021 - 10940
levels are likely to act as support and 11347 - 11373
levels are likely to act as resistance for the day.
Actionable points:
View
Neutral
Resistance Levels
11347 - 11373
Support Level
11021 - 10940
Source: Falcon:
2
Daily Technical Report
March 26, 2013
Daily Pivot Levels for Nifty 50 Stocks
SCRIPS
S2
S1
PIVOT
R1
R2
SENSEX
18,466
18,574
18,762
18,870
19,058
NIFTY
5,565
5,599
5,659
5,693
5,753
BANKNIFTY
10,924
11,025
11,199
11,300
11,474
ACC
1,139
1,147
1,159
1,167
1,178
AMBUJACEM
166
169
175
178
183
ASIANPAINT
4,769
4,824
4,913
4,968
5,056
AXISBANK
1,280
1,295
1,315
1,329
1,349
BAJAJ-AUTO
1,769
1,786
1,812
1,829
1,856
BANKBARODA
634
646
667
679
700
BHARTIARTL
281
285
291
295
301
BHEL
175
177
181
183
186
BPCL
363
368
373
378
384
CAIRN
271
274
280
283
289
CIPLA
376
378
382
384
388
COALINDIA
291
294
297
301
304
DLF
229
236
241
248
253
DRREDDY
1,709
1,738
1,767
1,795
1,824
GAIL
302
308
318
324
334
GRASIM
2,814
2,840
2,881
2,906
2,948
HCLTECH
754
761
767
773
779
HDFC
791
799
809
816
826
HDFCBANK
604
607
610
613
616
HEROMOTOCO
1,573
1,596
1,631
1,653
1,688
HINDALCO
85
86
89
91
94
HINDUNILVR
455
458
462
465
468
ICICIBANK
984
998
1,023
1,038
1,063
IDFC
133
136
142
145
150
INFY
2,818
2,835
2,850
2,868
2,882
ITC
297
300
304
307
311
JINDALSTEL
341
346
354
359
367
JPASSOCIAT
61
62
64
66
68
KOTAKBANK
618
625
636
643
655
LT
1,323
1,345
1,383
1,404
1,442
LUPIN
619
625
632
638
645
M&M
849
857
868
876
888
MARUTI
1,244
1,264
1,297
1,318
1,351
NTPC
138
140
143
145
147
ONGC
295
300
305
310
315
PNB
702
713
729
740
756
POWERGRID
102
103
104
105
105
RANBAXY
415
425
432
442
449
RELIANCE
791
800
812
821
833
RELINFRA
332
338
347
353
362
SBIN
2,007
2,032
2,079
2,105
2,151
SESAGOA
147
150
153
156
160
SIEMENS
542
548
556
563
571
SUNPHARMA
812
816
822
826
832
TATAMOTORS
265
268
272
275
279
TATAPOWER
93
94
96
97
99
TATASTEEL
303
309
319
324
334
TCS
1,518
1,531
1,541
1,554
1,565
ULTRACEMCO
1,845
1,854
1,865
1,874
1,885
WIPRO
423
427
434
438
445
3
Daily Technical Report
March 26, 2013
Research Team Tel: 022 - 30940000
DISCLAIMER
This document is solely for the personal information of the recipient, and must not be singularly used as the basis of any investment
decision. Nothing in this document should be construed as investment or financial advice. Each recipient of this document should make
such investigations as they deem necessary to arrive at an independent evaluation of an investment in the securities of the companies
referred to in this document (including the merits and risks involved), and should consult their own advisors to determine the merits and
risks of such an investment.
Angel Broking Limited, its affiliates, directors, its proprietary trading and investment businesses may, from time to time, make
investment decisions that are inconsistent with or contradictory to the recommendations expressed herein. The views contained in this
document are those of the analyst, and the company may or may not subscribe to all the views expressed within.
Reports based on technical and derivative analysis center on studying charts of a stock's price movement, outstanding positions and
trading volume, as opposed to focusing on a company's fundamentals and, as such, may not match with a report on a company's
fundamentals.
The information in this document has been printed on the basis of publicly available information, internal data and other reliable
sources believed to be true, but we do not represent that it is accurate or complete and it should not be relied on as such, as this
document is for general guidance only. Angel Broking Limited or any of its affiliates/ group companies shall not be in any way
responsible for any loss or damage that may arise to any person from any inadvertent error in the information contained in this report.
Angel Broking Limited has not independently verified all the information contained within this document. Accordingly, we cannot testify,
nor make any representation or warranty, express or implied, to the accuracy, contents or data contained within this document. While
Angel Broking Limited endeavors to update on a reasonable basis the information discussed in this material, there may be regulatory,
compliance, or other reasons that prevent us from doing so.
This document is being supplied to you solely for your information, and its contents, information or data may not be reproduced,
redistributed or passed on, directly or indirectly.
Angel Broking Limited and its affiliates may seek to provide or have engaged in providing corporate finance, investment banking or
other advisory services in a merger or specific transaction to the companies referred to in this report, as on the date of this report or in
the past.
Neither Angel Broking Limited, nor its directors, employees or affiliates shall be liable for any loss or damage that may arise from or in
connection with the use of this information.
Note: Please refer to the important `Stock Holding Disclosure' report on the Angel website (Research Section). Also, please refer to the
latest update on respective stocks for the disclosure status in respect of those stocks. Angel Broking Limited and its affiliates may have
investment positions in the stocks recommended in this report.
Research Team
Shardul Kulkarni
-
Head - Technicals
Sameet Chavan
-
Technical Analyst
Sacchitanand Uttekar
-
Technical Analyst
Ankur Lakhotia
-
Technical Analyst
Angel Broking Pvt. Ltd.
Registered Office: G-1, Ackruti Trade Centre, Rd. No. 7, MIDC, Andheri (E), Mumbai - 400 093.
Corporate Office: 6th Floor, Ackruti Star, MIDC, Andheri (E), Mumbai - 400 093. Tel: (022) 30940000
Sebi Registration No: INB 010996539
4