Daily Technical Report
September 25, 2012
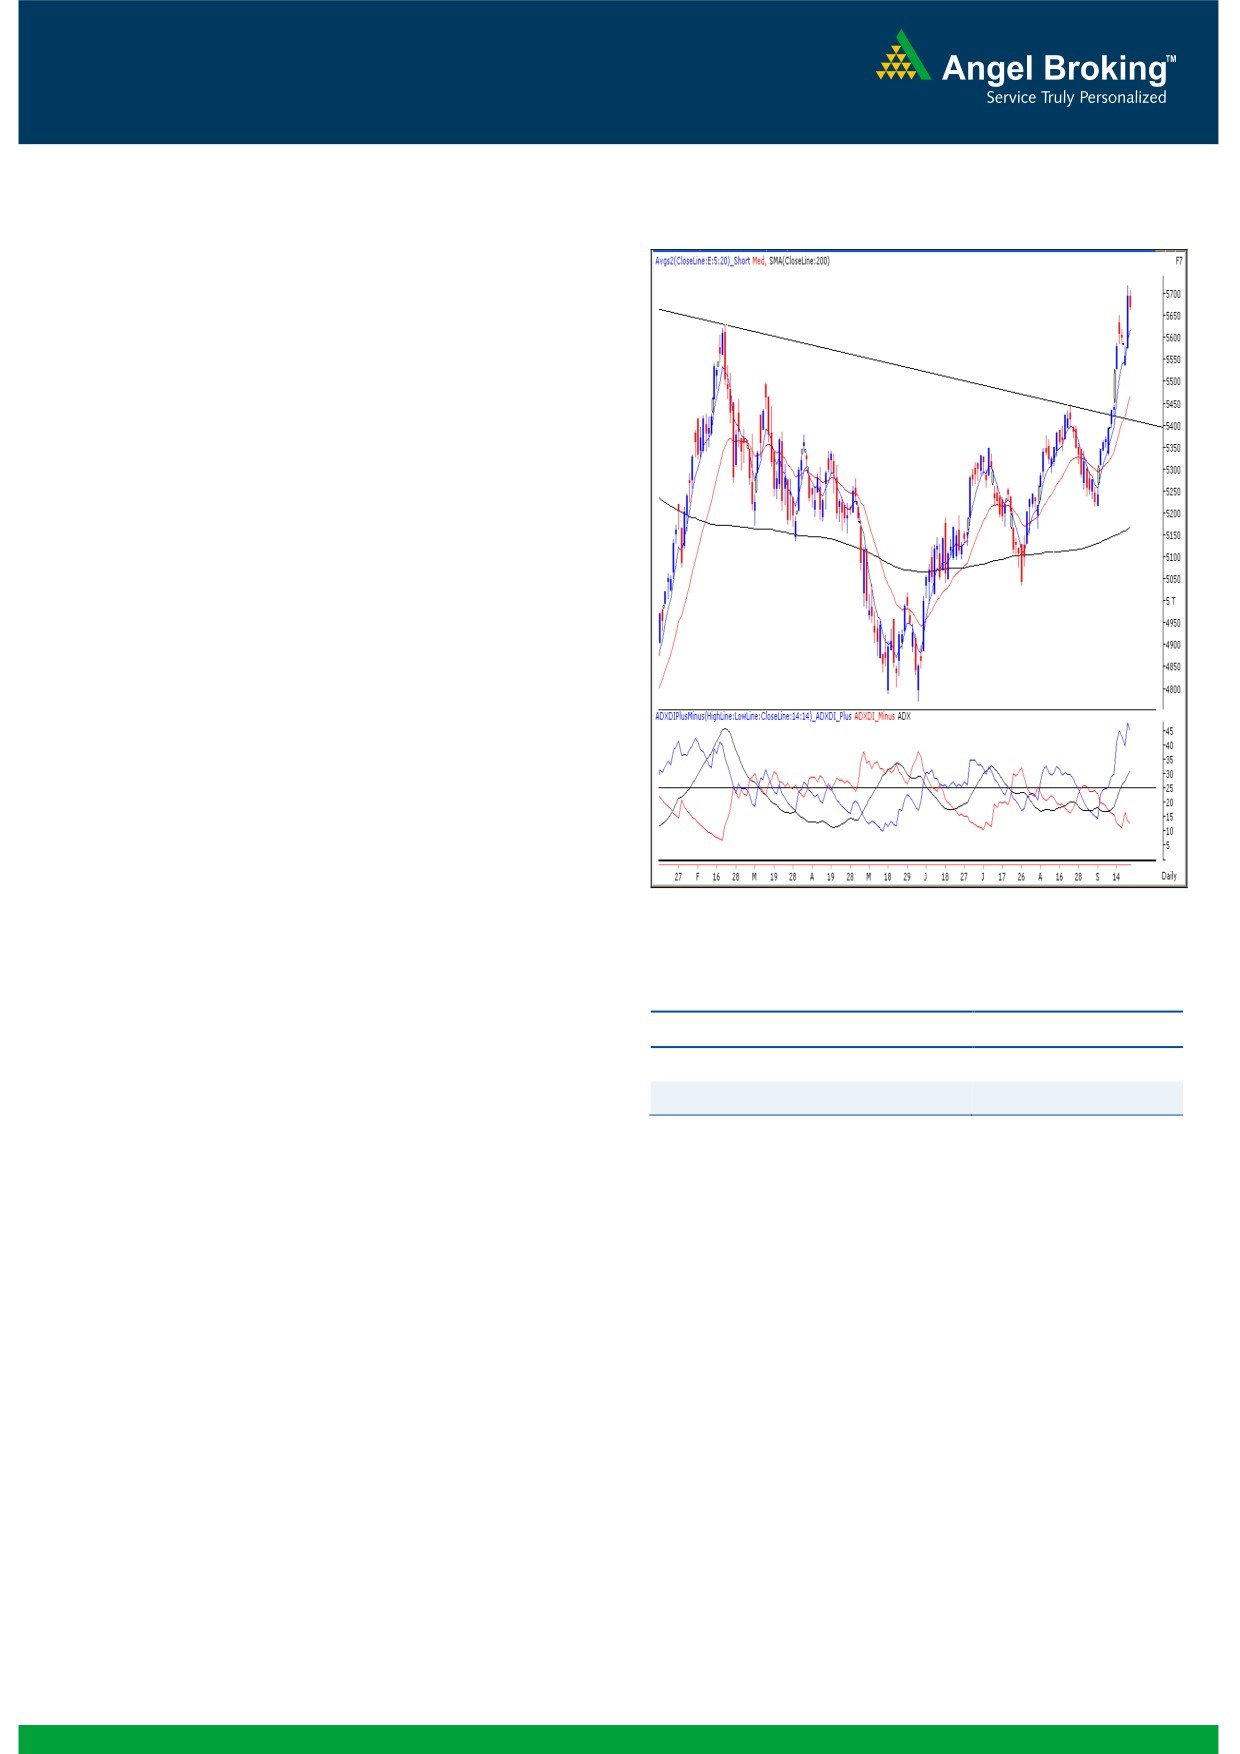
Exhibit 1: Nifty Daily Chart
Sensex (18673) / NIFTY (5670)
The week began on a quite note in-line with mixed global
cues. Subsequently, indices traded in a narrow range
throughout the day and a minor correction towards the latter
part of the session led the markets to close marginally in the
negative territory. On the sectoral front, the Capital Goods,
Power and Realty continued to surge higher; whereas FMCG,
Oil & Gas and PSU counters remained under pressure. The
advance to decline ratio was strongly in favor of advancing
Formation
The ’20-day EMA’ and the ’20-week EMA’ are placed at
18000 / 5450 and 17500 / 5300 levels, respectively.
The weekly chart depicts an “Upward Sloping Trend
Line” breakout above 17973 / 5449 levels.
The daily ‘RSI’ momentum oscillator on weekly chart is
still showing strength.
The continuous rise in the daily ADX (14) indicator
signals strength in the coming sessions. The ADX line
has moved up from the 21 level (previous week’s Friday)
Source: Falcon:
to 30 (this Friday). The ADX line moving above the 30
mark along with rising + DI is interpreted as a strong
Actionable points:
trend.
Trading strategy:
View
Neutral
After a steep intraday rally on last Friday, it was evident to
Resistance Levels
5720 - 5741
have a flat opening in our markets. As mentioned in our
Support Levels
5650 - 5620
weekly report, there is a possibility that our benchmark
indices may consolidate or correct marginally before the
beginning of the next leg of rally. In this process, we may
witness stock specific moves. Going forward, the resistance
remains at 19132 / 5741 level. Only a move above this
level may push indices towards the next targets of 19542 -
19812 / 5850 - 5945. On the lower side, 18640 / 5650
level, which is ’20 EMA’ on hourly chart, may act as support
for the day. A sustainable move below this level may trigger
further selling and as a result, the markets may slide towards
18580 - 18443 / 5620 - 5581 levels.
1
Daily Technical Report
September 25, 2012
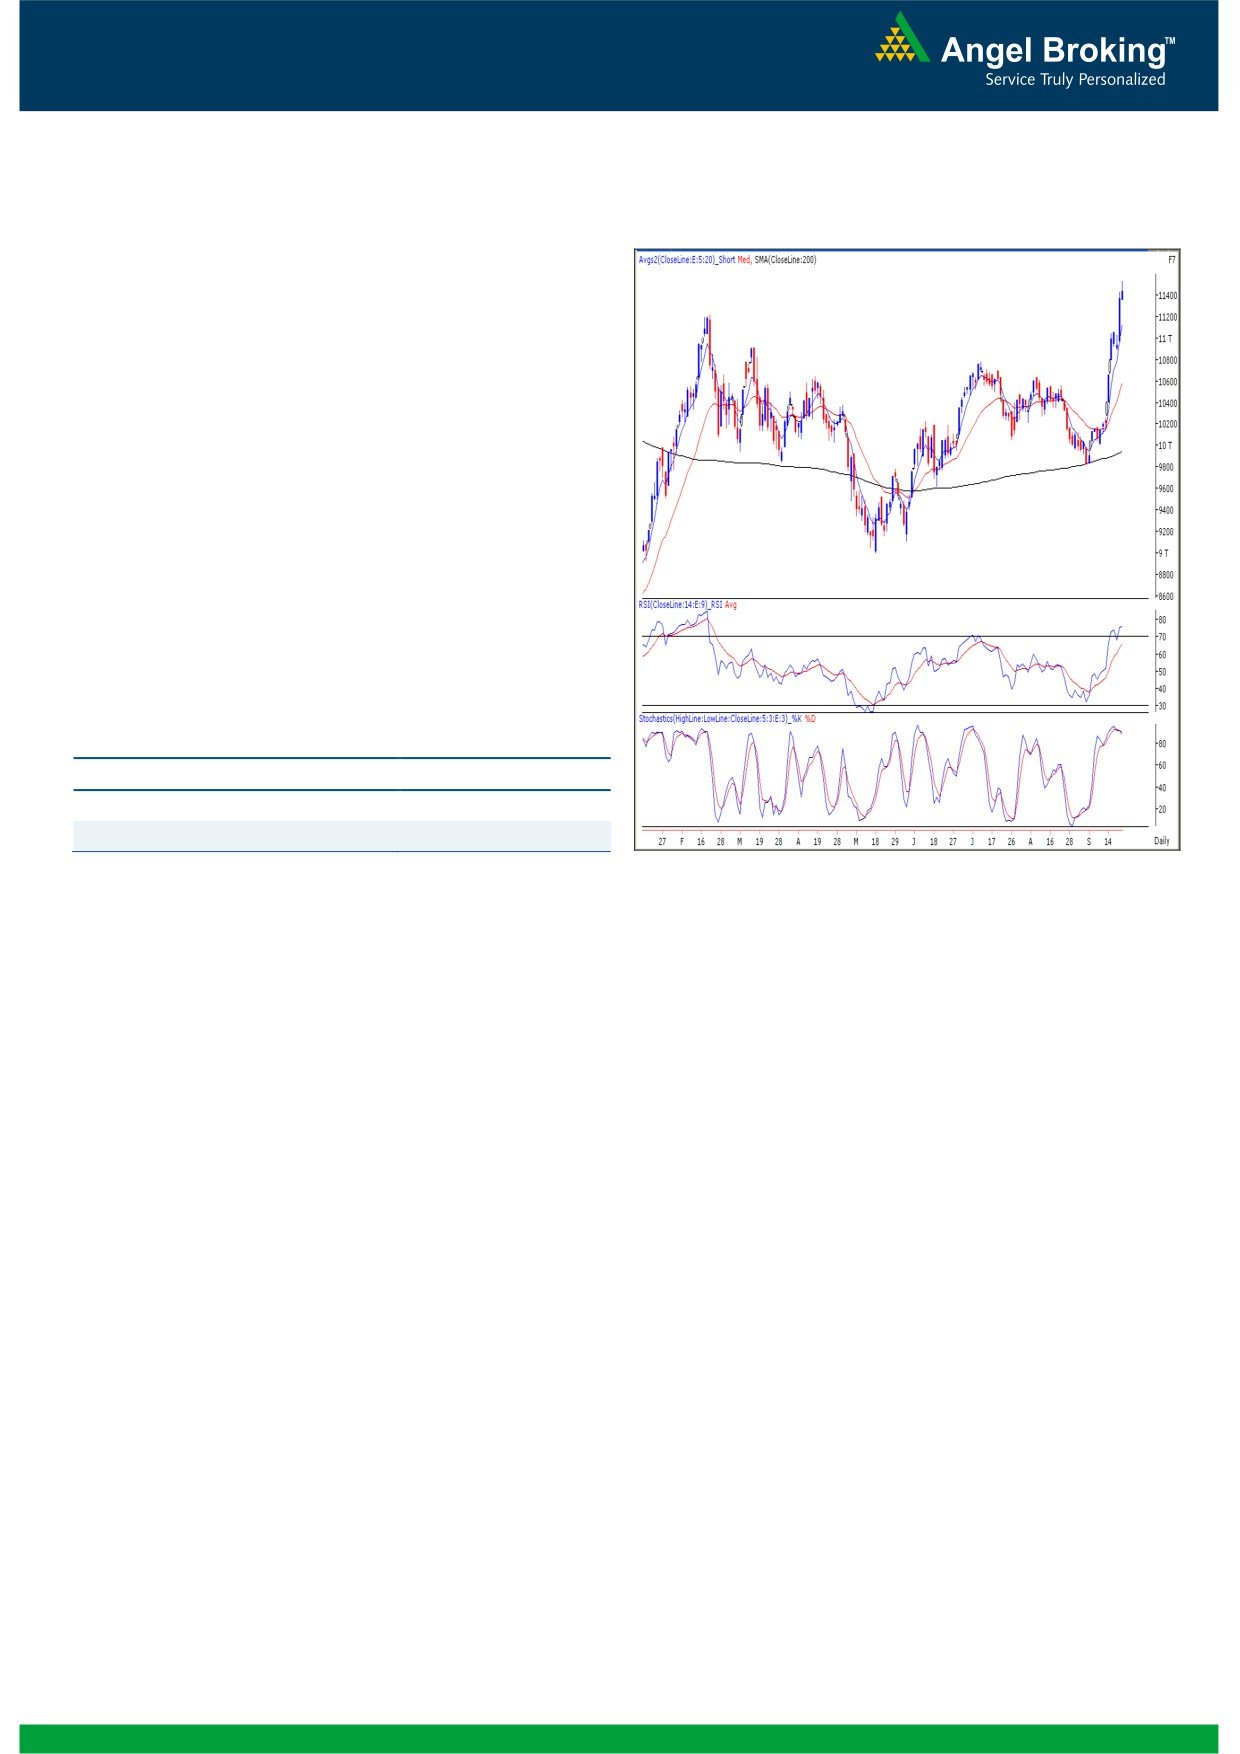
Exhibit 2: Bank Nifty Daily Chart
Bank Nifty Outlook - (11424)
Yesterday, Bank Nifty opened on an optimistic note and
traded with immense volatility to close with a nominal gain of
0.57%. We are now witnessing a “Shooting Star” candlestick
pattern on the daily chart. The mentioned candlestick is a
bearish reversal pattern and requires confirmation. The
momentum oscillators on the daily chart continue to be
placed in overbought zone coupled with negative divergence
in “RSI” momentum oscillator on the hourly chart. Thus if the
index manages to sustain below yesterday’s low of 11359
then it is likely to drift towards 11216 - 11060 levels. On the
upside a move beyond the high of the "Shooting star"
(11534) will negate the bearish implication of the said
pattern.
Actionable points:
View
Bearish Below 11359
Expected Targets
11216 - 11060
Resistance Levels
11534
Source: Falcon:
2
Daily Technical Report
September 25, 2012
Research Team Tel: 022 - 39357800
DISCLAIMER
This document is solely for the personal information of the recipient, and must not be singularly used as the basis of any investment
decision. Nothing in this document should be construed as investment or financial advice. Each recipient of this document should make
such investigations as they deem necessary to arrive at an independent evaluation of an investment in the securities of the companies
referred to in this document (including the merits and risks involved), and should consult their own advisors to determine the merits and
risks of such an investment.
Angel Broking Limited, its affiliates, directors, its proprietary trading and investment businesses may, from time to time, make
investment decisions that are inconsistent with or contradictory to the recommendations expressed herein. The views contained in this
document are those of the analyst, and the company may or may not subscribe to all the views expressed within.
Reports based on technical and derivative analysis center on studying charts of a stock's price movement, outstanding positions and
trading volume, as opposed to focusing on a company's fundamentals and, as such, may not match with a report on a company's
fundamentals.
The information in this document has been printed on the basis of publicly available information, internal data and other reliable
sources believed to be true, but we do not represent that it is accurate or complete and it should not be relied on as such, as this
document is for general guidance only. Angel Broking Limited or any of its affiliates/ group companies shall not be in any way
responsible for any loss or damage that may arise to any person from any inadvertent error in the information contained in this report.
Angel Broking Limited has not independently verified all the information contained within this document. Accordingly, we cannot testify,
nor make any representation or warranty, express or implied, to the accuracy, contents or data contained within this document. While
Angel Broking Limited endeavours to update on a reasonable basis the information discussed in this material, there may be regulatory,
compliance, or other reasons that prevent us from doing so.
This document is being supplied to you solely for your information, and its contents, information or data may not be reproduced,
redistributed or passed on, directly or indirectly.
Angel Broking Limited and its affiliates may seek to provide or have engaged in providing corporate finance, investment banking or
other advisory services in a merger or specific transaction to the companies referred to in this report, as on the date of this report or in
the past.
Neither Angel Broking Limited, nor its directors, employees or affiliates shall be liable for any loss or damage that may arise from or in
connection with the use of this information.
Note: Please refer to the important `Stock Holding Disclosure' report on the Angel website (Research Section). Also, please refer to the
latest update on respective stocks for the disclosure status in respect of those stocks. Angel Broking Limited and its affiliates may have
investment positions in the stocks recommended in this report.
Research Team
Shardul Kulkarni
-
Head - Technicals
Sameet Chavan
-
Technical Analyst
Sacchitanand Uttekar
-
Technical Analyst
Mehul Kothari
-
Technical Analyst
Ankur Lakhotia
-
Technical Analyst
Angel Broking Pvt. Ltd.
Registered Office: G-1, Ackruti Trade Centre, Rd. No. 7, MIDC, Andheri (E), Mumbai - 400 093.
Corporate Office: 6th Floor, Ackruti Star, MIDC, Andheri (E), Mumbai - 400 093. Tel: (022) 3952 6600
Sebi Registration No: INB 010996539
4