Daily Technical Report
January 25, 2013
Sensex (19924) / NIFTY (6019)
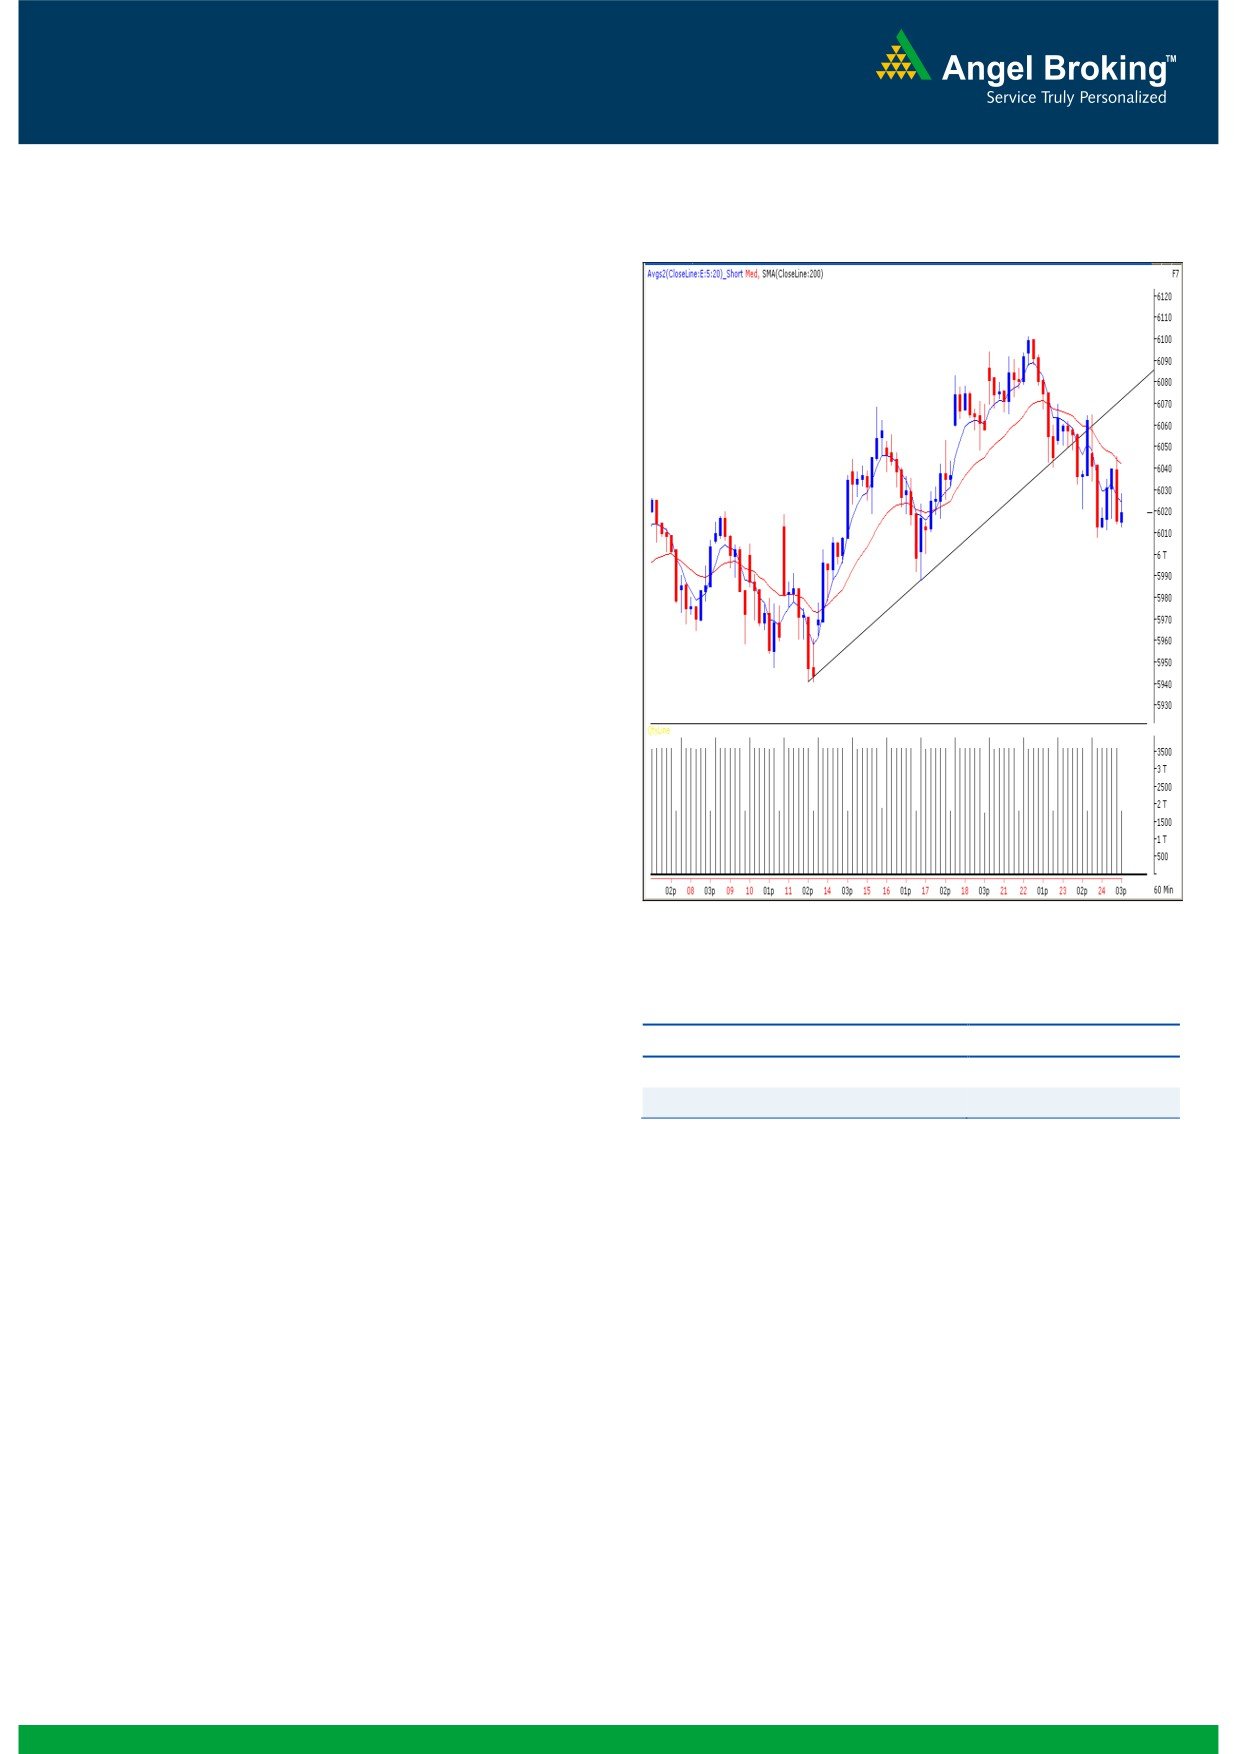
Exhibit 1: Nifty Hourly Chart
Yesterday, indices once again opened on a flat note in-line
with quiet global cues and traded with a negative bias
throughout the session to eventually close around the lowest
point of the day. Again Realty sector was the worst performer
(-4%) due to sell off in HDIL which ended 22% lower
followed by Auto and Power counters. FMCG, IT and Capital
Goods sectors provided decent support to the markets. The
advance to decline ratio was strongly in favor of declining
Formation
The ’20-day EMA’ and the ’20-week EMA’ are placed at
19794 / 5999 and 19042 / 5778 levels, respectively.
On the daily chart, the benchmark indices are facing
resistance near the ‘Upward Sloping Trend Line’ drawn
by joining the highs of October 5, 2012 and December
11, 2012.
We are also observing a ‘Negative Divergence’ in the
daily ‘RSI’ momentum oscillator.
Source: Falcon:
Trading strategy:
Actionable points:
We had mentioned in our earlier report that a sharp bounce
View
Bearish Below 6008
during the final hour on Wednesday can be considered as a
Expected Targets
5988 - 5941
pull back towards the ‘Upward Trend Line’ resistance on
Resistance Levels
6046 - 6065
hourly chart. Very much in-line with our expectations, indices
opened near this resistance level and drifted lower to close
below the mentioned support level of 19918 / 6025. We are
now observing that daily ‘3 & 8 EMA’ is on the verge of
signaling a negative crossover. Hence, despite indices are
now approaching ’20-day EMA’, there is a possibility of
further corrective move in coming sessions. Going forward, if
indices sustain below yesterday’s low of 19884 / 6008, then
we may witness continuation of hourly negative trend and
indices then may slip towards 19783 - 19597 / 5988 -
5941 levels. On the flipside, yesterday’s high of 20072 /
6065 would now act an immediate resistance in coming
trading session.
1
Daily Technical Report
January 25, 2013
Bank Nifty Outlook - (12561)
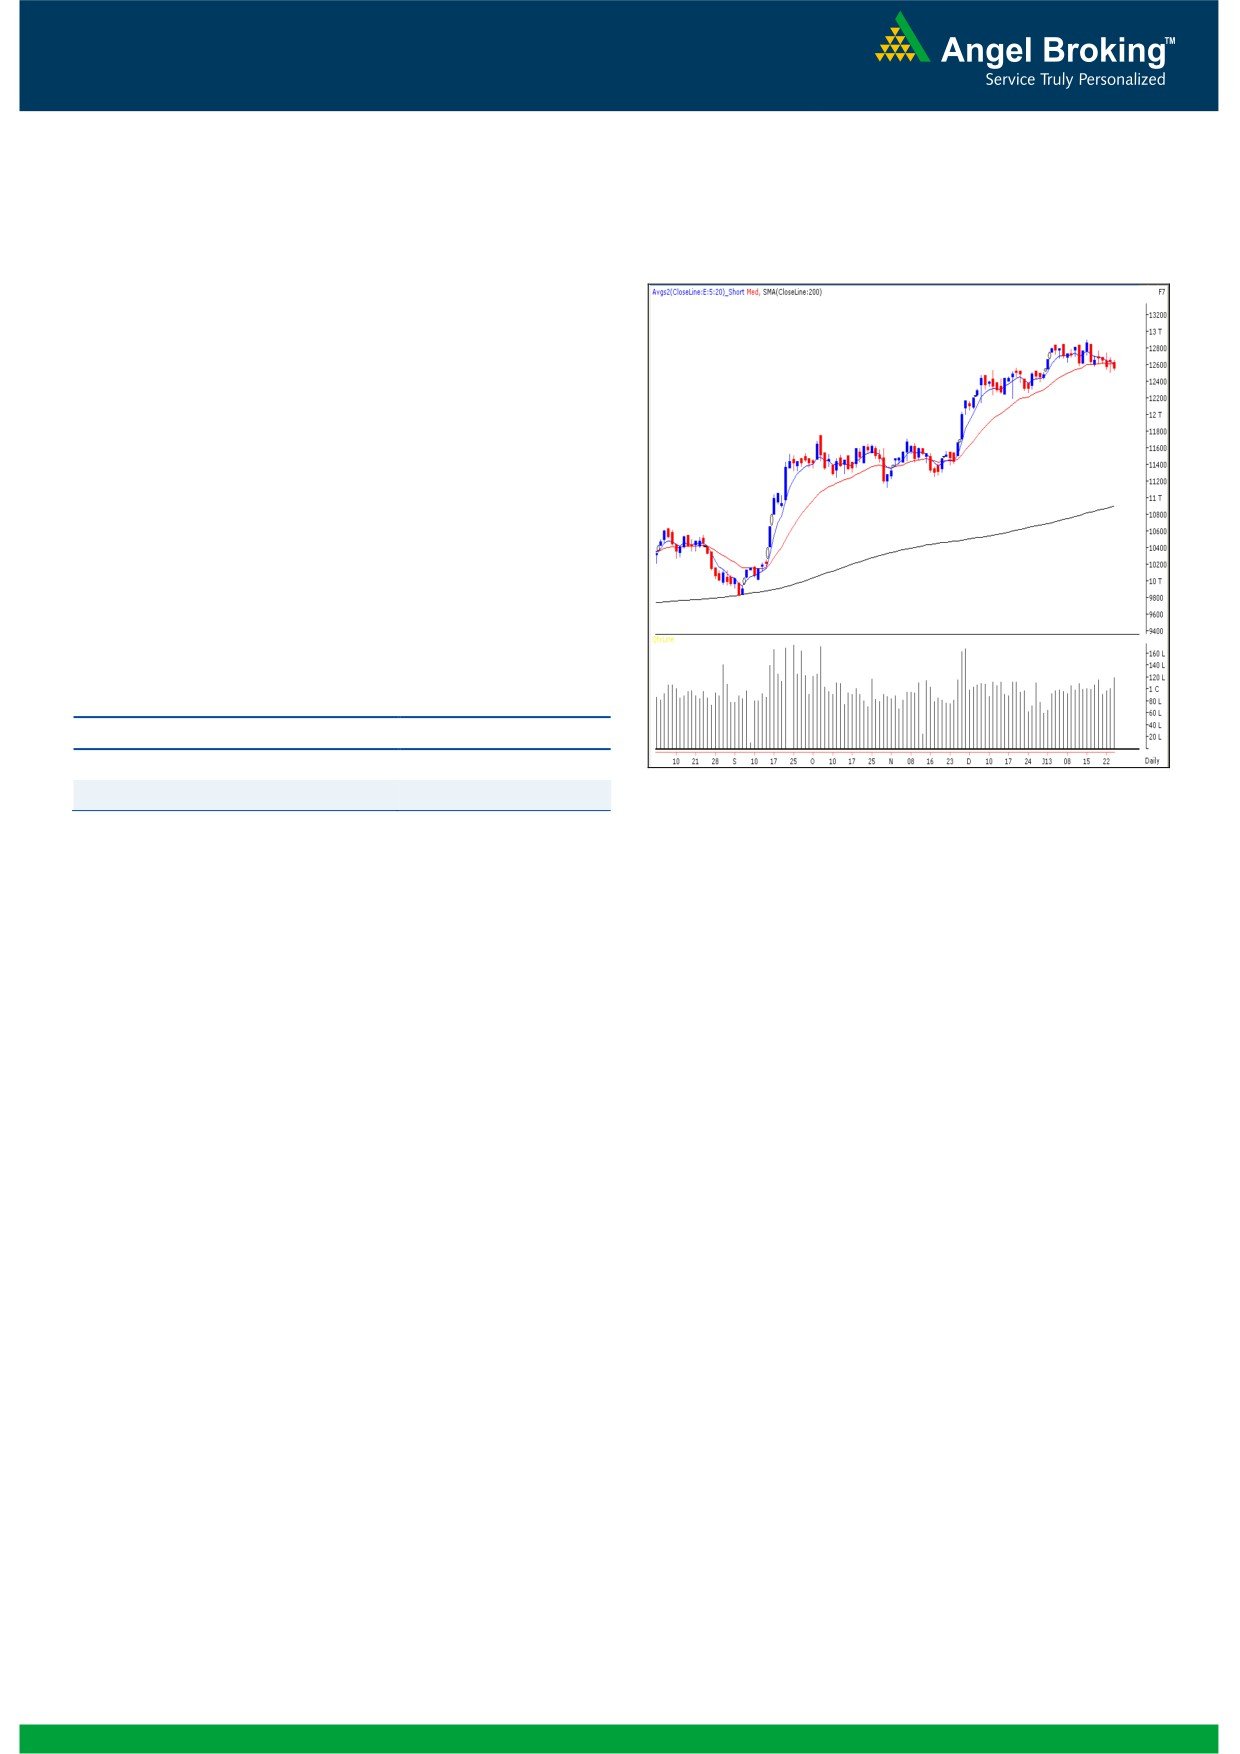
Exhibit 2: Bank Nifty Daily Chart
Yesterday, Bank Nifty opened on a flat note and traded with
extreme volatility throughout the session. Yesterday’s
candlestick pattern is an “Inside Day” as the high and low of
the session is within the range of the high and low of the
previous session. As there is no major change in the chart
structure we reiterate our view that Wednesday's low of
12509 is the key support level for the index. A move below
this level would lead to a further fall towards 12394 -
12266. On the flipside yesterday's high of 12663 is likely to
act as major resistance for the index. A move above this
would enhance buying interest among market participants.
Actionable points:
View
Neutral
Resistance Levels
12663 - 12696
Source: Falcon:
Support Levels
12509 - 12394
2
Daily Technical Report
January 25, 2013
Research Team Tel: 022 - 39357800
DISCLAIMER
This document is solely for the personal information of the recipient, and must not be singularly used as the basis of any investment
decision. Nothing in this document should be construed as investment or financial advice. Each recipient of this document should make
such investigations as they deem necessary to arrive at an independent evaluation of an investment in the securities of the companies
referred to in this document (including the merits and risks involved), and should consult their own advisors to determine the merits and
risks of such an investment.
Angel Broking Limited, its affiliates, directors, its proprietary trading and investment businesses may, from time to time, make
investment decisions that are inconsistent with or contradictory to the recommendations expressed herein. The views contained in this
document are those of the analyst, and the company may or may not subscribe to all the views expressed within.
Reports based on technical and derivative analysis center on studying charts of a stock's price movement, outstanding positions and
trading volume, as opposed to focusing on a company's fundamentals and, as such, may not match with a report on a company's
fundamentals.
The information in this document has been printed on the basis of publicly available information, internal data and other reliable
sources believed to be true, but we do not represent that it is accurate or complete and it should not be relied on as such, as this
document is for general guidance only. Angel Broking Limited or any of its affiliates/ group companies shall not be in any way
responsible for any loss or damage that may arise to any person from any inadvertent error in the information contained in this report.
Angel Broking Limited has not independently verified all the information contained within this document. Accordingly, we cannot testify,
nor make any representation or warranty, express or implied, to the accuracy, contents or data contained within this document. While
Angel Broking Limited endeavours to update on a reasonable basis the information discussed in this material, there may be regulatory,
compliance, or other reasons that prevent us from doing so.
This document is being supplied to you solely for your information, and its contents, information or data may not be reproduced,
redistributed or passed on, directly or indirectly.
Angel Broking Limited and its affiliates may seek to provide or have engaged in providing corporate finance, investment banking or
other advisory services in a merger or specific transaction to the companies referred to in this report, as on the date of this report or in
the past.
Neither Angel Broking Limited, nor its directors, employees or affiliates shall be liable for any loss or damage that may arise from or in
connection with the use of this information.
Note: Please refer to the important `Stock Holding Disclosure' report on the Angel website (Research Section). Also, please refer to the
latest update on respective stocks for the disclosure status in respect of those stocks. Angel Broking Limited and its affiliates may have
investment positions in the stocks recommended in this report.
Research Team
Shardul Kulkarni
-
Head - Technicals
Sameet Chavan
-
Technical Analyst
Sacchitanand Uttekar
-
Technical Analyst
Mehul Kothari
-
Technical Analyst
Ankur Lakhotia
-
Technical Analyst
Angel Broking Pvt. Ltd.
Registered Office: G-1, Ackruti Trade Centre, Rd. No. 7, MIDC, Andheri (E), Mumbai - 400 093.
Corporate Office: 6th Floor, Ackruti Star, MIDC, Andheri (E), Mumbai - 400 093. Tel: (022) 3952 6600
Sebi Registration No: INB 010996539
4