Daily Technical Report
December 24, 2012
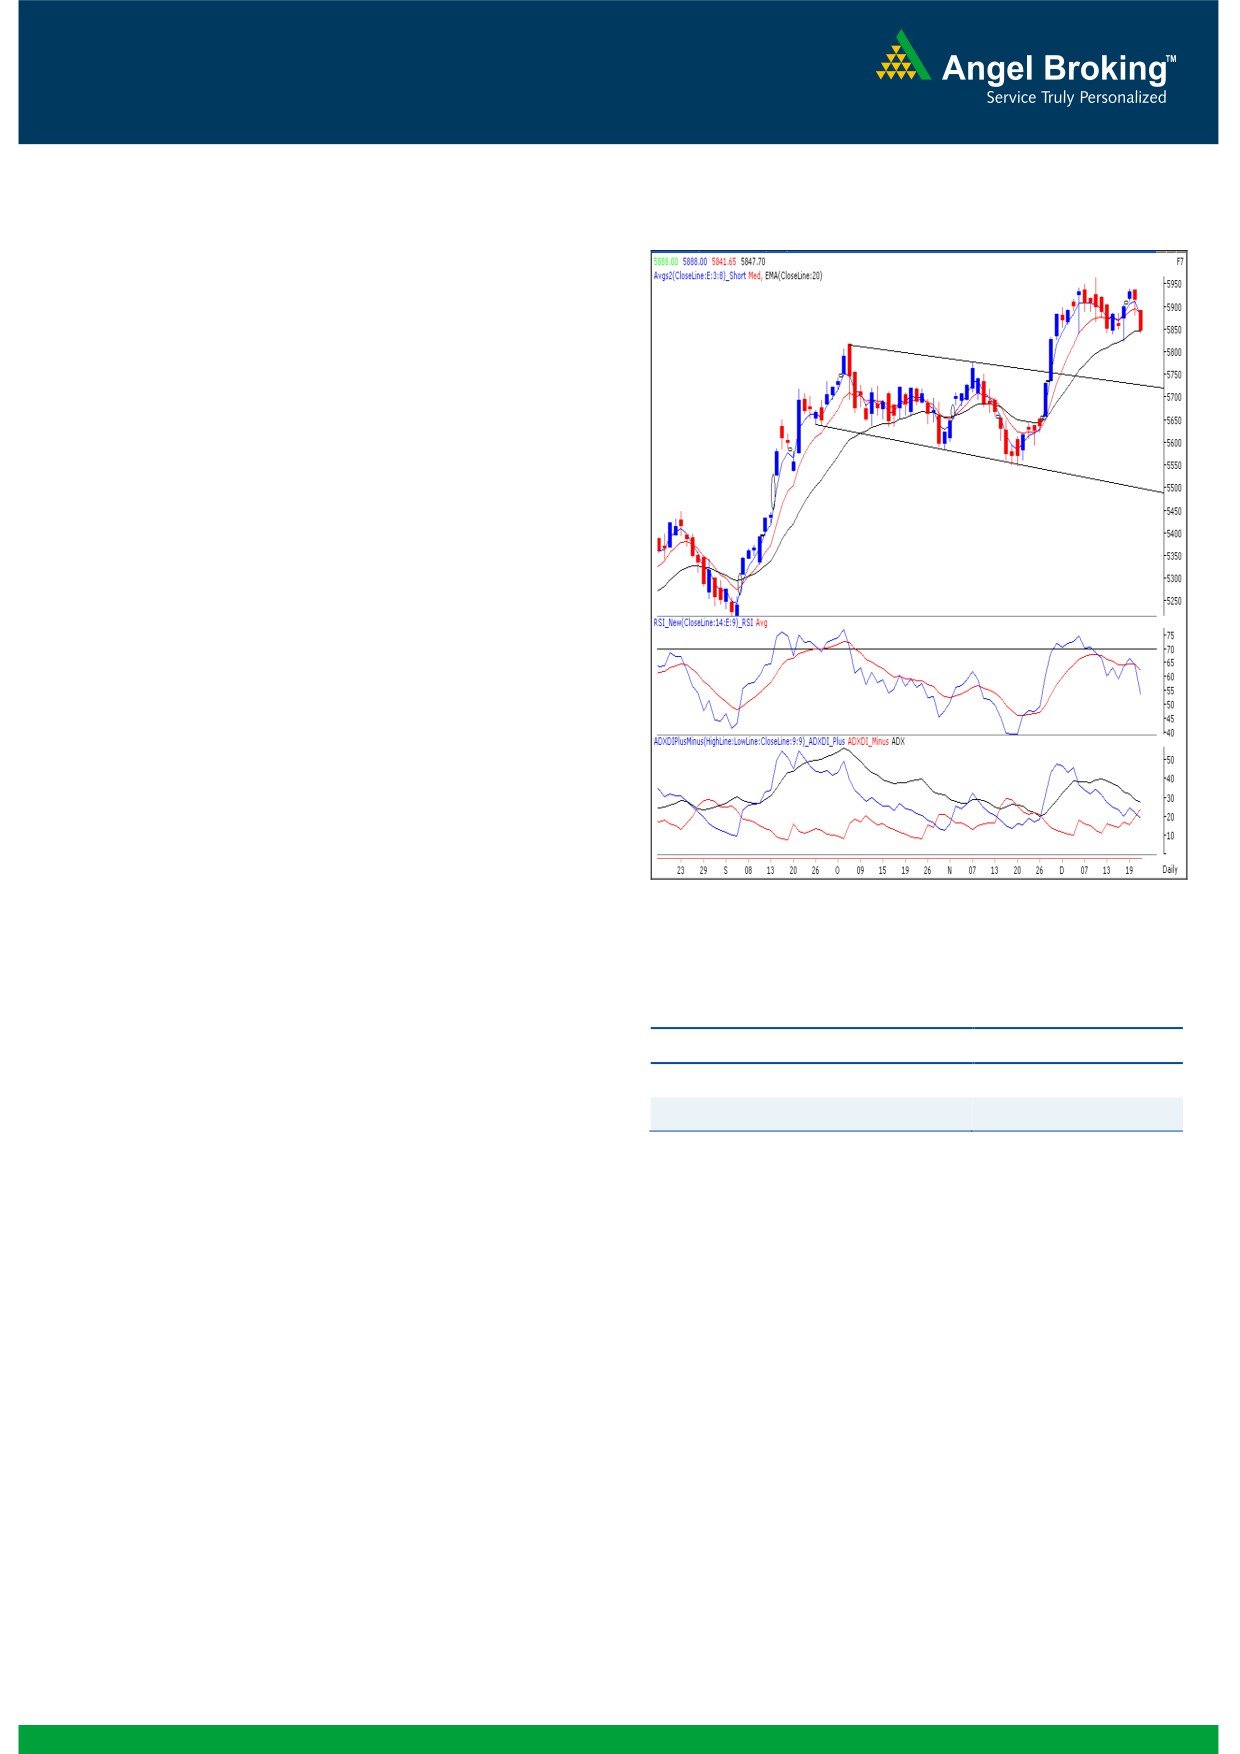
Exhibit 1: Nifty Daily Chart
Sensex (19242) / NIFTY (5848)
On Friday, our benchmark indices traded with negative bias
throughout the day to close with a loss of more than a
percent. This was primarily on the back of negative sentiment
in global markets. Realty was the most beaten down sector,
followed by Metal and Healthcare counters. Unfortunately
not even a single sector closed in green territory. The
advance to decline ratio was strongly in favor of declining
Formation
The ’20-day EMA’ and the ’20-week EMA’ are placed at
19212 / 5845 and 18552 / 5636 levels, respectively.
On the weekly chart, we are witnessing a breakout from
‘Downward Sloping Trend Line’ joining two significant
swing highs of 19811 / 5944 (April 2011) and 19137 /
5815 (Oct 2012) at 19050 / 5800 level.
The 38.20% and 50% Fibonacci retracement levels of
the rise from 18255 / 5548 (low on November 20,
2012) to 19612 / 5965 (high on December 11, 2012)
are at 19100 - 18930 / 5806 - 5755, respectively.
Source: Falcon:
The daily ‘RSI’ oscillator, ‘3 & 8 day EMA’ and the daily
ADX (9) indicator are negatively poised.
Actionable points:
Trading strategy:
The price movement during the week was mainly driven by
View for the day
Neutral
few domestic as well as global events. Our benchmark
Resistance Level
5888 - 5906
indices tested both the upper as well as the lower band of the
Support Levels
5823 - 5806
trading range 19613 / 5965 - 19193 / 5839 mentioned in
our previous report. Similar to last week, indices have closed
precisely at the strong support of ’20 - Day EMA’. However,
A move beyond this level would result in an extended rally
this time the price structure along with few technical tools,
towards 20050 - 20218 / 6000 - 6070 levels. Considering the
such as the daily momentum oscillators, ‘3 & 8 EMA’ and the
overall weekly chart structure we continue to remain positive on
ADX (9), indicate a relatively higher probability of a short
the market and any corrective move towards 19000 - 18900 /
term correction in the market. The said possibility will be
5800 - 5750 levels should be used by positional traders as a
confirmed only if indices sustain below last week’s low of
buying opportunity.
19149 / 5823. In this scenario, we may witness a downward
Generally, it is observed that during the last week of the
corrective move towards 19100 - 18930 / 5806 - 5755.
December month, the volume activity is very low and hence,
These levels are the 38.20% and 50% Fibonacci retracement
market’s trading range becomes narrower towards the year
levels of the rise from 18255 / 5548 (low on November 20,
end. However any adverse developments in the US, with
2012) to 19612 / 5965 (high on December 11, 2012),
regards to the ‘Fiscal Cliff’ may result in enhanced volatility in
respectively. On the flipside, last week’s high of 19612 /
the market.
5965 would act as a strong resistance in the coming trading
sessions.
1
Daily Technical Report
December 24, 2012
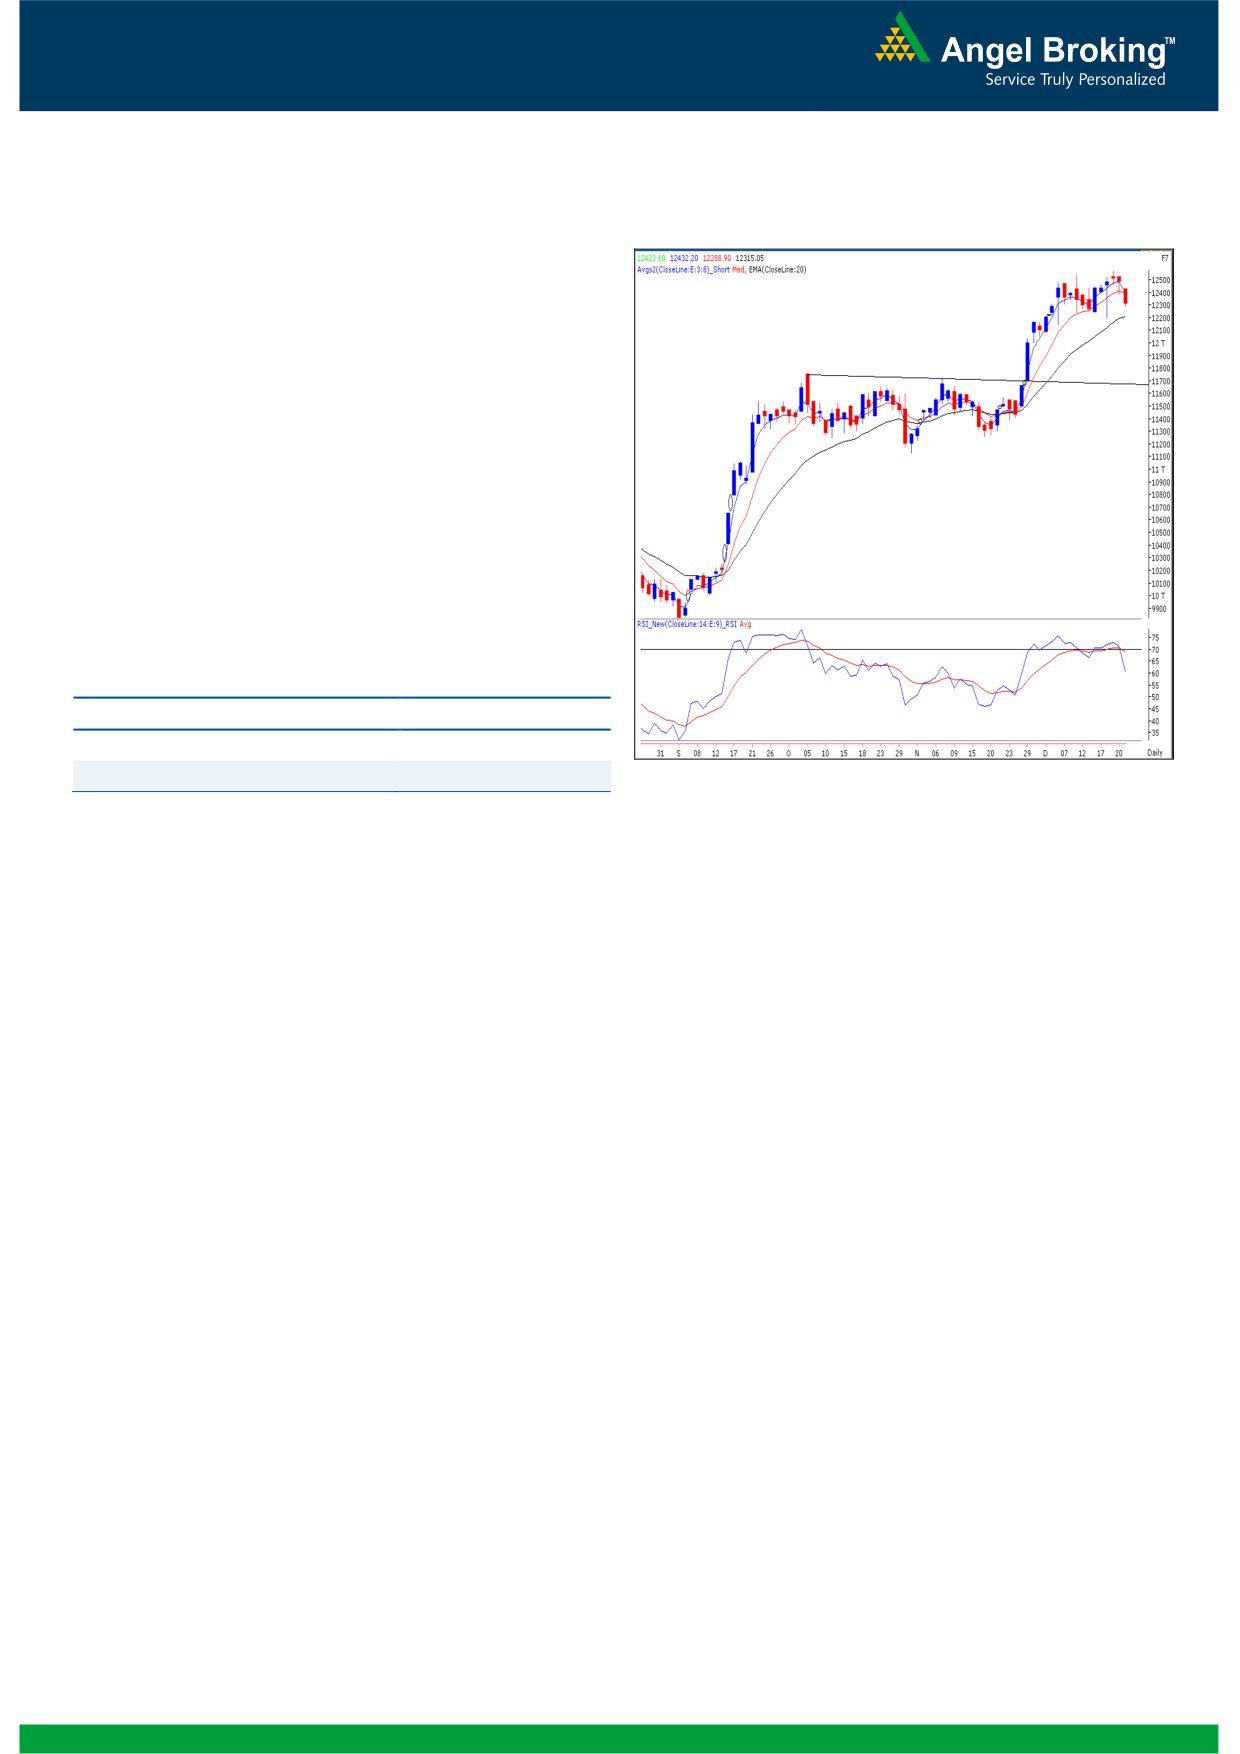
Exhibit 2: Bank Nifty Daily Chart
Bank Nifty Outlook - (12315)
On Friday, Bank Nifty opened on a pessimistic note in line
with our benchmark indices and selling pressure throughout
the session led the index to close near day’s low. The impact
of negative divergence in “RSI” momentum oscillator on the
daily chart was seen once the index slipped below 11385
mark. We reiterate our view that the index is likely to trade in
the range of 12568 - 12197 level. Within the mentioned
range, 12413 - 12457 levels are likely to act as intermediate
resistance levels and 12238 - 12197 may act as support for
the day.
Actionable points:
View for the day
Neutral
Resistance Levels
12413 - 12457
Support Levels
12238 - 12197
Source: Falcon:
2
Daily Technical Report
December 24, 2012
Daily Pivot Levels for Nifty 50 Stocks
SCRIPS
S2
S1
PIVOT
R1
R2
SENSEX
19,112
19,177
19,286
19,351
19,459
NIFTY
5,813
5,830
5,859
5,877
5,905
BANKNIFTY
12,202
12,259
12,345
12,402
12,489
ACC
1,375
1,386
1,394
1,406
1,414
AMBUJACEM
195
198
201
203
207
ASIANPAINT
4,282
4,319
4,378
4,415
4,473
AXISBANK
1,289
1,305
1,323
1,340
1,358
BAJAJ-AUTO
2,048
2,069
2,100
2,121
2,152
BANKBARODA
829
836
845
853
862
BHARTIARTL
300
304
309
313
318
BHEL
224
226
228
230
232
BPCL
338
341
345
348
353
CAIRN
304
308
314
318
323
CIPLA
411
415
423
427
435
COALINDIA
348
350
352
355
357
DLF
213
216
222
225
231
DRREDDY
1,791
1,806
1,827
1,842
1,863
GAIL
341
345
348
353
356
GRASIM
3,148
3,179
3,214
3,245
3,279
HCLTECH
619
625
632
637
644
HDFC
814
822
828
836
841
HDFCBANK
669
673
677
681
685
HEROMOTOCO
1,882
1,891
1,903
1,912
1,924
HINDALCO
125
127
130
132
135
HINDUNILVR
520
523
529
533
538
ICICIBANK
1,105
1,114
1,127
1,136
1,149
IDFC
165
167
170
172
176
INFY
2,267
2,282
2,302
2,317
2,336
ITC
278
283
286
291
294
JINDALSTEL
438
446
459
467
480
JPASSOCIAT
94
95
98
99
102
KOTAKBANK
638
644
653
658
667
LT
1,560
1,575
1,597
1,612
1,634
LUPIN
586
592
602
608
618
M&M
924
931
941
948
959
MARUTI
1,487
1,496
1,509
1,518
1,531
NTPC
152
152
153
154
155
ONGC
257
259
262
264
267
PNB
815
824
836
844
857
POWERGRID
114
114
115
115
116
RANBAXY
496
500
506
510
517
RELIANCE
815
820
827
832
840
RELINFRA
506
510
515
519
524
SBIN
2,297
2,316
2,346
2,365
2,395
SESAGOA
188
191
196
200
205
SIEMENS
651
655
661
666
672
SUNPHARMA
713
721
737
745
760
TATAMOTORS
295
297
300
303
306
TATAPOWER
104
105
106
107
109
TATASTEEL
419
425
431
436
442
TCS
1,227
1,243
1,254
1,270
1,280
ULTRACEMCO
1,949
1,969
1,993
2,013
2,037
WIPRO
373
376
380
383
387
3
Daily Technical Report
December 24, 2012
Research Team Tel: 022 - 39357800
DISCLAIMER
This document is solely for the personal information of the recipient, and must not be singularly used as the basis of any investment
decision. Nothing in this document should be construed as investment or financial advice. Each recipient of this document should make
such investigations as they deem necessary to arrive at an independent evaluation of an investment in the securities of the companies
referred to in this document (including the merits and risks involved), and should consult their own advisors to determine the merits and
risks of such an investment.
Angel Broking Limited, its affiliates, directors, its proprietary trading and investment businesses may, from time to time, make
investment decisions that are inconsistent with or contradictory to the recommendations expressed herein. The views contained in this
document are those of the analyst, and the company may or may not subscribe to all the views expressed within.
Reports based on technical and derivative analysis center on studying charts of a stock's price movement, outstanding positions and
trading volume, as opposed to focusing on a company's fundamentals and, as such, may not match with a report on a company's
fundamentals.
The information in this document has been printed on the basis of publicly available information, internal data and other reliable
sources believed to be true, but we do not represent that it is accurate or complete and it should not be relied on as such, as this
document is for general guidance only. Angel Broking Limited or any of its affiliates/ group companies shall not be in any way
responsible for any loss or damage that may arise to any person from any inadvertent error in the information contained in this report.
Angel Broking Limited has not independently verified all the information contained within this document. Accordingly, we cannot testify,
nor make any representation or warranty, express or implied, to the accuracy, contents or data contained within this document. While
Angel Broking Limited endeavours to update on a reasonable basis the information discussed in this material, there may be regulatory,
compliance, or other reasons that prevent us from doing so.
This document is being supplied to you solely for your information, and its contents, information or data may not be reproduced,
redistributed or passed on, directly or indirectly.
Angel Broking Limited and its affiliates may seek to provide or have engaged in providing corporate finance, investment banking or
other advisory services in a merger or specific transaction to the companies referred to in this report, as on the date of this report or in
the past.
Neither Angel Broking Limited, nor its directors, employees or affiliates shall be liable for any loss or damage that may arise from or in
connection with the use of this information.
Note: Please refer to the important `Stock Holding Disclosure' report on the Angel website (Research Section). Also, please refer to the
latest update on respective stocks for the disclosure status in respect of those stocks. Angel Broking Limited and its affiliates may have
investment positions in the stocks recommended in this report.
Research Team
Shardul Kulkarni
-
Head - Technicals
Sameet Chavan
-
Technical Analyst
Sacchitanand Uttekar
-
Technical Analyst
Mehul Kothari
-
Technical Analyst
Ankur Lakhotia
-
Technical Analyst
Angel Broking Pvt. Ltd.
Registered Office: G-1, Ackruti Trade Centre, Rd. No. 7, MIDC, Andheri (E), Mumbai - 400 093.
Corporate Office: 6th Floor, Ackruti Star, MIDC, Andheri (E), Mumbai - 400 093. Tel: (022) 3952 6600
Sebi Registration No: INB 010996539
4