Daily Technical Report
June 24, 2013
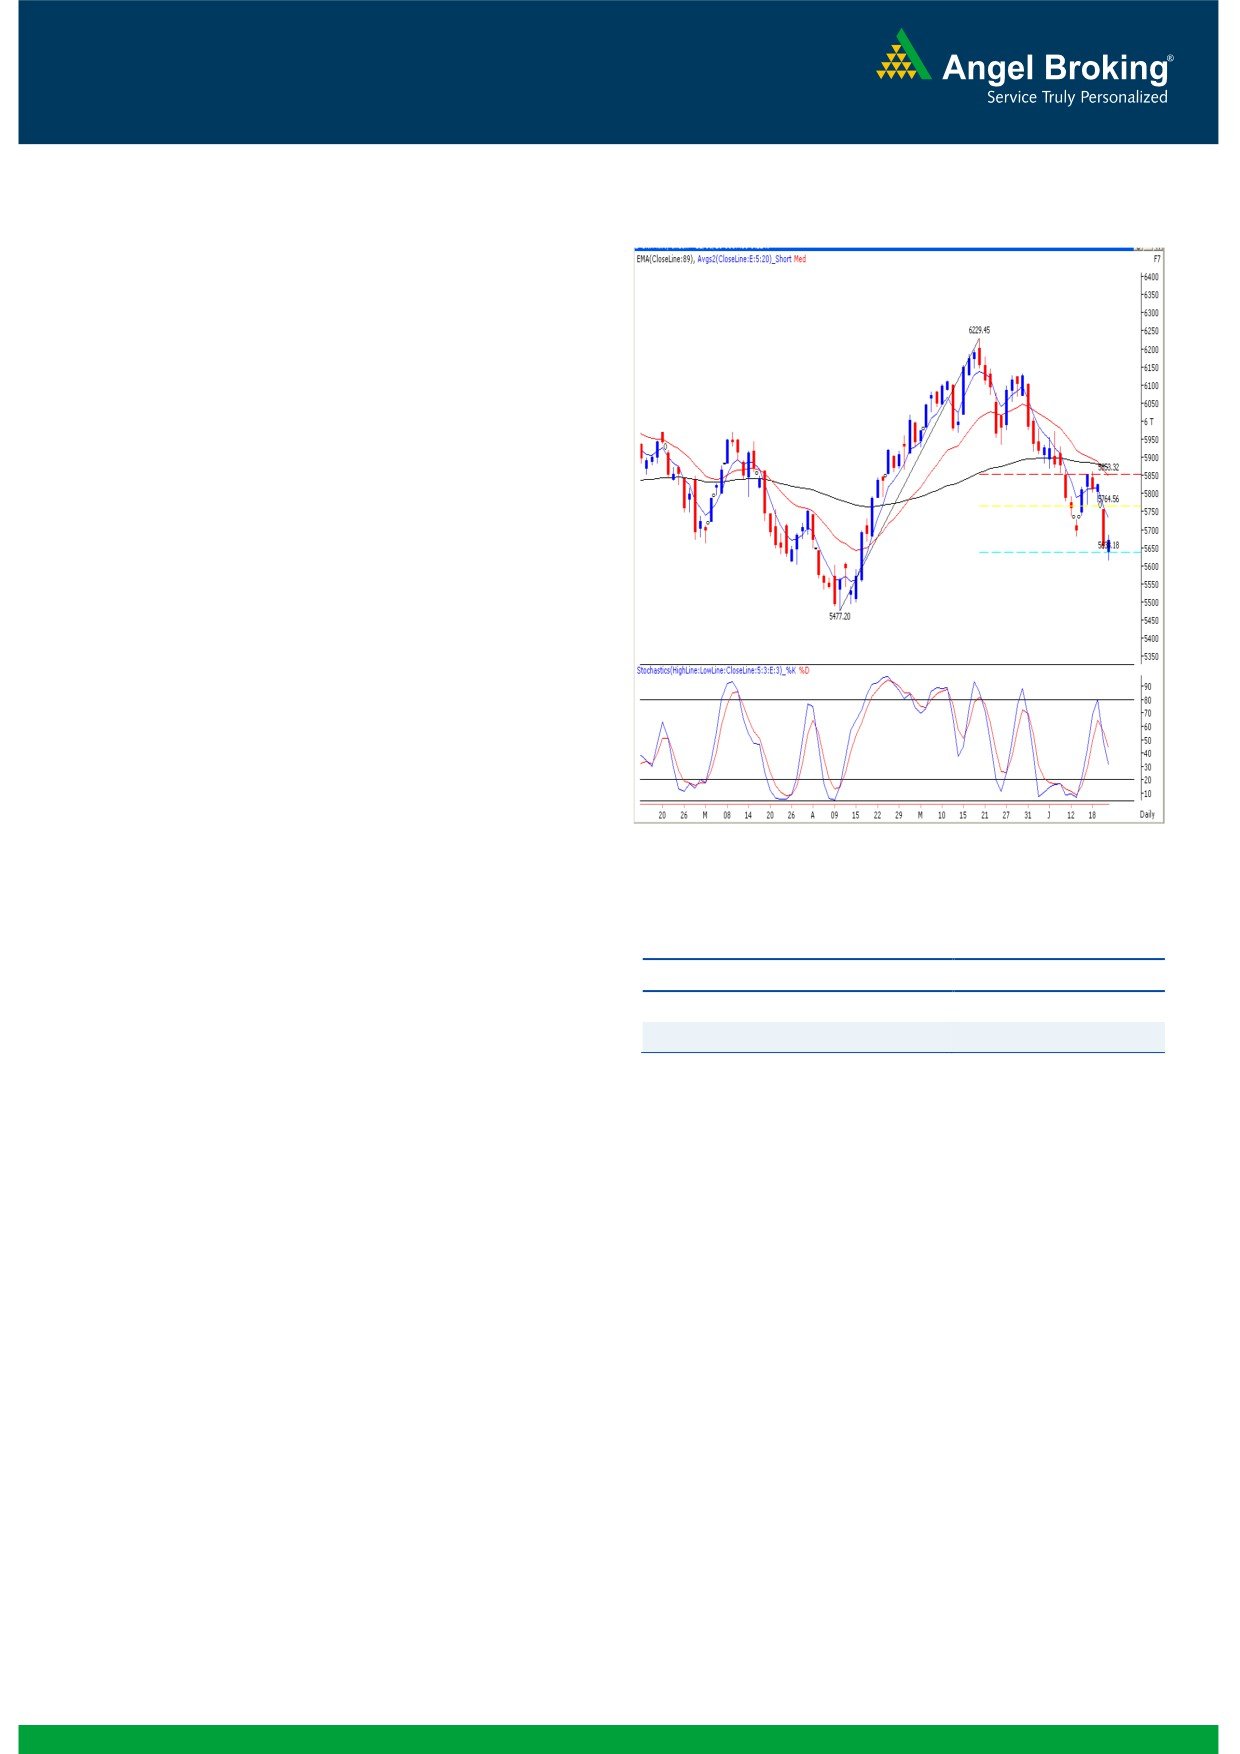
Exhibit 1: Nifty Daily Chart
Sensex (18774) / NIFTY (5668)
On Friday, our benchmark indices opened with a marginal
downside gap in line with global markets and drifted lower
to post a low of 18615 / 5616. However, decent buying
interest near day’s low eventually pushed market higher to
close with very nominal gains. The IT, Teck and Auto
counters supported the bulls, whereas Metal and Realty
sectors remained under pressure throughout the session. The
advance to decline ratio was strongly in favor of declining
counters.
(A=946 D=1381)
(Source-
Formation
The ’20-week EMA’ and the ’89-Week EMA’ are placed
at 19303/ 5850 and 18456/ 5585 levels, respectively.
The ’89-day EMA’ and the ‘200-day SMA’ are placed at
19378/ 5872 and 19167 / 5812, respectively.
The weekly ‘RSI-Smoothened’ oscillators, the ‘ADX (9)
Source: Falcon:
indicator and ‘5 & 20 EMA’ are now signaling a
negative crossover.
Actionable points:
The 78.6% Fibonacci retracement level of the rise from
18144 / 5477 to 20444 / 6230 is placed at 18636 /
View
Bearish below 5615
5638.
Expected Targets
5585 - 5550
Trading strategy:
Resistance Levels
5686 - 5730
This was the fifth consecutive week that ruled in favor of the
bears. The negative developments on the global as well as
In this scenario, the negative momentum may get reinforced
domestic front have significantly dampened trader
and indices may fall towards April lows of 18144 / 5477.
sentiments. Looking at the weekly chart, it is clearly seen that
On the flipside, only a sustainable move beyond last week’s
our benchmark indices are now hovering around the lower
high of
19384
/
5863 would negate this hypothesis.
end of an upward sloping "Channel" pattern. (Please refer
Considering the ongoing weakness in the Rupee and global
exhibit 1). Moreover, it is also trading marginally above the
scenario, we advise traders to stay light on positions and
weekly ’89 EMA’ placed at 18456 / 5585 levels. Hence,
trade with strict stop losses.
18615 - 18456 / 5615 - 5585 levels may act as a strong
support zone for our benchmark indices. However, on the
weekly chart, we are observing that the ‘RSI-Smoothened’
momentum oscillator, the ‘ADX (9)’ indicator and ‘5 & 20
EMA’ are negatively poised. The impact of these technical
evidences would be seen if indices sustain below the lower
range of 18456 / 5585.
1
Daily Technical Report
June 24, 2013
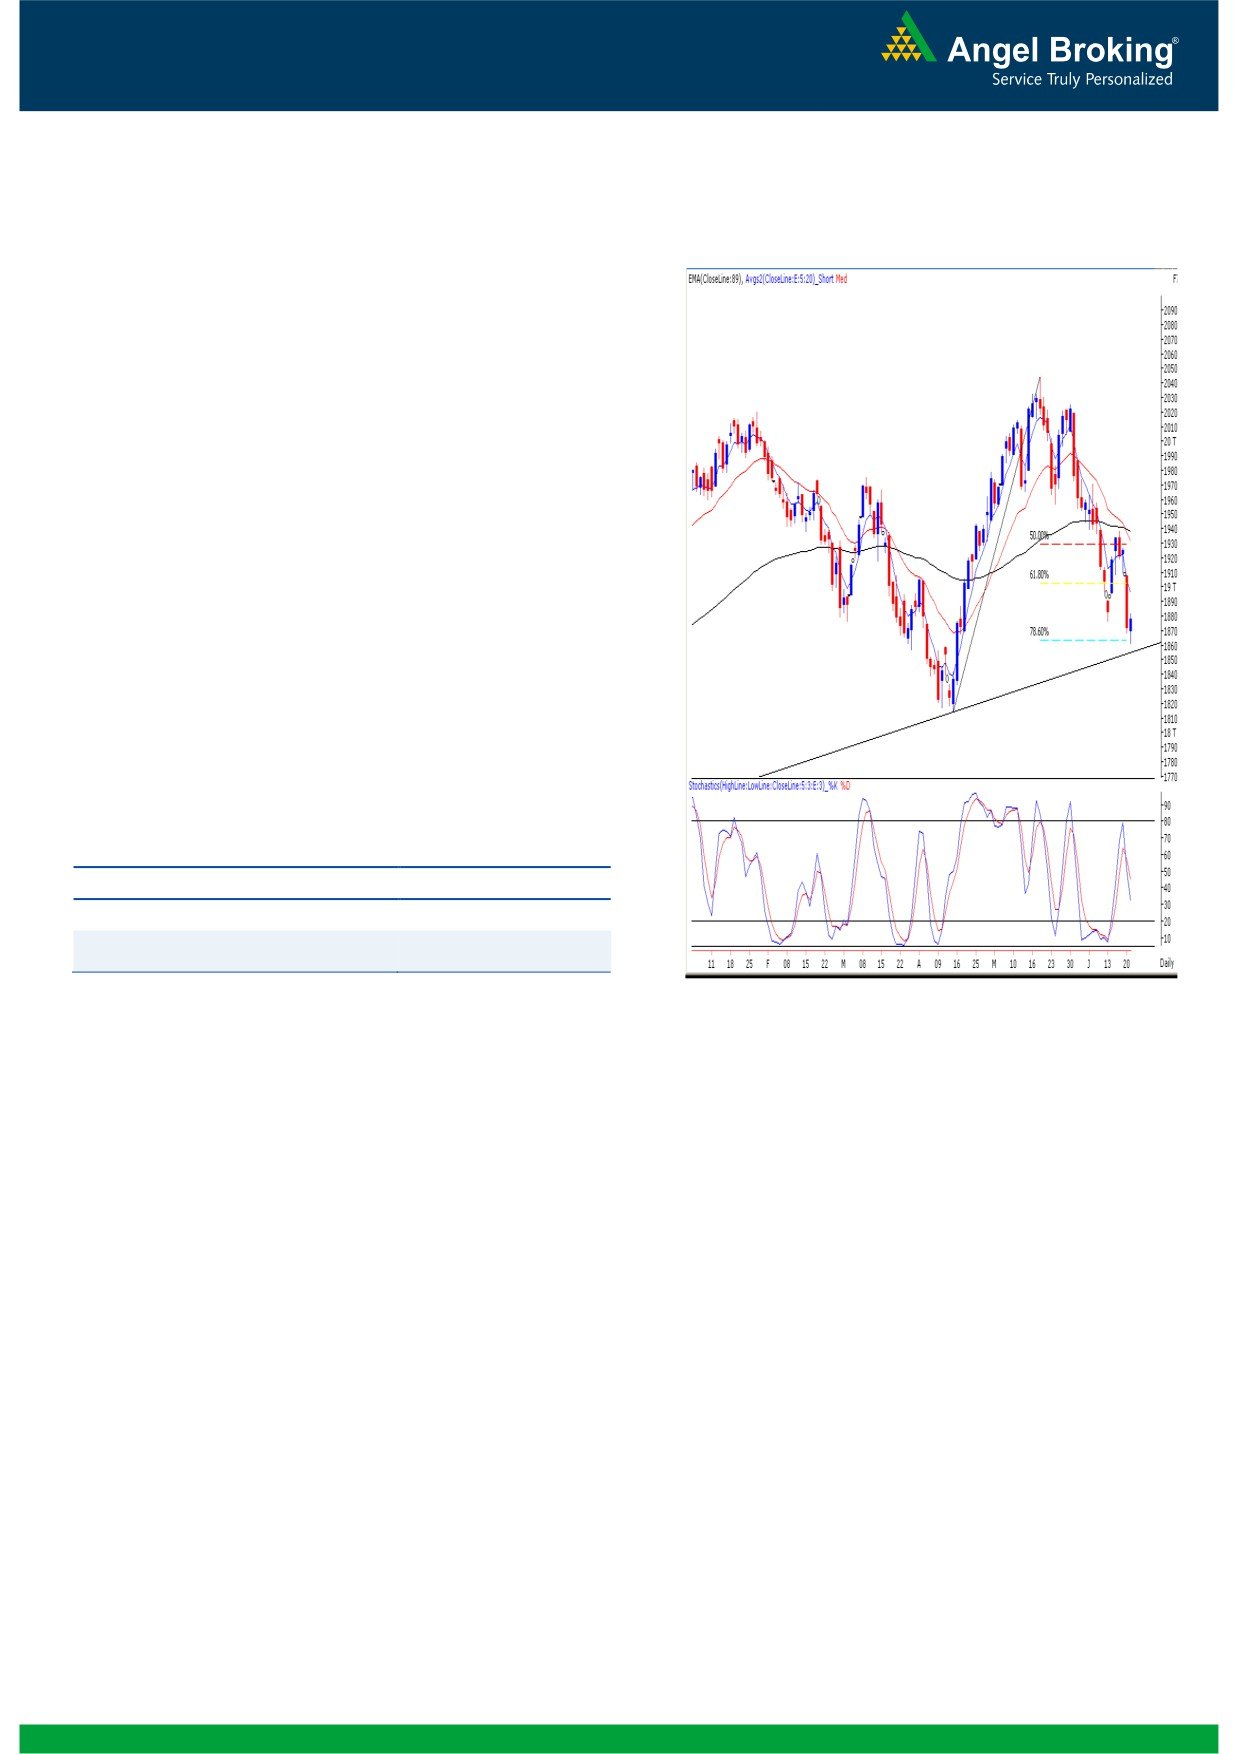
Exhibit 2: Bank Nifty Daily Chart
Bank Nifty Outlook - (11340)
On Friday, the Bank Nifty too opened marginally lower and
continued Thursday’s pessimism during the first half. Despite
a sharp bounce in the last hour of trade, the Bank Nifty
eventually closed marginally in the negative territory. We
observed that the Bank Nifty bounced back after precisely
testing the weekly ’89-EMA’ level of 11235. Also, it is trading
marginally above the ‘Upward Sloping Trend Line’ drawn by
joining 9814 (low on September, 2012) and 10888 (low on
April 18, 2013). Hence, going forward, a sustainable move
below 11210 would trigger immense pessimism in the index.
In this scenario, it may slide towards 11000 - 10888. On the
flipside, the daily chart depicts a ‘Narrow Range’ body
formation. Hence, considering oversold condition of hourly
momentum oscillators, we may expect near term bounce only
if the Bank Nifty sustains above Friday’s high of 11420. In this
case, it may bounce towards 11588 - 11656.
Actionable points:
View
Neutral
Support Levels
11210 - 11000
Resistance Levels
11420 - 11588
Source: Falcon:
2
Daily Technical Report
June 24, 2013
Daily Pivot Levels for Nifty 50 Stocks
SCRIPS
S2
S1
PIVOT
R1
R2
SENSEX
18,531
18,653
18,737
18,858
18,942
NIFTY
5,588
5,628
5,657
5,697
5,726
BANKNIFTY
11,114
11,227
11,324
11,437
11,533
ACC
1,140
1,152
1,163
1,175
1,186
AMBUJACEM
178
182
185
189
191
ASIANPAINT
4,502
4,530
4,568
4,596
4,634
AXISBANK
1,206
1,233
1,251
1,278
1,297
BAJAJ-AUTO
1,770
1,800
1,819
1,849
1,868
BANKBARODA
516
533
557
573
597
BHARTIARTL
281
287
291
296
301
BHEL
164
167
171
174
178
BPCL
338
343
350
355
361
CAIRN
284
289
292
297
300
CIPLA
372
377
379
384
387
COALINDIA
290
294
298
302
305
DLF
166
171
175
179
183
DRREDDY
1,999
2,060
2,095
2,156
2,191
GAIL
281
285
290
295
300
GRASIM
2,690
2,737
2,768
2,814
2,846
HCLTECH
742
750
758
767
775
HDFC
793
807
815
829
838
HDFCBANK
624
629
636
642
648
HEROMOTOCO
1,545
1,586
1,615
1,656
1,685
HINDALCO
86
90
95
100
105
HINDUNILVR
586
588
591
594
597
ICICIBANK
1,016
1,031
1,040
1,055
1,064
IDFC
131
134
135
138
140
INDUSINDBK
430
447
458
475
486
INFY
2,346
2,382
2,407
2,444
2,469
ITC
314
318
322
326
329
JINDALSTEL
183
194
207
218
231
JPASSOCIAT
55
56
58
59
61
KOTAKBANK
712
721
729
738
747
LT
1,362
1,378
1,395
1,410
1,428
LUPIN
767
777
785
796
804
M&M
908
924
939
955
970
MARUTI
1,494
1,524
1,542
1,572
1,590
NMDC
100
103
104
107
108
NTPC
136
139
142
145
148
ONGC
293
300
305
312
316
PNB
639
653
674
688
709
POWERGRID
104
106
107
108
109
RANBAXY
334
342
346
354
358
RELIANCE
769
781
796
808
822
RELINFRA
314
323
335
344
357
SBIN
1,946
1,967
1,988
2,010
2,031
SESAGOA
132
135
138
142
145
SUNPHARMA
926
937
954
965
982
TATAMOTORS
279
283
286
290
293
TATAPOWER
78
80
82
84
87
TATASTEEL
260
266
271
277
282
TCS
1,397
1,410
1,421
1,433
1,445
ULTRACEMCO
1,753
1,783
1,806
1,836
1,859
3
Daily Technical Report
June 24, 2013
Research Team Tel: 022 - 30940000
DISCLAIMER
This document is solely for the personal information of the recipient, and must not be singularly used as the basis of any investment
decision. Nothing in this document should be construed as investment or financial advice. Each recipient of this document should make
such investigations as they deem necessary to arrive at an independent evaluation of an investment in the securities of the companies
referred to in this document (including the merits and risks involved), and should consult their own advisors to determine the merits and
risks of such an investment.
Angel Broking Limited, its affiliates, directors, its proprietary trading and investment businesses may, from time to time, make
investment decisions that are inconsistent with or contradictory to the recommendations expressed herein. The views contained in this
document are those of the analyst, and the company may or may not subscribe to all the views expressed within.
Reports based on technical and derivative analysis center on studying charts of a stock's price movement, outstanding positions and
trading volume, as opposed to focusing on a company's fundamentals and, as such, may not match with a report on a company's
fundamentals.
The information in this document has been printed on the basis of publicly available information, internal data and other reliable
sources believed to be true, but we do not represent that it is accurate or complete and it should not be relied on as such, as this
document is for general guidance only. Angel Broking Limited or any of its affiliates/ group companies shall not be in any way
responsible for any loss or damage that may arise to any person from any inadvertent error in the information contained in this report.
Angel Broking Limited has not independently verified all the information contained within this document. Accordingly, we cannot testify,
nor make any representation or warranty, express or implied, to the accuracy, contents or data contained within this document. While
Angel Broking Limited endeavors to update on a reasonable basis the information discussed in this material, there may be regulatory,
compliance, or other reasons that prevent us from doing so.
This document is being supplied to you solely for your information, and its contents, information or data may not be reproduced,
redistributed or passed on, directly or indirectly.
Angel Broking Limited and its affiliates may seek to provide or have engaged in providing corporate finance, investment banking or
other advisory services in a merger or specific transaction to the companies referred to in this report, as on the date of this report or in
the past.
Neither Angel Broking Limited, nor its directors, employees or affiliates shall be liable for any loss or damage that may arise from or in
connection with the use of this information.
Note: Please refer to the important `Stock Holding Disclosure' report on the Angel website (Research Section). Also, please refer to the
latest update on respective stocks for the disclosure status in respect of those stocks. Angel Broking Limited and its affiliates may have
investment positions in the stocks recommended in this report.
Research Team
Shardul Kulkarni
-
Head - Technicals
Sameet Chavan
-
Technical Analyst
Sacchitanand Uttekar
-
Technical Analyst
Angel Broking Pvt. Ltd.
Registered Office: G-1, Ackruti Trade Centre, Rd. No. 7, MIDC, Andheri (E), Mumbai - 400 093.
Corporate Office: 6th Floor, Ackruti Star, MIDC, Andheri (E), Mumbai - 400 093. Tel: (022) 30940000
Sebi Registration No: INB 010996539
4