Daily Technical Report
May 23, 2013
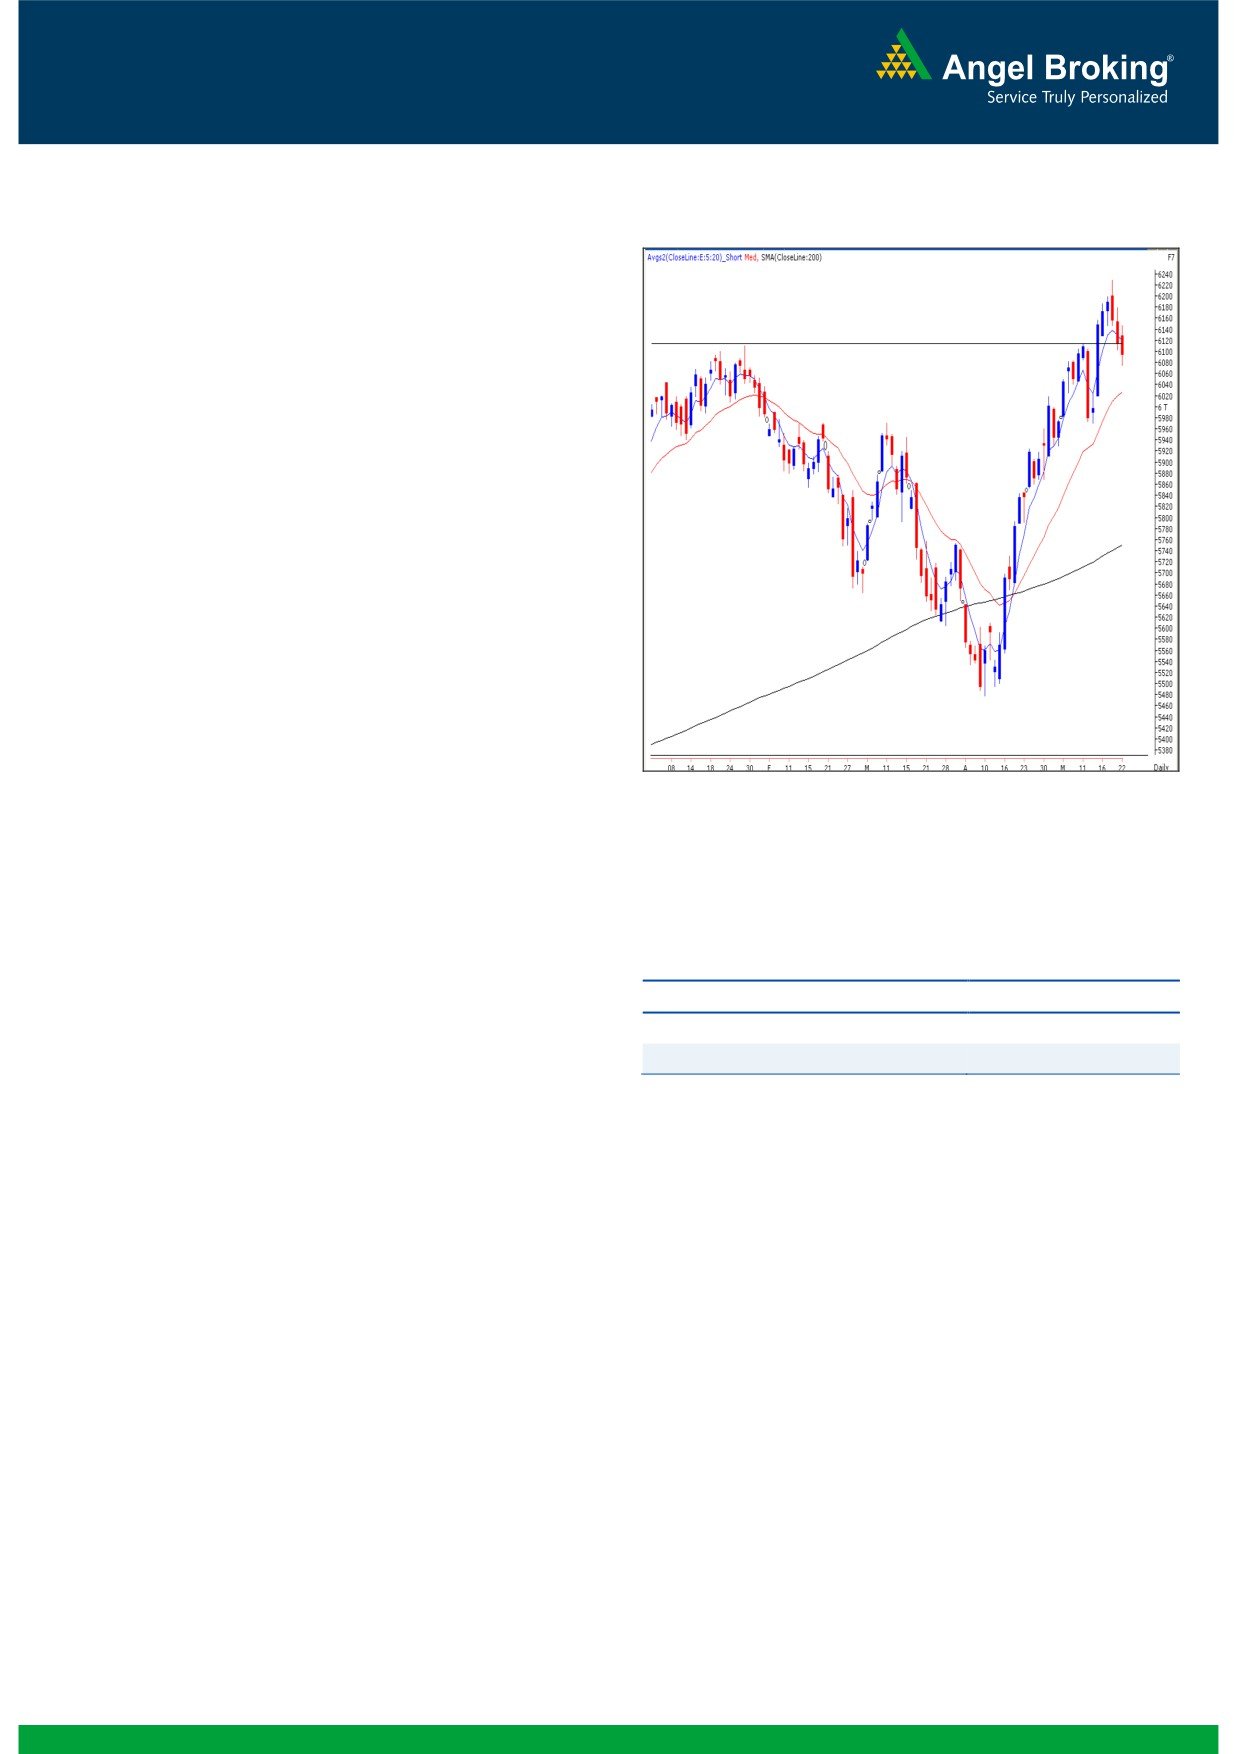
Exhibit 1: Nifty Daily Chart
Sensex (20062) / NIFTY (6095)
Yesterday, our benchmark indices opened slightly higher in-
line with mixed global cues. During the first half, indices
oscillated within a very narrow trading range; but post
midsession came off very sharply to close well inside the
negative territory. For the day FMCG and Health Care stocks
were among the major gainers, whereas Capital Goods and
Realty sectors ended in the red. The advance to decline ratio
was strongly in favor of declining counters. (A=867
D=1449)
Formation
The ’20-week EMA’ and the ’20-day EMA’ are placed at
19366/ 5875 and 19829/ 6026 levels, respectively.
The ’89-day EMA’ and the ‘200-day SMA’ are placed at
19354/ 5873 and 18912 / 5749, respectively.
Source: Falcon:
The weekly ‘RSI-Smoothened’ oscillator remains
positively poised.
Trading strategy:
Actionable points:
The bulls made a valiant attempt to move higher in the first
View
Neutral
half of yesterday’s session. However, post midsession, lower-
Resistance level
6148
than-expected results from the capital goods heavyweight,
Support Levels
6074 - 6046 - 6018
Larsen & Toubro put pressure on the bulls. In our previous
report, we had mentioned a possibility of some weakness
below 20048 / 6100. Indices then precisely met with our
target of 19955 / 6070, which coincides with the hourly ’89
EMA’ and as expected, found decent support for the day.
Going forward, if indices sustain below yesterday's low of
20000 / 6074 then a further correction towards 19870 -
19760 / 6046 - 6018 is possible. Conversely, yesterday’s
high of 20220 / 6148 would act as immediate intraday
resistance for our market.
1
Daily Technical Report
May 23, 2013
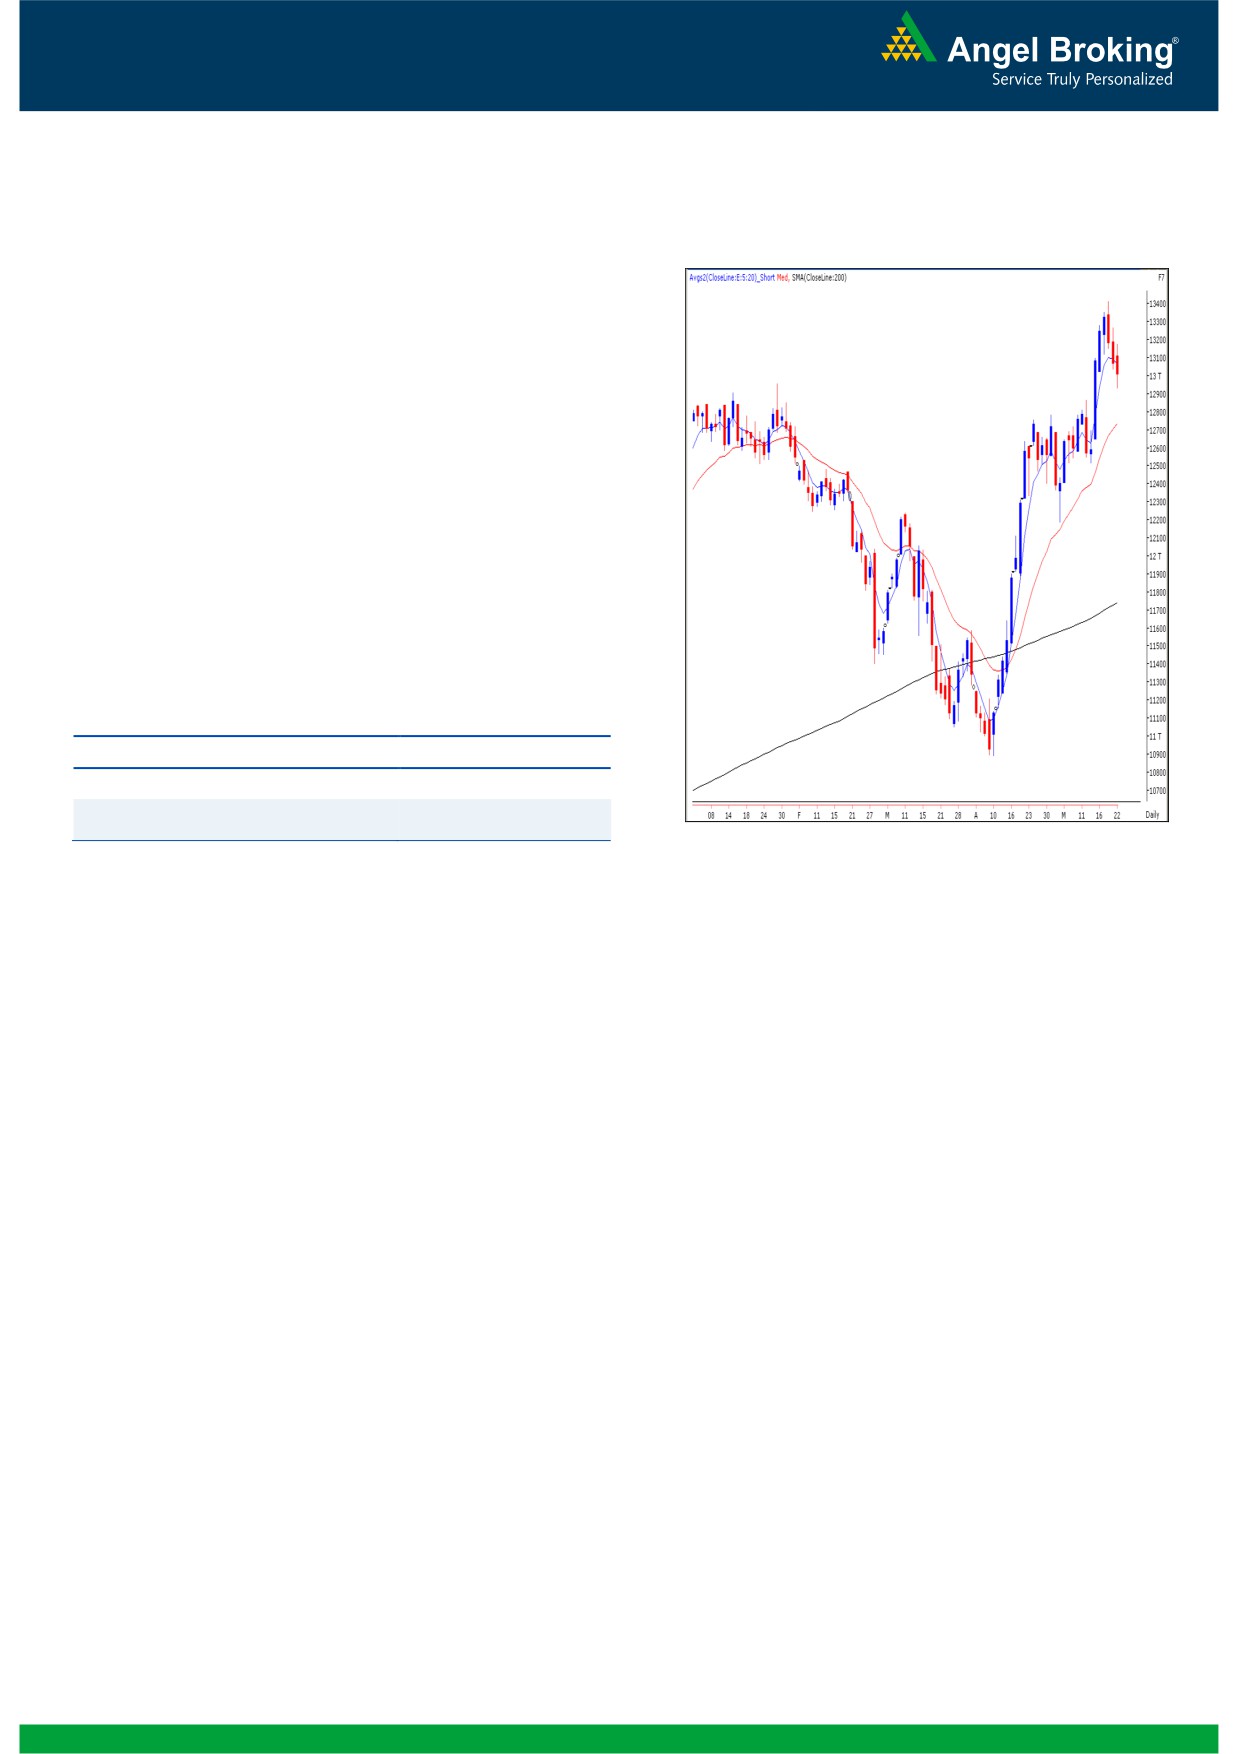
Exhibit 2: Bank Nifty Daily Chart
Bank Nifty Outlook - (13008)
Yesterday, Bank Nifty opened on a quite note in line with
our benchmark indices and traded in a narrow range
during first half of the session. However during the second
half we witnessed selling pressure in all the banking stocks
which led the index to test the mentioned level of 12928.
The coming session is likely to be volatile on account of
quarterly results for SBI. Thus going forward, a move
below 12928 levels would trigger further downside in the
index. In this scenario the index is likely to test 12838 -
12776 levels. On the upside 13160 - 13225 levels are
likely to act as resistance for the day.
Actionable points:
View
Neutral
Resistance Levels
13160 - 13225
Support Levels
12928 - 12838
Source: Falcon:
2
Daily Technical Report
May 23, 2013
Research Team Tel: 022 - 30940000
DISCLAIMER
This document is solely for the personal information of the recipient, and must not be singularly used as the basis of any investment
decision. Nothing in this document should be construed as investment or financial advice. Each recipient of this document should make
such investigations as they deem necessary to arrive at an independent evaluation of an investment in the securities of the companies
referred to in this document (including the merits and risks involved), and should consult their own advisors to determine the merits and
risks of such an investment.
Angel Broking Limited, its affiliates, directors, its proprietary trading and investment businesses may, from time to time, make
investment decisions that are inconsistent with or contradictory to the recommendations expressed herein. The views contained in this
document are those of the analyst, and the company may or may not subscribe to all the views expressed within.
Reports based on technical and derivative analysis center on studying charts of a stock's price movement, outstanding positions and
trading volume, as opposed to focusing on a company's fundamentals and, as such, may not match with a report on a company's
fundamentals.
The information in this document has been printed on the basis of publicly available information, internal data and other reliable
sources believed to be true, but we do not represent that it is accurate or complete and it should not be relied on as such, as this
document is for general guidance only. Angel Broking Limited or any of its affiliates/ group companies shall not be in any way
responsible for any loss or damage that may arise to any person from any inadvertent error in the information contained in this report.
Angel Broking Limited has not independently verified all the information contained within this document. Accordingly, we cannot testify,
nor make any representation or warranty, express or implied, to the accuracy, contents or data contained within this document. While
Angel Broking Limited endeavors to update on a reasonable basis the information discussed in this material, there may be regulatory,
compliance, or other reasons that prevent us from doing so.
This document is being supplied to you solely for your information, and its contents, information or data may not be reproduced,
redistributed or passed on, directly or indirectly.
Angel Broking Limited and its affiliates may seek to provide or have engaged in providing corporate finance, investment banking or
other advisory services in a merger or specific transaction to the companies referred to in this report, as on the date of this report or in
the past.
Neither Angel Broking Limited, nor its directors, employees or affiliates shall be liable for any loss or damage that may arise from or in
connection with the use of this information.
Note: Please refer to the important `Stock Holding Disclosure' report on the Angel website (Research Section). Also, please refer to the
latest update on respective stocks for the disclosure status in respect of those stocks. Angel Broking Limited and its affiliates may have
investment positions in the stocks recommended in this report.
Research Team
Shardul Kulkarni
-
Head - Technicals
Sameet Chavan
-
Technical Analyst
Sacchitanand Uttekar
-
Technical Analyst
Ankur Lakhotia
-
Technical Analyst
Angel Broking Pvt. Ltd.
Registered Office: G-1, Ackruti Trade Centre, Rd. No. 7, MIDC, Andheri (E), Mumbai - 400 093.
Corporate Office: 6th Floor, Ackruti Star, MIDC, Andheri (E), Mumbai - 400 093. Tel: (022) 30940000
Sebi Registration No: INB 010996539
4