Daily Technical Report
April 23, 2013
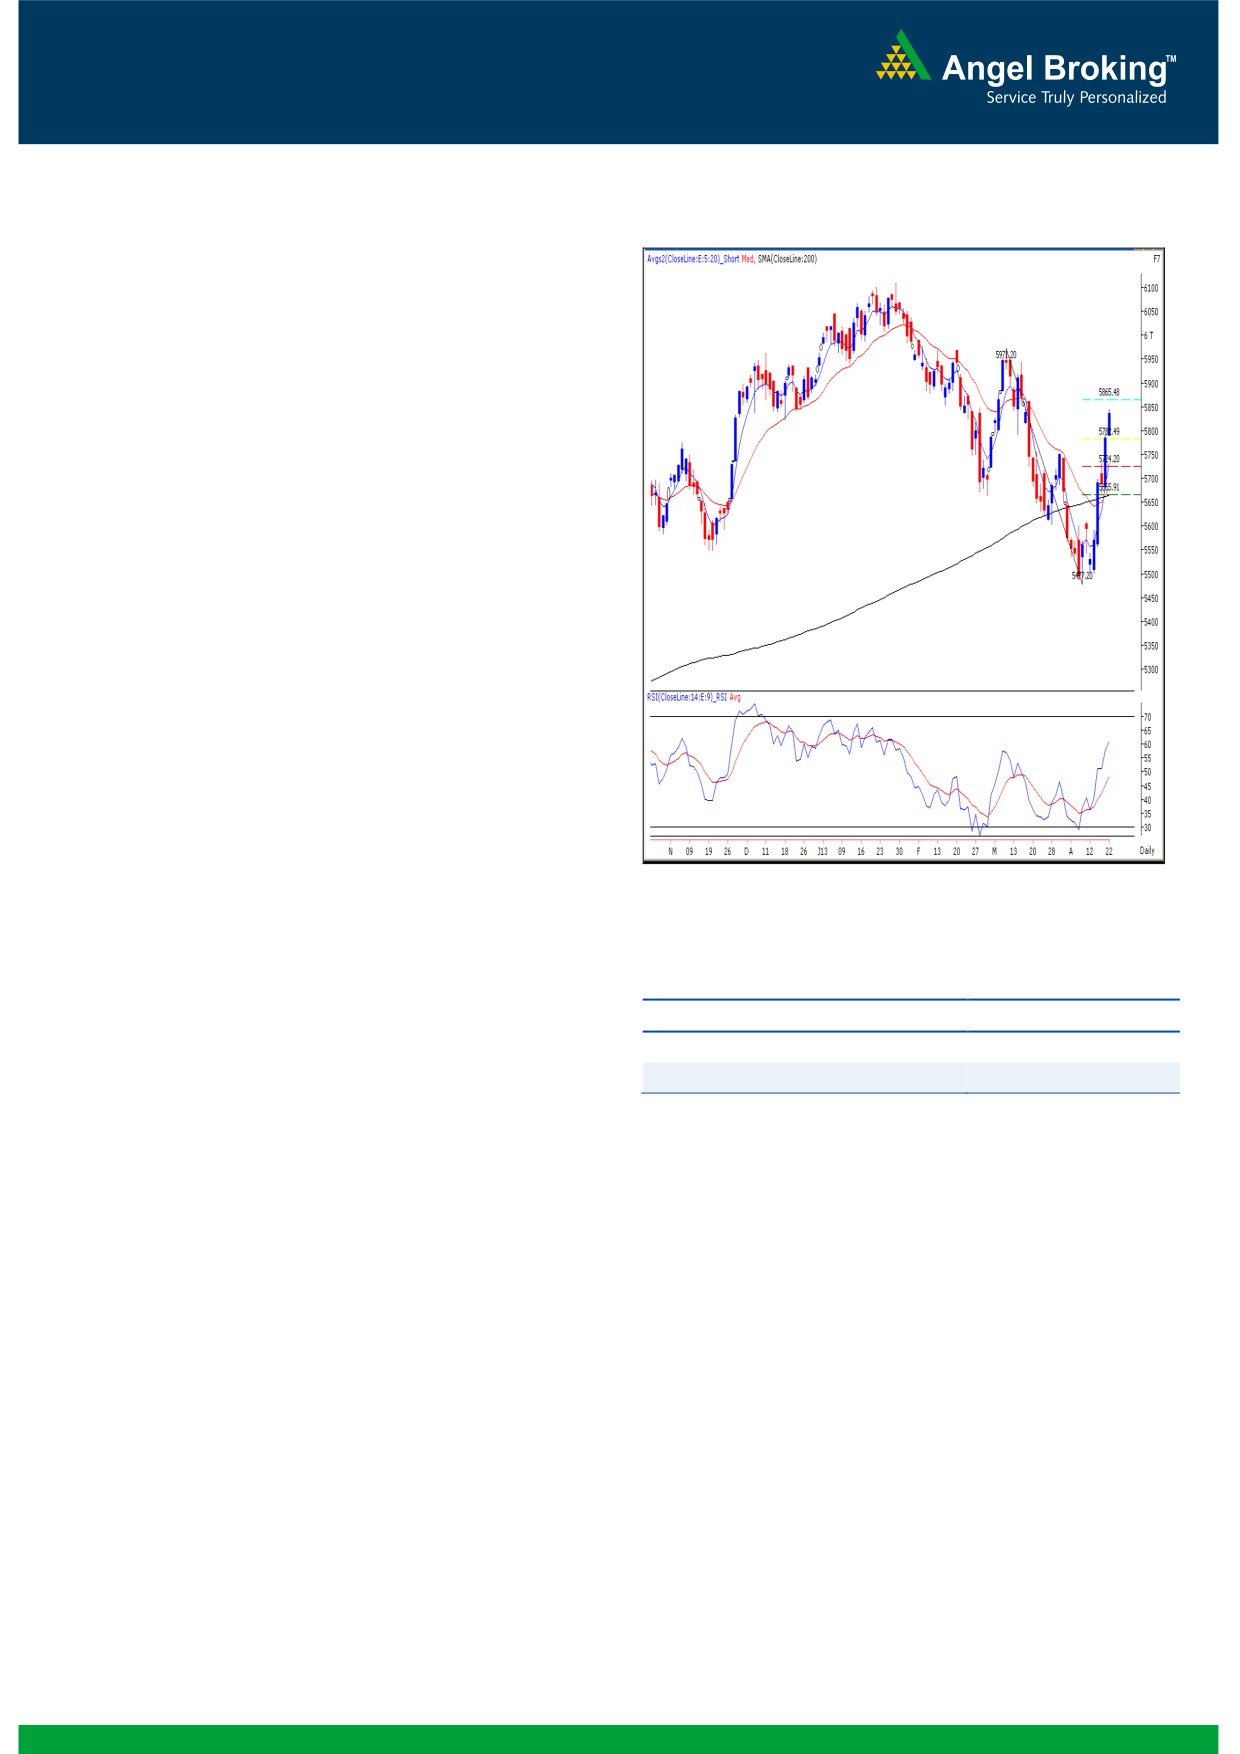
Exhibit 1: Nifty Daily Chart
Sensex (19170) / NIFTY (5834)
The first session of the week opened on a flat note in-line
with quiet mood across the globe. Subsequently Indices
inched higher through the session and a sharp up move
towards the fag end led to close almost at the highest point
of the day. During the day, once again banking stocks led
the rally along with Consumer Durables and Capital Goods
counters; whereas IT sector remained under pressure. The
advance to decline ratio was strongly in favor of advancing
Formation
The ’20-week EMA’ and the ’20-day EMA’ are placed at
19012 / 5756 and 18723 / 5662 levels, respectively.
The ’89-week EMA’ and the ‘200-day SMA’ are placed
at 18203 / 5506 and 18657 / 5656, respectively.
The ’89-day EMA’ and the ‘200-day SMA’ are placed at
19044 / 5764 and 18674 / 5661, respectively.
The ‘Lower Top - Lower Bottom’ formation on the weekly
Source: Falcon:
chart is still intact.
The weekly momentum oscillators and daily ‘5 & 20
Actionable points:
EMA’ have signaled a positive crossover.
View
Neutral
The 61.8% Fibonacci retracement level of the fall from
Resistance levels
5850 - 5870
20204 / 6112 to 18144 / 5477 is placed at 19416 /
Support level
5789
5870.
Trading strategy:
On the downside, yesterday’s low of 18989 / 5789 would
Yesterday, as expected, indices continued to progress higher
act as immediate support level for the market. Only a
after breaking Thursday’s high of 19061 / 5794 and moved
sustainable move below this support would trigger intraday
beyond our immediate target of 19200 / 5815. Indices are
pessimism in the market. In this scenario, indices may test
now gradually moving towards the mentioned resistance
18950 / 5765 level.
level of 19416 / 5870, which is the 61.80% Fibonacci
retracement level of the fall from 20204 / 6112 to 18144 /
5477. Hence, we maintain our view that traders to book
partial profits around this level and trade with strict stop
losses for the remaining positions. However, in case of
extreme optimism, if the indices manage to stay above
19416 / 5870 levels, then they may even test 19755 / 5971.
1
Daily Technical Report
April 23, 2013
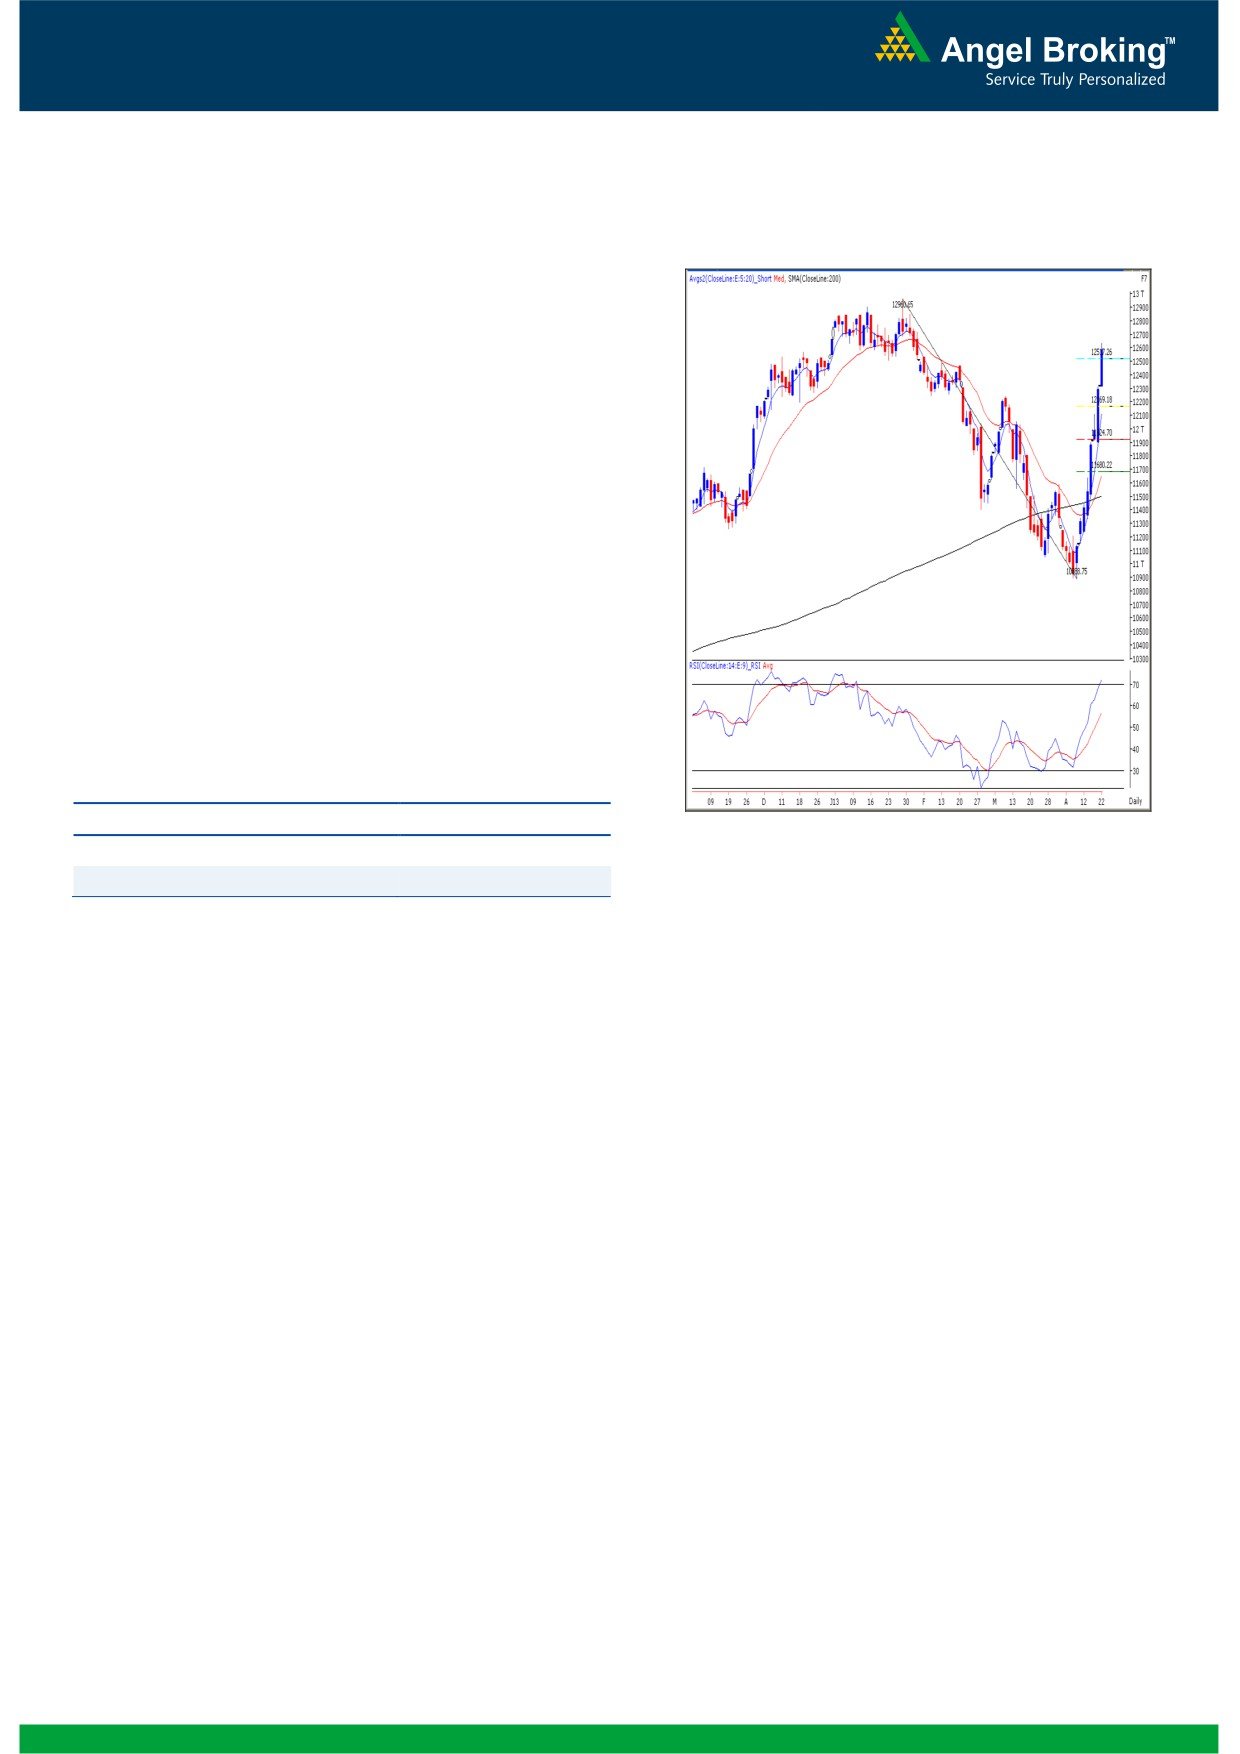
Exhibit 2: Bank Nifty Daily Chart
Bank Nifty Outlook - (12576)
Yesterday, Bank Nifty too opened on a flat note in-line with
the benchmark indices. The Bank Nifty has played a vital role
in the up move seen in our market over the past 5 - 6
trading sessions. As expected, the index continued to show its
dominance and rallied towards the mentioned target of
12515. We are now observing that the momentum
oscillators in hourly and daily chart have entered an extreme
overbought territory. Hence, the possibility of sideways
movement or correction cannot be ruled out. On the upside,
index may face resistance around the 12638 mark whereas
yesterday's low of 12317 would act as a key support in
coming trading session. Traders are advised to book profits
in all long positions and remain on the sidelines. Buying at
current levels is not justified as the risk reward ratio is not
favorable.
Actionable points:
View
Neutral
Source: Falcon:
Resistance level
12638
Support Levels
12430 - 12317
2
Daily Technical Report
April 23, 2013
Daily Pivot Levels for Nifty 50 Stocks
SCRIPS
S2
S1
PIVOT
R1
R2
SENSEX
18,906
19,038
19,122
19,253
19,337
NIFTY
5,768
5,801
5,823
5,856
5,878
BANKNIFTY
12,190
12,383
12,511
12,704
12,831
ACC
1,196
1,206
1,218
1,228
1,240
AMBUJACEM
184
186
188
190
193
ASIANPAINT
4,539
4,593
4,667
4,721
4,794
AXISBANK
1,403
1,422
1,453
1,472
1,503
BAJAJ-AUTO
1,707
1,735
1,775
1,803
1,844
BANKBARODA
684
692
698
705
712
BHARTIARTL
296
298
302
304
308
BHEL
184
188
190
193
196
BPCL
398
407
414
423
431
CAIRN
288
290
294
296
300
CIPLA
391
394
399
403
408
COALINDIA
295
304
309
318
323
DLF
238
244
249
256
260
DRREDDY
1,838
1,862
1,883
1,908
1,929
GAIL
329
332
334
338
340
GRASIM
2,783
2,809
2,837
2,863
2,891
HCLTECH
699
710
727
738
755
HDFC
808
822
831
844
853
HDFCBANK
664
681
692
709
719
HEROMOTOCO
1,487
1,509
1,526
1,549
1,565
HINDALCO
92
94
95
97
98
HINDUNILVR
478
480
484
486
490
ICICIBANK
1,098
1,123
1,142
1,167
1,185
IDFC
154
157
160
162
165
INDUSINDBK
442
454
463
475
484
INFY
2,184
2,214
2,254
2,284
2,323
ITC
311
314
316
319
321
JINDALSTEL
332
337
340
345
349
JPASSOCIAT
73
75
76
78
80
KOTAKBANK
657
667
673
683
690
LT
1,456
1,495
1,517
1,556
1,578
LUPIN
665
674
680
689
695
M&M
865
879
896
910
928
MARUTI
1,512
1,526
1,540
1,554
1,568
NMDC
122
125
127
130
132
NTPC
143
146
148
151
152
ONGC
322
325
330
333
338
PNB
755
768
778
791
801
POWERGRID
104
107
109
111
113
RANBAXY
439
446
455
462
470
RELIANCE
771
780
788
797
804
RELINFRA
349
366
376
392
402
SBIN
2,278
2,302
2,331
2,356
2,385
SESAGOA
148
150
151
154
155
SUNPHARMA
901
914
929
942
958
TATAMOTORS
279
282
285
288
291
TATAPOWER
94
95
95
96
96
TATASTEEL
298
302
305
310
313
TCS
1,402
1,414
1,437
1,448
1,472
ULTRACEMCO
1,813
1,842
1,887
1,916
1,961
3
Daily Technical Report
April 23, 2013
Research Team Tel: 022 - 30940000
DISCLAIMER
This document is solely for the personal information of the recipient, and must not be singularly used as the basis of any investment
decision. Nothing in this document should be construed as investment or financial advice. Each recipient of this document should make
such investigations as they deem necessary to arrive at an independent evaluation of an investment in the securities of the companies
referred to in this document (including the merits and risks involved), and should consult their own advisors to determine the merits and
risks of such an investment.
Angel Broking Limited, its affiliates, directors, its proprietary trading and investment businesses may, from time to time, make
investment decisions that are inconsistent with or contradictory to the recommendations expressed herein. The views contained in this
document are those of the analyst, and the company may or may not subscribe to all the views expressed within.
Reports based on technical and derivative analysis center on studying charts of a stock's price movement, outstanding positions and
trading volume, as opposed to focusing on a company's fundamentals and, as such, may not match with a report on a company's
fundamentals.
The information in this document has been printed on the basis of publicly available information, internal data and other reliable
sources believed to be true, but we do not represent that it is accurate or complete and it should not be relied on as such, as this
document is for general guidance only. Angel Broking Limited or any of its affiliates/ group companies shall not be in any way
responsible for any loss or damage that may arise to any person from any inadvertent error in the information contained in this report.
Angel Broking Limited has not independently verified all the information contained within this document. Accordingly, we cannot testify,
nor make any representation or warranty, express or implied, to the accuracy, contents or data contained within this document. While
Angel Broking Limited endeavors to update on a reasonable basis the information discussed in this material, there may be regulatory,
compliance, or other reasons that prevent us from doing so.
This document is being supplied to you solely for your information, and its contents, information or data may not be reproduced,
redistributed or passed on, directly or indirectly.
Angel Broking Limited and its affiliates may seek to provide or have engaged in providing corporate finance, investment banking or
other advisory services in a merger or specific transaction to the companies referred to in this report, as on the date of this report or in
the past.
Neither Angel Broking Limited, nor its directors, employees or affiliates shall be liable for any loss or damage that may arise from or in
connection with the use of this information.
Note: Please refer to the important `Stock Holding Disclosure' report on the Angel website (Research Section). Also, please refer to the
latest update on respective stocks for the disclosure status in respect of those stocks. Angel Broking Limited and its affiliates may have
investment positions in the stocks recommended in this report.
Research Team
Shardul Kulkarni
-
Head - Technicals
Sameet Chavan
-
Technical Analyst
Sacchitanand Uttekar
-
Technical Analyst
Ankur Lakhotia
-
Technical Analyst
Angel Broking Pvt. Ltd.
Registered Office: G-1, Ackruti Trade Centre, Rd. No. 7, MIDC, Andheri (E), Mumbai - 400 093.
Corporate Office: 6th Floor, Ackruti Star, MIDC, Andheri (E), Mumbai - 400 093. Tel: (022) 30940000
Sebi Registration No: INB 010996539
4