Daily Technical Report
October 22, 2012
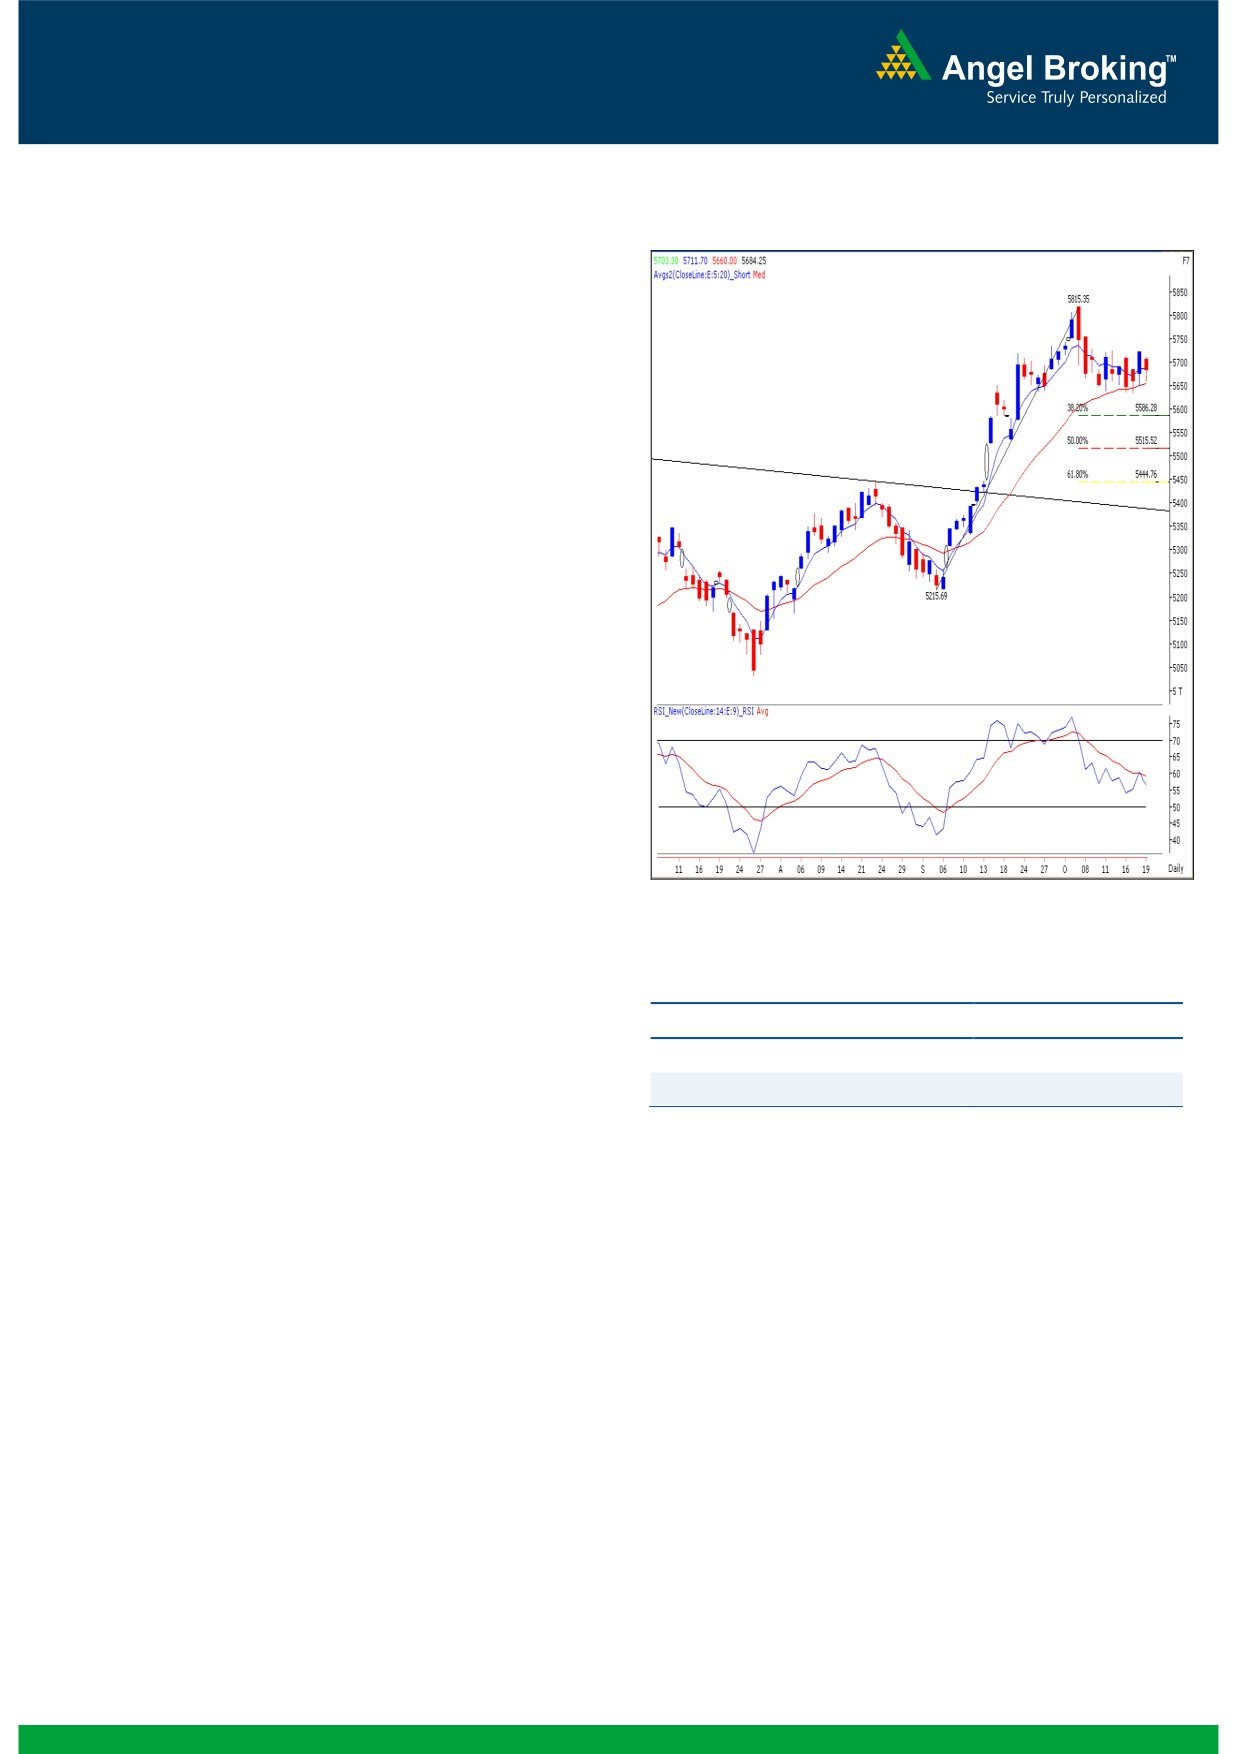
Exhibit 1: Nifty Daily Chart
Sensex (18682) / NIFTY (5684)
On Friday, our benchmark indices pared their previous day’s
gains on the back of profit booking and sharp depreciation
in currency. However, indices still remained in the same
range of 5630 - 5730 and closed below 5700 mark.
Sectors like Power, Metal and Consumer Goods ended as
major losers whereas defensive counters like FMCG and
Consumer Durables closed in green. The advance to decline
ratio was in favor of declining counters (A=1275 D=1586)
Formation
The ’20-day EMA’ and the ’20-week EMA’ are placed at
18617/ 5654 and 17919/ 5434 levels, respectively.
The monthly ‘RSI’ oscillator is moving higher from the 50
mark and the positive in ADX (9) indicator is intact.
The negative crossover in weekly ‘Stochastic’ oscillator is
still intact.
At present, the value of Daily ‘RSI’ oscillator is 56.38.
The RSI trading above the 50 mark shows strength of the
current up trend.
Source: Falcon:
The 38.2% and 50% Fibonacci Retracement levels of the
Actionable points:
rise from 17250 to 19138 / 5216 to 5815 are placed at
18416 / 5586 and 18194 / 5515, respectively.
View for the day
Neutral
Trading strategy:
Resistance Levels
5729 - 5757
Broadly speaking, at this juncture the markets are in a
Support Levels
5633
narrow trading range of 18886 to 18535 / 5729 to 5633.
Only a sustainable breakout / breakdown on either side
A fresh set of buyers would enter the market only if our indices
would give clarity of the near term trend. During the week,
sustain above 18886 / 5729. In this scenario, we can expect
we observed that indices have a strong support zone of ’20-
our indices to move towards 18973 - 19138 / 5757 - 5816.
day EMA’, which also coincides with the lower level of
A move beyond 19138 / 5816 would negate the negative
mentioned trading range. Going forward, the impact of
implication of the "Bearish Engulfing" candlestick pattern and
negatively poised weekly ‘Stochastic’ oscillator would be seen
further optimistic targets open up.
if indices sustain below 18535 / 5633. This may trigger near
term pessimism in the market and as a result, Indices may
slide towards 18416 / 5586 and 18194 / 5515, which are
38.2% and 50% Fibonacci Retracement levels of the rise
from 17250 to 19138 / 5216 to 5815. On the flip side, the
daily ‘RSI’ oscillator is consistently moving above the
50
mark. This signifies strength in the current intermediate
degree trend, which is bullish.
1
Daily Technical Report
October 22, 2012
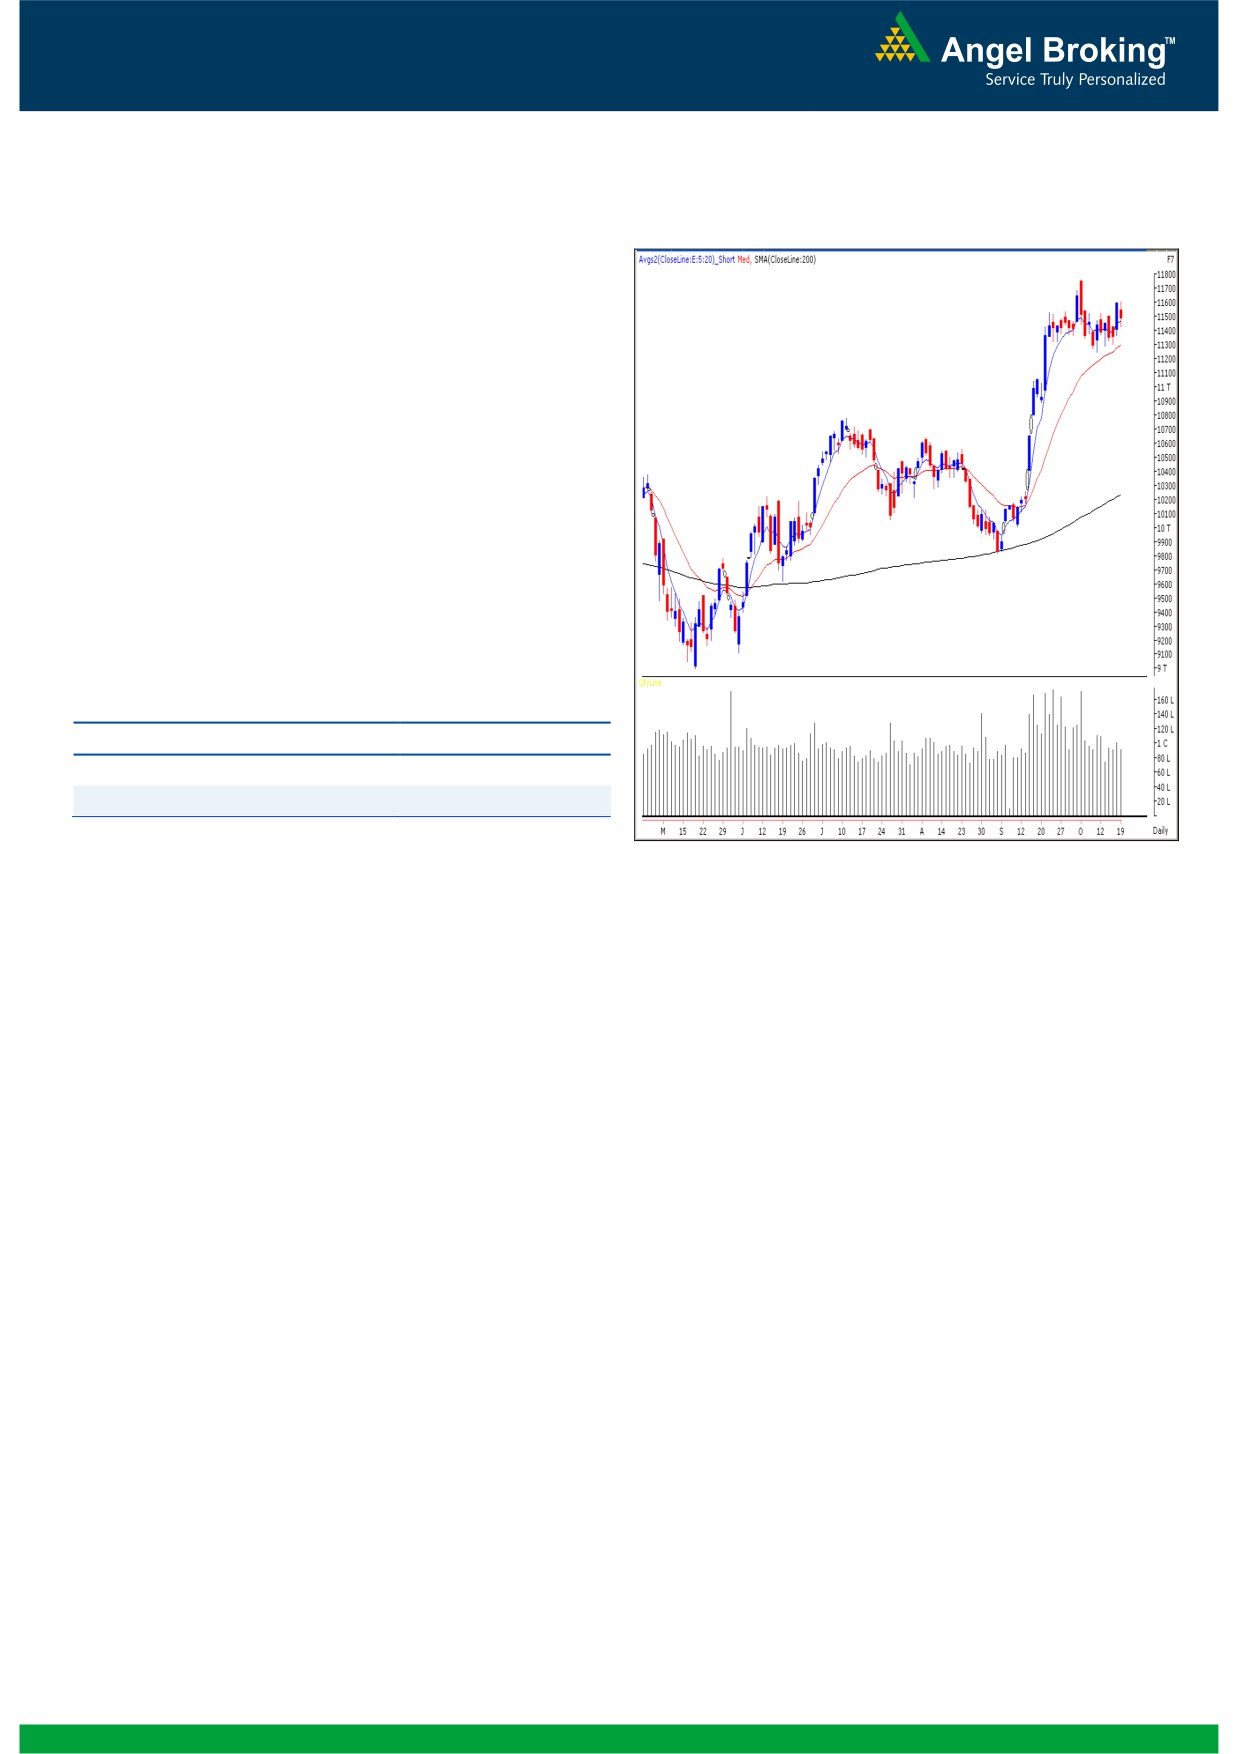
Exhibit 2: Bank Nifty Daily Chart
Bank Nifty Outlook - (11491)
On Friday, Bank Nifty opened on a flat note and trimmed
some gains of Thursday’s session to close with a loss of
nearly 1%. Since the past four weeks we are witnessing a
consolidation in the range of 11745 - 11245. Going
forward, clarity of trend will emerge only when the Bank
Nifty moves out of the mentioned trading range. Within
the range 11515 - 11536 levels are likely to act as
resistance and 11418 - 11364 levels are likely to act as
support in coming trading session. We advise positional
traders to wait for a few sessions before a clear pattern or
a trading opportunity can be spotted.
Actionable points:
View for the day
Neutral
Resistance Levels
11515 - 11745
Support Levels
11418 - 11364
Source: Falcon:
2
Daily Technical Report
October 22, 2012
Daily Pivot Levels for Nifty 50 Stocks
SCRIPS
S2
S1
PIVOT
R1
R2
SENSEX
18,530
18,606
18,688
18,764
18,846
NIFTY
5,634
5,659
5,685
5,711
5,737
BANKNIFTY
11,326
11,408
11,507
11,590
11,688
ACC
1,376
1,392
1,413
1,429
1,451
AMBUJACEM
201
204
206
209
211
ASIANPAINT
3,845
3,863
3,893
3,912
3,942
AXISBANK
1,175
1,189
1,200
1,213
1,224
BAJAJ-AUTO
1,746
1,759
1,777
1,790
1,808
BANKBARODA
773
785
797
809
821
BHARTIARTL
259
263
265
270
272
BHEL
236
239
244
247
251
BPCL
331
335
341
346
352
CAIRN
325
330
335
339
345
CIPLA
353
356
360
363
368
COALINDIA
349
351
356
358
362
DLF
200
203
206
209
211
DRREDDY
1,679
1,692
1,703
1,716
1,727
GAIL
348
354
362
369
376
GRASIM
3,346
3,379
3,434
3,467
3,521
HCLTECH
582
594
601
613
620
HDFC
742
748
755
760
767
HDFCBANK
622
625
630
633
638
HEROMOTOCO
1,796
1,823
1,839
1,866
1,882
HINDALCO
112
114
116
117
119
HINDUNILVR
559
563
568
572
578
ICICIBANK
1,035
1,046
1,061
1,072
1,087
IDFC
148
150
153
155
158
INFY
2,351
2,367
2,382
2,398
2,413
ITC
287
292
296
301
304
JINDALSTEL
398
403
410
415
422
JPASSOCIAT
91
92
94
95
97
KOTAKBANK
619
624
630
635
641
LT
1,605
1,619
1,635
1,650
1,666
LUPIN
566
569
575
579
585
M&M
811
817
828
834
845
MARUTI
1,352
1,361
1,371
1,380
1,391
NTPC
165
165
167
168
169
ONGC
272
276
278
282
284
PNB
808
816
826
833
843
POWERGRID
118
119
120
120
121
RANBAXY
529
534
544
550
559
RELIANCE
793
798
804
809
815
RELINFRA
497
503
510
515
523
SBIN
2,211
2,235
2,257
2,280
2,303
SESAGOA
166
168
169
171
173
SIEMENS
678
683
689
693
699
SUNPHARMA
677
686
693
702
709
TATAMOTORS
263
266
270
273
277
TATAPOWER
103
104
106
107
108
TATASTEEL
401
404
409
412
416
TCS
1,265
1,277
1,294
1,307
1,324
ULTRACEMCO
1,972
1,991
2,021
2,040
2,069
WIPRO
339
342
346
348
352
3
Daily Technical Report
October 22, 2012
Research Team Tel: 022 - 39357800
DISCLAIMER
This document is solely for the personal information of the recipient, and must not be singularly used as the basis of any investment
decision. Nothing in this document should be construed as investment or financial advice. Each recipient of this document should make
such investigations as they deem necessary to arrive at an independent evaluation of an investment in the securities of the companies
referred to in this document (including the merits and risks involved), and should consult their own advisors to determine the merits and
risks of such an investment.
Angel Broking Limited, its affiliates, directors, its proprietary trading and investment businesses may, from time to time, make
investment decisions that are inconsistent with or contradictory to the recommendations expressed herein. The views contained in this
document are those of the analyst, and the company may or may not subscribe to all the views expressed within.
Reports based on technical and derivative analysis center on studying charts of a stock's price movement, outstanding positions and
trading volume, as opposed to focusing on a company's fundamentals and, as such, may not match with a report on a company's
fundamentals.
The information in this document has been printed on the basis of publicly available information, internal data and other reliable
sources believed to be true, but we do not represent that it is accurate or complete and it should not be relied on as such, as this
document is for general guidance only. Angel Broking Limited or any of its affiliates/ group companies shall not be in any way
responsible for any loss or damage that may arise to any person from any inadvertent error in the information contained in this report.
Angel Broking Limited has not independently verified all the information contained within this document. Accordingly, we cannot testify,
nor make any representation or warranty, express or implied, to the accuracy, contents or data contained within this document. While
Angel Broking Limited endeavours to update on a reasonable basis the information discussed in this material, there may be regulatory,
compliance, or other reasons that prevent us from doing so.
This document is being supplied to you solely for your information, and its contents, information or data may not be reproduced,
redistributed or passed on, directly or indirectly.
Angel Broking Limited and its affiliates may seek to provide or have engaged in providing corporate finance, investment banking or
other advisory services in a merger or specific transaction to the companies referred to in this report, as on the date of this report or in
the past.
Neither Angel Broking Limited, nor its directors, employees or affiliates shall be liable for any loss or damage that may arise from or in
connection with the use of this information.
Note: Please refer to the important `Stock Holding Disclosure' report on the Angel website (Research Section). Also, please refer to the
latest update on respective stocks for the disclosure status in respect of those stocks. Angel Broking Limited and its affiliates may have
investment positions in the stocks recommended in this report.
Research Team
Shardul Kulkarni
-
Head - Technicals
Sameet Chavan
-
Technical Analyst
Sacchitanand Uttekar
-
Technical Analyst
Mehul Kothari
-
Technical Analyst
Ankur Lakhotia
-
Technical Analyst
Angel Broking Pvt. Ltd.
Registered Office: G-1, Ackruti Trade Centre, Rd. No. 7, MIDC, Andheri (E), Mumbai - 400 093.
Corporate Office: 6th Floor, Ackruti Star, MIDC, Andheri (E), Mumbai - 400 093. Tel: (022) 3952 6600
Sebi Registration No: INB 010996539
4