Daily Technical Report
September 21, 2012
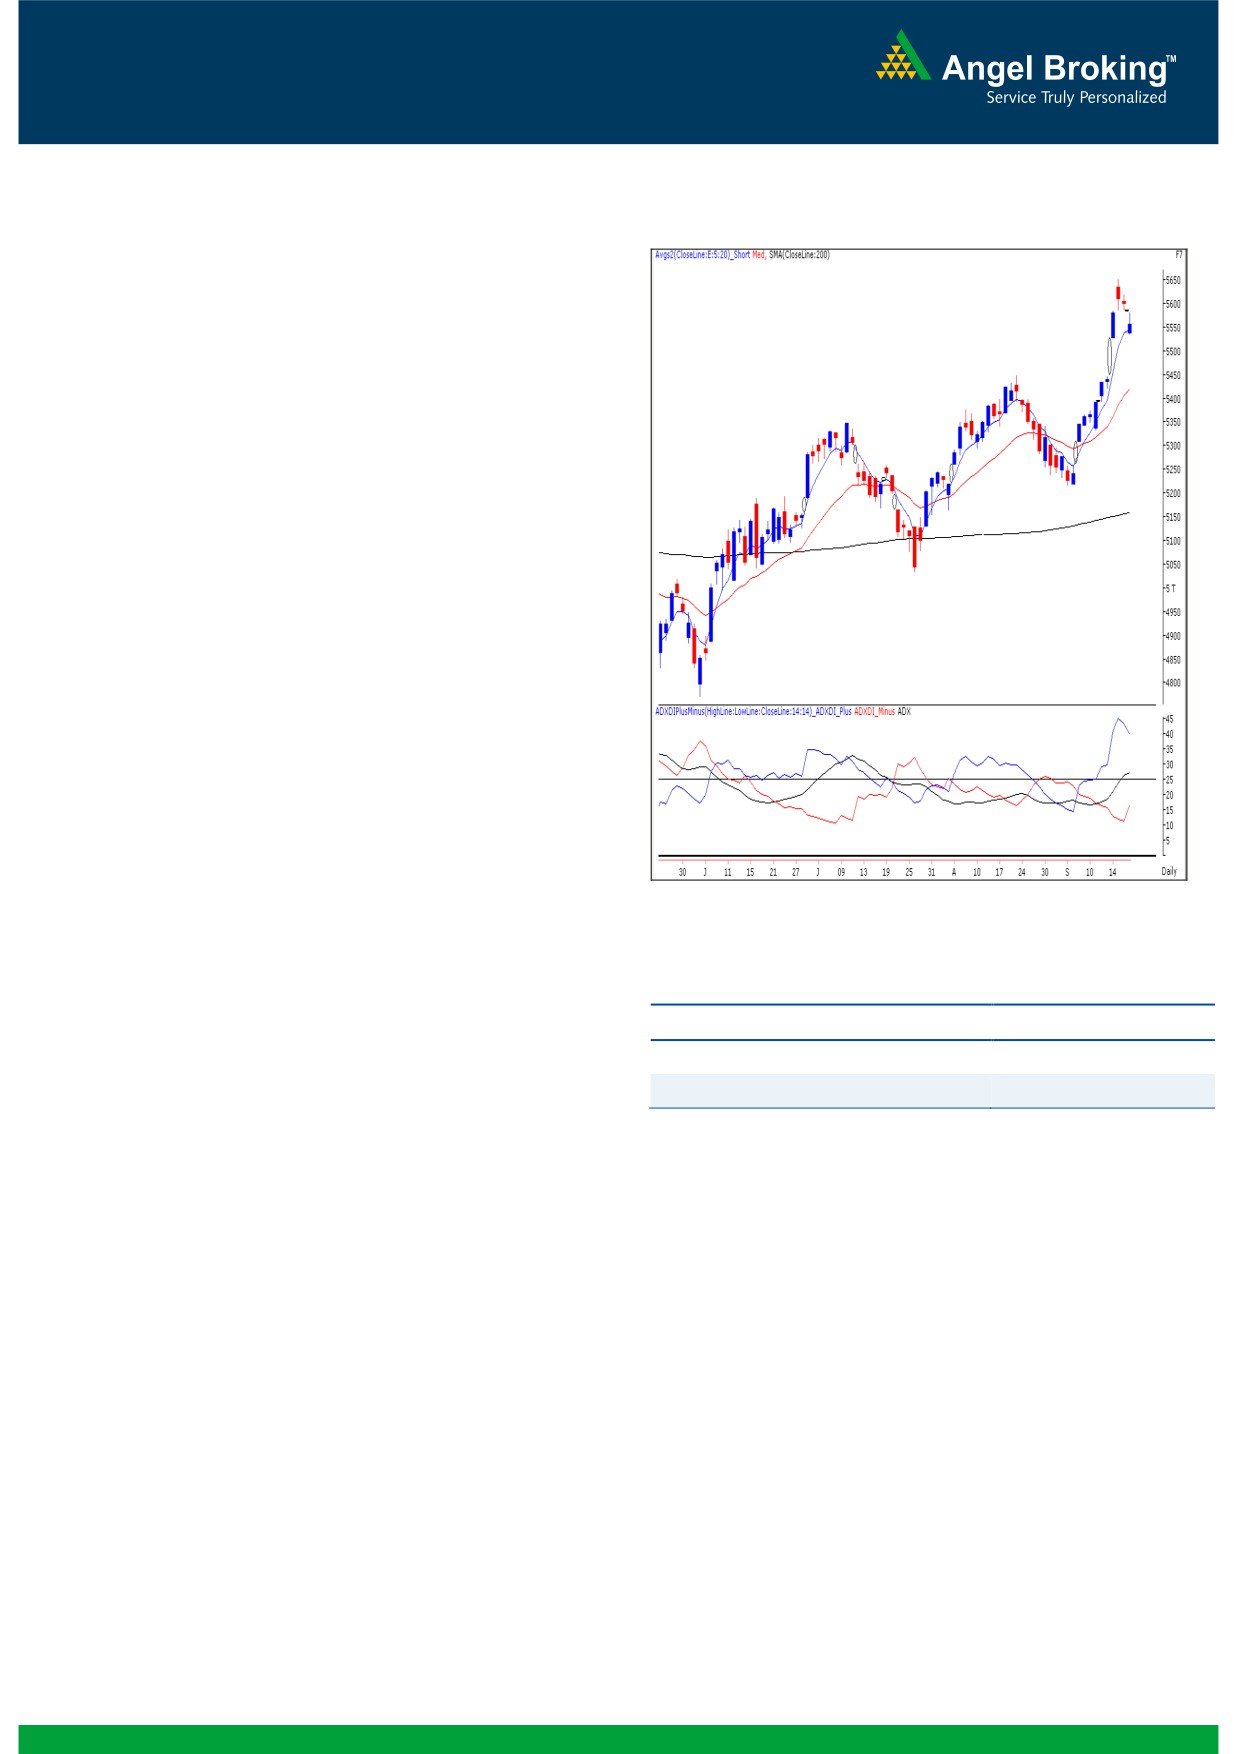
Exhibit 1: Nifty Daily Chart
Sensex (18349) / NIFTY (5554)
Yesterday, our benchmark indices opened in the red on the
back of weak global cues and political uncertainty on the
domestic front. Markets traded with pessimism throughout
the day but managed to close marginally above the support
level of 5550. On sectoral front profit booking was witnessed
in Metal, Consumer Goods and Power counters; whereas IT,
Teck and FMCG recovered some losses. The advance to
decline ratio was in favor of declining counters (A=1204
Formation
The ’20-day EMA’ and the ’20-week EMA’ are placed at
17923 / 5420 and 17468 / 5289 levels, respectively.
Indices have now confirmed a weekly ‘Higher Top -
Higher Bottom’ formation.
The daily ‘RSI’ momentum oscillator on weekly chart is
still showing strength.
The weekly chart depicts an “Upward Sloping Trend
Line” breakout above 17973 / 5449 level.
Source: Falcon:
The ADX (14) indicator on the Daily chart shows
possibility of further strength in the coming sessions. The
+ DI (positive directional index) is moving upwards
Actionable points:
supported by the ADX line, which has now moved up to
27.22 level. The ADX rise from 15 to 25 indicates that
View
Neutral
the uptrend is strengthening and positive momentum is
Resistance Levels
5582 - 5621
likely to accelerate further in the coming trading
Support Levels
5526
sessions.
Trading strategy:
As expected, our markets showed some weakness below
18469 / 5586 and tested the mentioned support level
18380 / 5550. However, considering the bigger picture, the
undertone remains bullish and this correction can only be
construed as the breather or a pull back of the recent rally.
For the day, the next support level for markets is seen at
18282 / 5526, which is the higher end of the upside gap
created on September 14, 2012. Conversely, 18444 -
18581 / 5582 - 5621 levels would act as a resistance in
coming trading session.
Traders are advised to adopt a buy on dips strategy and
have a stock specific approach with strict stop losses on
trading positions.
1
Daily Technical Report
September 21, 2012
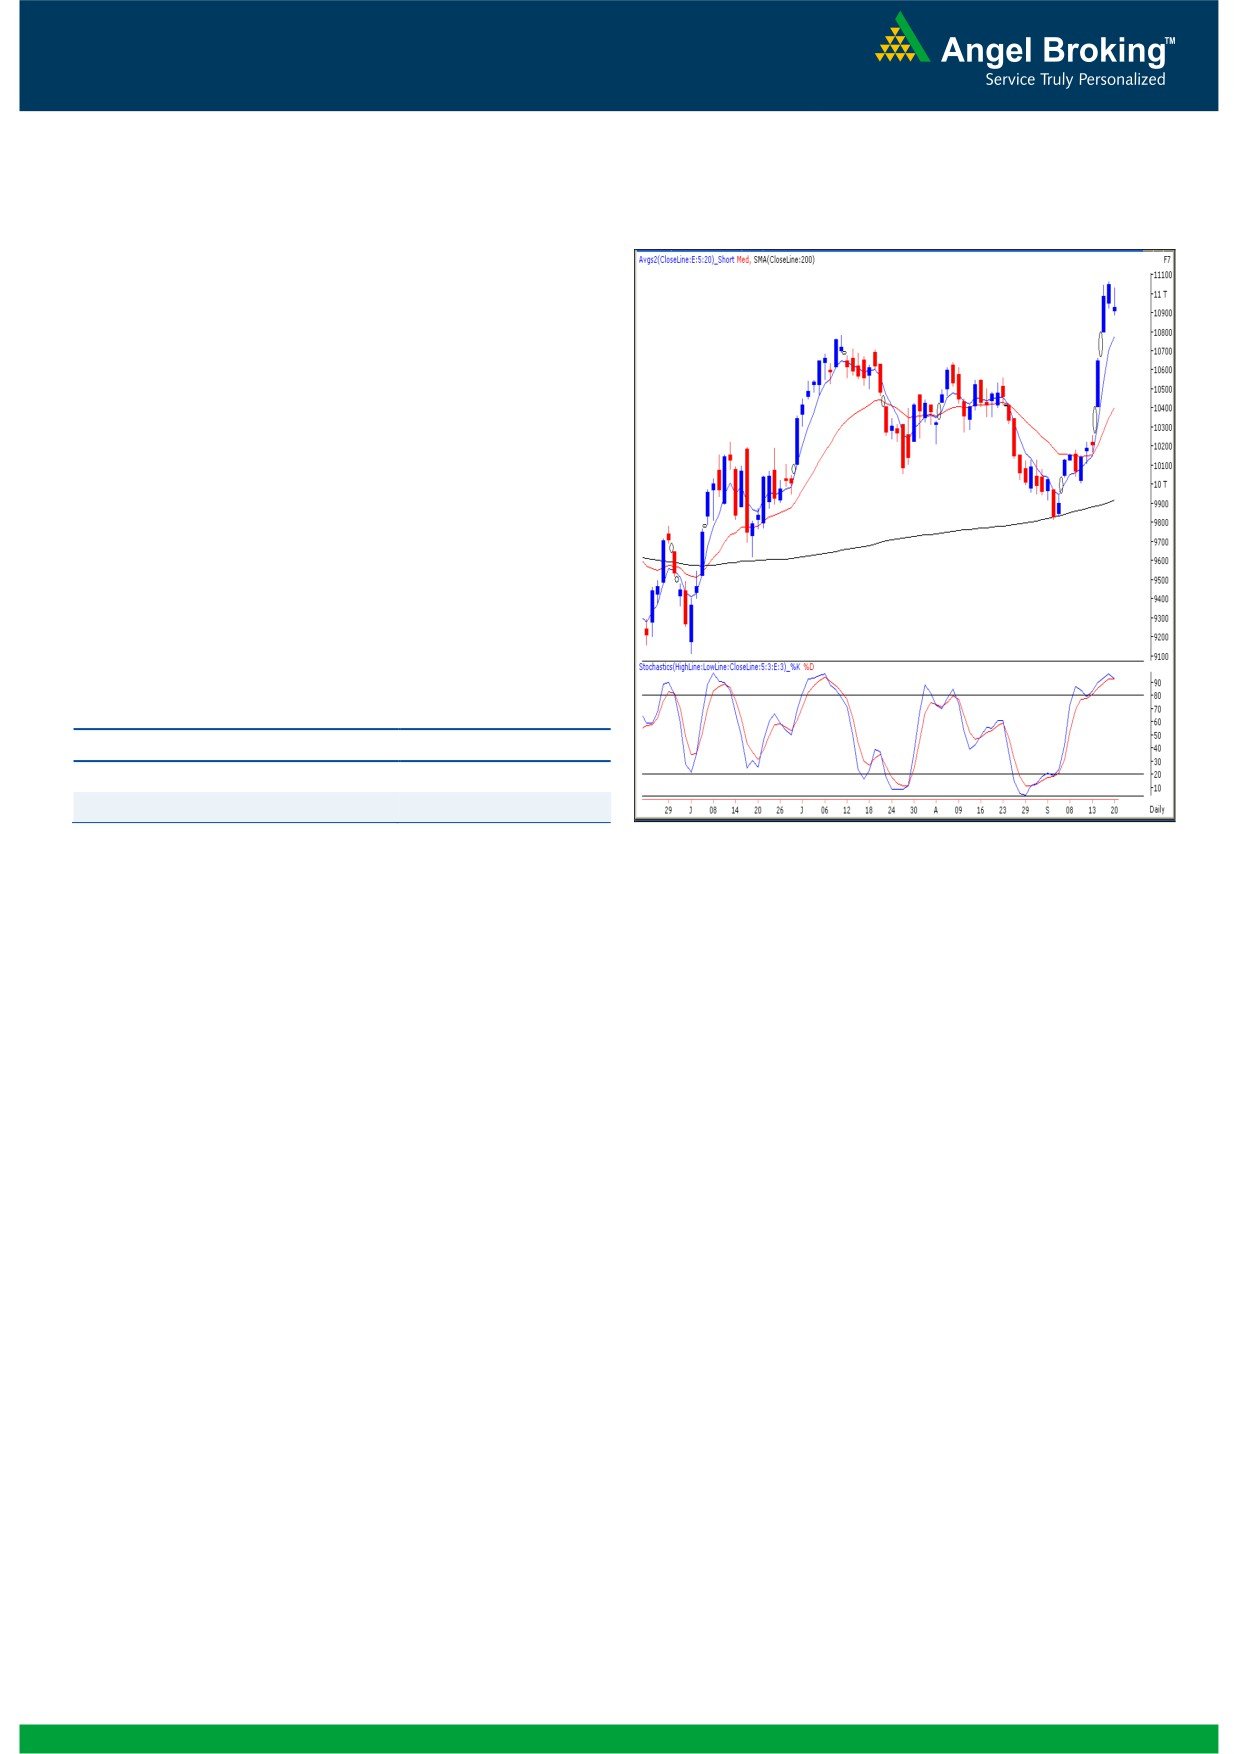
Exhibit 2: Bank Nifty Daily Chart
Bank Nifty Outlook - (10921)
Yesterday, Bank Nifty opened on a pessimistic note and
traded with negative bias throughout the day to close with a
loss of 1.11%. As mentioned in our previous reports the
index has consolidated and formed a “Narrow Range” body
formation. We are now witnessing a negative crossover in
“Stochastic” momentum oscillator on the daily chart coupled
with negative crossover in “RSI - Smoothened” oscillator on
the hourly chart. Thus, for the day, if the index sustains below
yesterday’s low of 10887 then it is likely to drift lower
towards 10797 - 10664 levels. On the upside 11032 -
11065 levels are likely to act as resistance in coming trading
session.
Actionable points:
View
Neutral
Resistance Levels
11032 - 11065
Support Levels
10797 - 10664
Source: Falcon:
2
Daily Technical Report
September 21, 2012
Research Team Tel: 022 - 39357800
DISCLAIMER
This document is solely for the personal information of the recipient, and must not be singularly used as the basis of any investment
decision. Nothing in this document should be construed as investment or financial advice. Each recipient of this document should make
such investigations as they deem necessary to arrive at an independent evaluation of an investment in the securities of the companies
referred to in this document (including the merits and risks involved), and should consult their own advisors to determine the merits and
risks of such an investment.
Angel Broking Limited, its affiliates, directors, its proprietary trading and investment businesses may, from time to time, make
investment decisions that are inconsistent with or contradictory to the recommendations expressed herein. The views contained in this
document are those of the analyst, and the company may or may not subscribe to all the views expressed within.
Reports based on technical and derivative analysis center on studying charts of a stock's price movement, outstanding positions and
trading volume, as opposed to focusing on a company's fundamentals and, as such, may not match with a report on a company's
fundamentals.
The information in this document has been printed on the basis of publicly available information, internal data and other reliable
sources believed to be true, but we do not represent that it is accurate or complete and it should not be relied on as such, as this
document is for general guidance only. Angel Broking Limited or any of its affiliates/ group companies shall not be in any way
responsible for any loss or damage that may arise to any person from any inadvertent error in the information contained in this report.
Angel Broking Limited has not independently verified all the information contained within this document. Accordingly, we cannot testify,
nor make any representation or warranty, express or implied, to the accuracy, contents or data contained within this document. While
Angel Broking Limited endeavours to update on a reasonable basis the information discussed in this material, there may be regulatory,
compliance, or other reasons that prevent us from doing so.
This document is being supplied to you solely for your information, and its contents, information or data may not be reproduced,
redistributed or passed on, directly or indirectly.
Angel Broking Limited and its affiliates may seek to provide or have engaged in providing corporate finance, investment banking or
other advisory services in a merger or specific transaction to the companies referred to in this report, as on the date of this report or in
the past.
Neither Angel Broking Limited, nor its directors, employees or affiliates shall be liable for any loss or damage that may arise from or in
connection with the use of this information.
Note: Please refer to the important `Stock Holding Disclosure' report on the Angel website (Research Section). Also, please refer to the
latest update on respective stocks for the disclosure status in respect of those stocks. Angel Broking Limited and its affiliates may have
investment positions in the stocks recommended in this report.
Research Team
Shardul Kulkarni
-
Head - Technicals
Sameet Chavan
-
Technical Analyst
Sacchitanand Uttekar
-
Technical Analyst
Mehul Kothari
-
Technical Analyst
Ankur Lakhotia
-
Technical Analyst
Angel Broking Pvt. Ltd.
Registered Office: G-1, Ackruti Trade Centre, Rd. No. 7, MIDC, Andheri (E), Mumbai - 400 093.
Corporate Office: 6th Floor, Ackruti Star, MIDC, Andheri (E), Mumbai - 400 093. Tel: (022) 3952 6600
Sebi Registration No: INB 010996539
4