Daily Technical Report
March 21, 2013
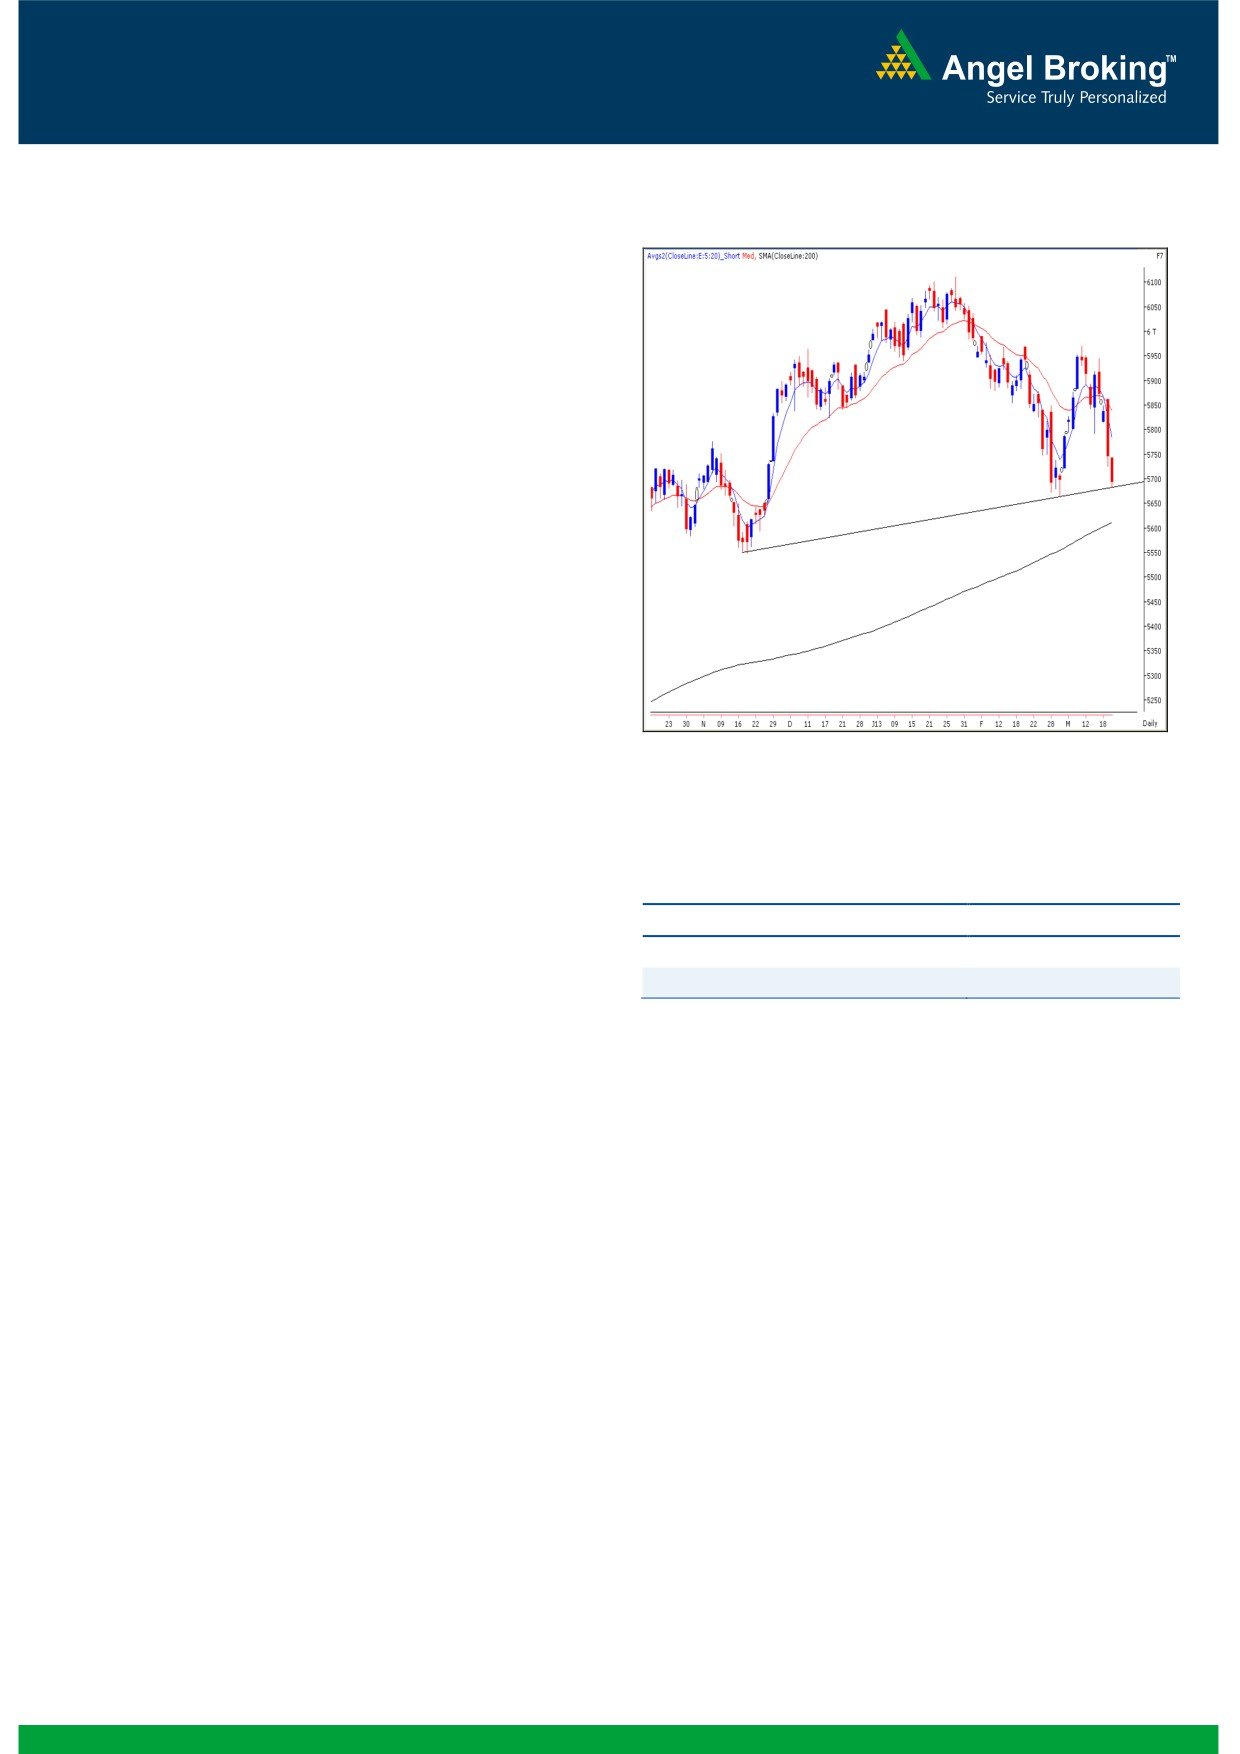
Exhibit 1: Nifty Daily Chart
Sensex (18884) / NIFTY (5694)
Yesterday, markets opened on a flat note in-line with the
quiet mood across the globe. However, indices could only
manage to inch marginally higher than the opening level
and gradually slipped as the day progressed to close
significantly in the red. The Realty, Power and PSU sectors
were among the major losers whereas FMCG and IT ended
with marginal gains. The advance to decline ratio was
strongly in favor of declining counters (A=761 D=2126)
Formation
The ’20-day EMA’ and the ’20-week EMA’ are placed at
19362 / 5854 and 19221 / 5822 levels, respectively.
Source: Falcon:
Trading strategy:
Yesterday, indices slipped and closed below the
psychological level of 19000 / 5700. Indices are now
Actionable points:
trading marginally above the recent low of 18760 / 5663.
Considering the extremely strong negative momentum seen
View
Neutral
in the last 3 sessions, this level can be easily tested. Further,
Support levels
5663 - 5640
any sustainable move below this level would reinforce
Resistance levels
5733 - 5760
significant selling pressure. In this case, indices may slide
lower to test 18616 -18500 / 5640 - 5600 levels. However,
the hourly 'RSI-Smoothened' oscillator is placed well inside
the oversold territory and hence the possibility of a bounce
cannot be ruled out. Intraday traders are advised not to
create fresh short positions in today’s session. A move
beyond 19000 / 5733 may lead to a bounce from oversold
conditions towards hourly '20 EMA' placed at 19088 / 5760.
1
Daily Technical Report
March 21, 2013
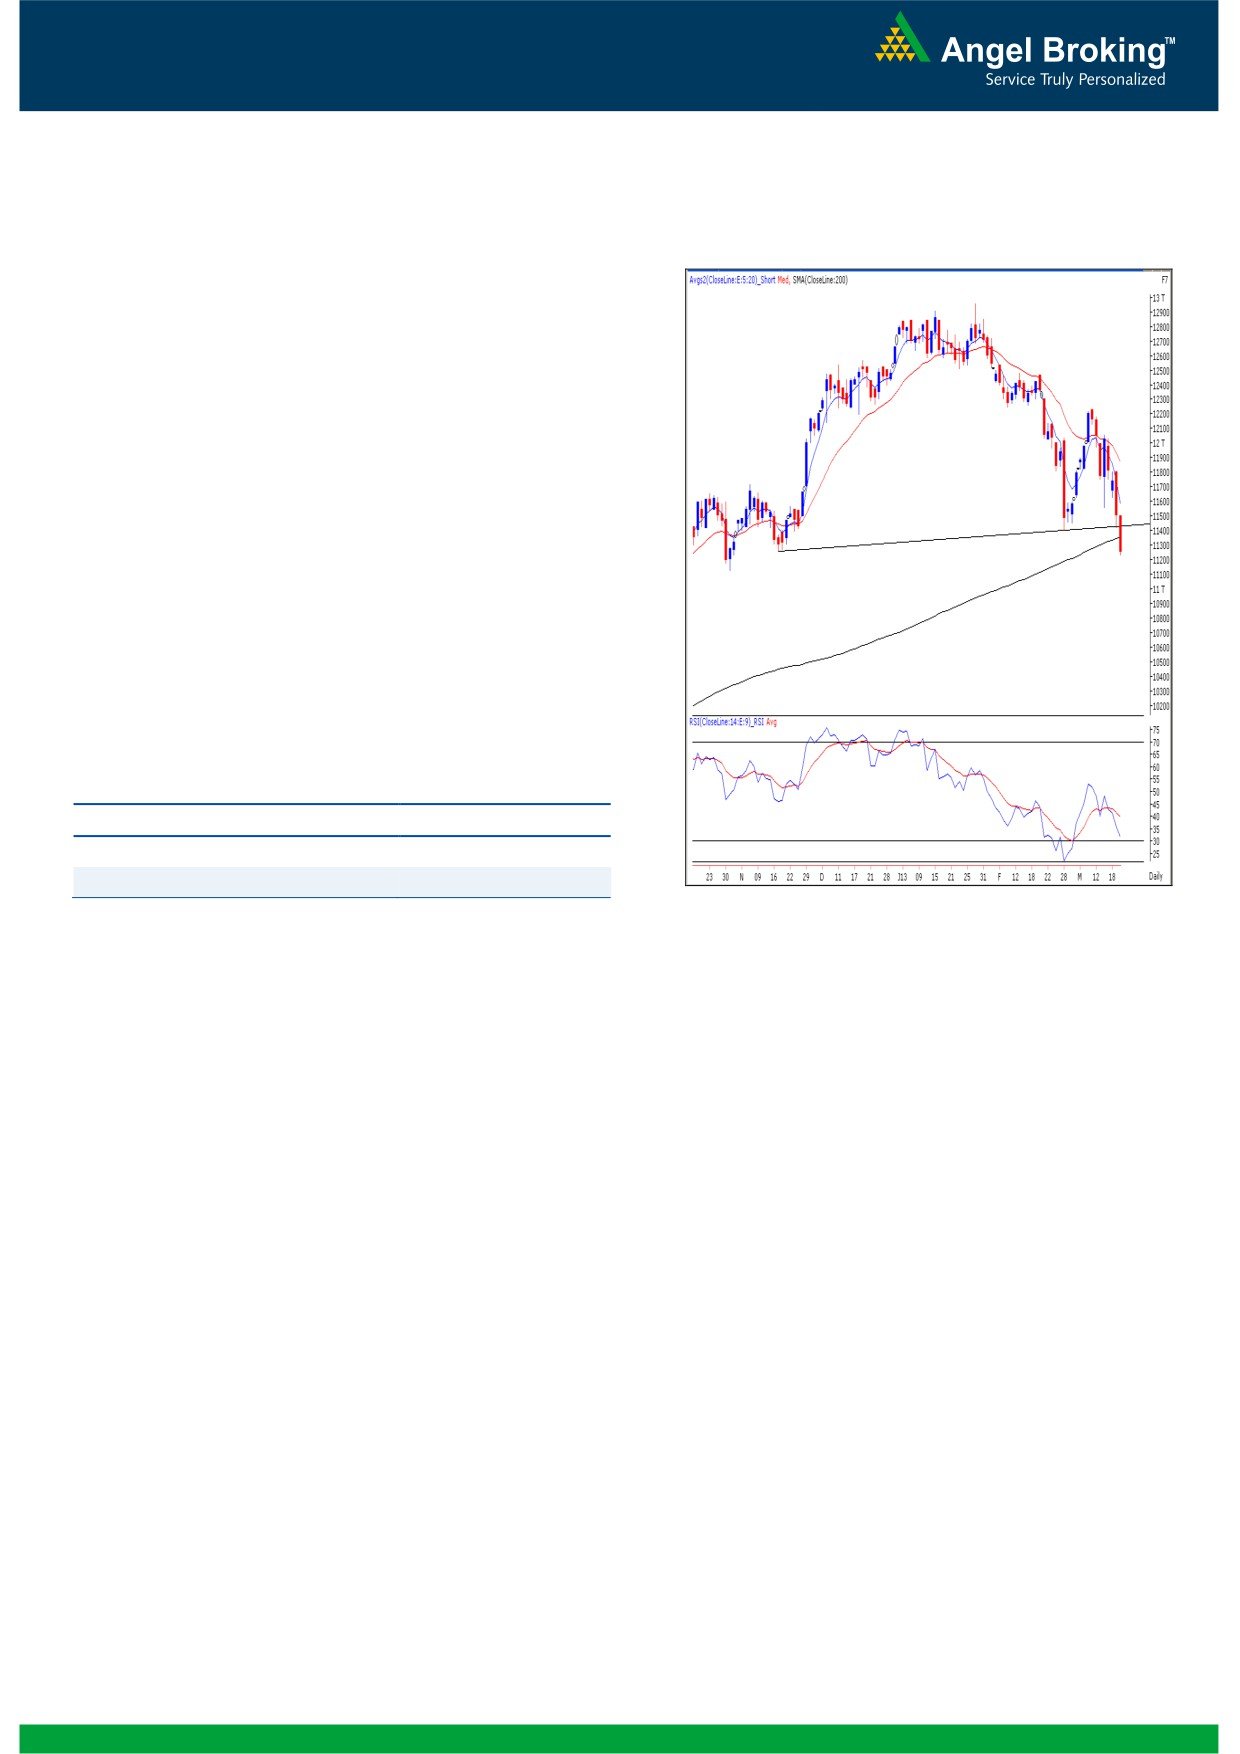
Exhibit 2: Bank Nifty Daily Chart
Bank Nifty Outlook - (11255)
Yesterday, Bank Nifty opened on a flat note and drifted
lower as the day progressed to close with a loss of over
2%. On daily chart we are now witnessing bearish ‘Head
and Shoulder’ pattern breakdown as the index has closed
well below the 11401 level. However we are witnessing
positive divergence in ‘RSI’ momentum oscillator on daily
chart hence fresh selling at current levels is not advisable.
Moreover, the momentum oscillators on the daily chart are
placed inside the oversold zone hence some consolidation
or pullback in the index cannot be ruled out. On the
downside 11230 - 11125 levels are likely to act as
support whereas 11445 - 11550 levels are likely to act as
resistance for the day.
Actionable points:
View
Neutral
Resistance Levels
11445 - 11550
Support Levels
11230 - 11125
Source: Falcon:
2
Daily Technical Report
March 21, 2013
Research Team Tel: 022 - 30940000
DISCLAIMER
This document is solely for the personal information of the recipient, and must not be singularly used as the basis of any investment
decision. Nothing in this document should be construed as investment or financial advice. Each recipient of this document should make
such investigations as they deem necessary to arrive at an independent evaluation of an investment in the securities of the companies
referred to in this document (including the merits and risks involved), and should consult their own advisors to determine the merits and
risks of such an investment.
Angel Broking Limited, its affiliates, directors, its proprietary trading and investment businesses may, from time to time, make
investment decisions that are inconsistent with or contradictory to the recommendations expressed herein. The views contained in this
document are those of the analyst, and the company may or may not subscribe to all the views expressed within.
Reports based on technical and derivative analysis center on studying charts of a stock's price movement, outstanding positions and
trading volume, as opposed to focusing on a company's fundamentals and, as such, may not match with a report on a company's
fundamentals.
The information in this document has been printed on the basis of publicly available information, internal data and other reliable
sources believed to be true, but we do not represent that it is accurate or complete and it should not be relied on as such, as this
document is for general guidance only. Angel Broking Limited or any of its affiliates/ group companies shall not be in any way
responsible for any loss or damage that may arise to any person from any inadvertent error in the information contained in this report.
Angel Broking Limited has not independently verified all the information contained within this document. Accordingly, we cannot testify,
nor make any representation or warranty, express or implied, to the accuracy, contents or data contained within this document. While
Angel Broking Limited endeavors to update on a reasonable basis the information discussed in this material, there may be regulatory,
compliance, or other reasons that prevent us from doing so.
This document is being supplied to you solely for your information, and its contents, information or data may not be reproduced,
redistributed or passed on, directly or indirectly.
Angel Broking Limited and its affiliates may seek to provide or have engaged in providing corporate finance, investment banking or
other advisory services in a merger or specific transaction to the companies referred to in this report, as on the date of this report or in
the past.
Neither Angel Broking Limited, nor its directors, employees or affiliates shall be liable for any loss or damage that may arise from or in
connection with the use of this information.
Note: Please refer to the important `Stock Holding Disclosure' report on the Angel website (Research Section). Also, please refer to the
latest update on respective stocks for the disclosure status in respect of those stocks. Angel Broking Limited and its affiliates may have
investment positions in the stocks recommended in this report.
Research Team
Shardul Kulkarni
-
Head - Technicals
Sameet Chavan
-
Technical Analyst
Sacchitanand Uttekar
-
Technical Analyst
Ankur Lakhotia
-
Technical Analyst
Angel Broking Pvt. Ltd.
Registered Office: G-1, Ackruti Trade Centre, Rd. No. 7, MIDC, Andheri (E), Mumbai - 400 093.
Corporate Office: 6th Floor, Ackruti Star, MIDC, Andheri (E), Mumbai - 400 093. Tel: (022) 30940000
Sebi Registration No: INB 010996539
4