Daily Technical Report
January 21, 2013
Sensex (20039) / NIFTY (6064)
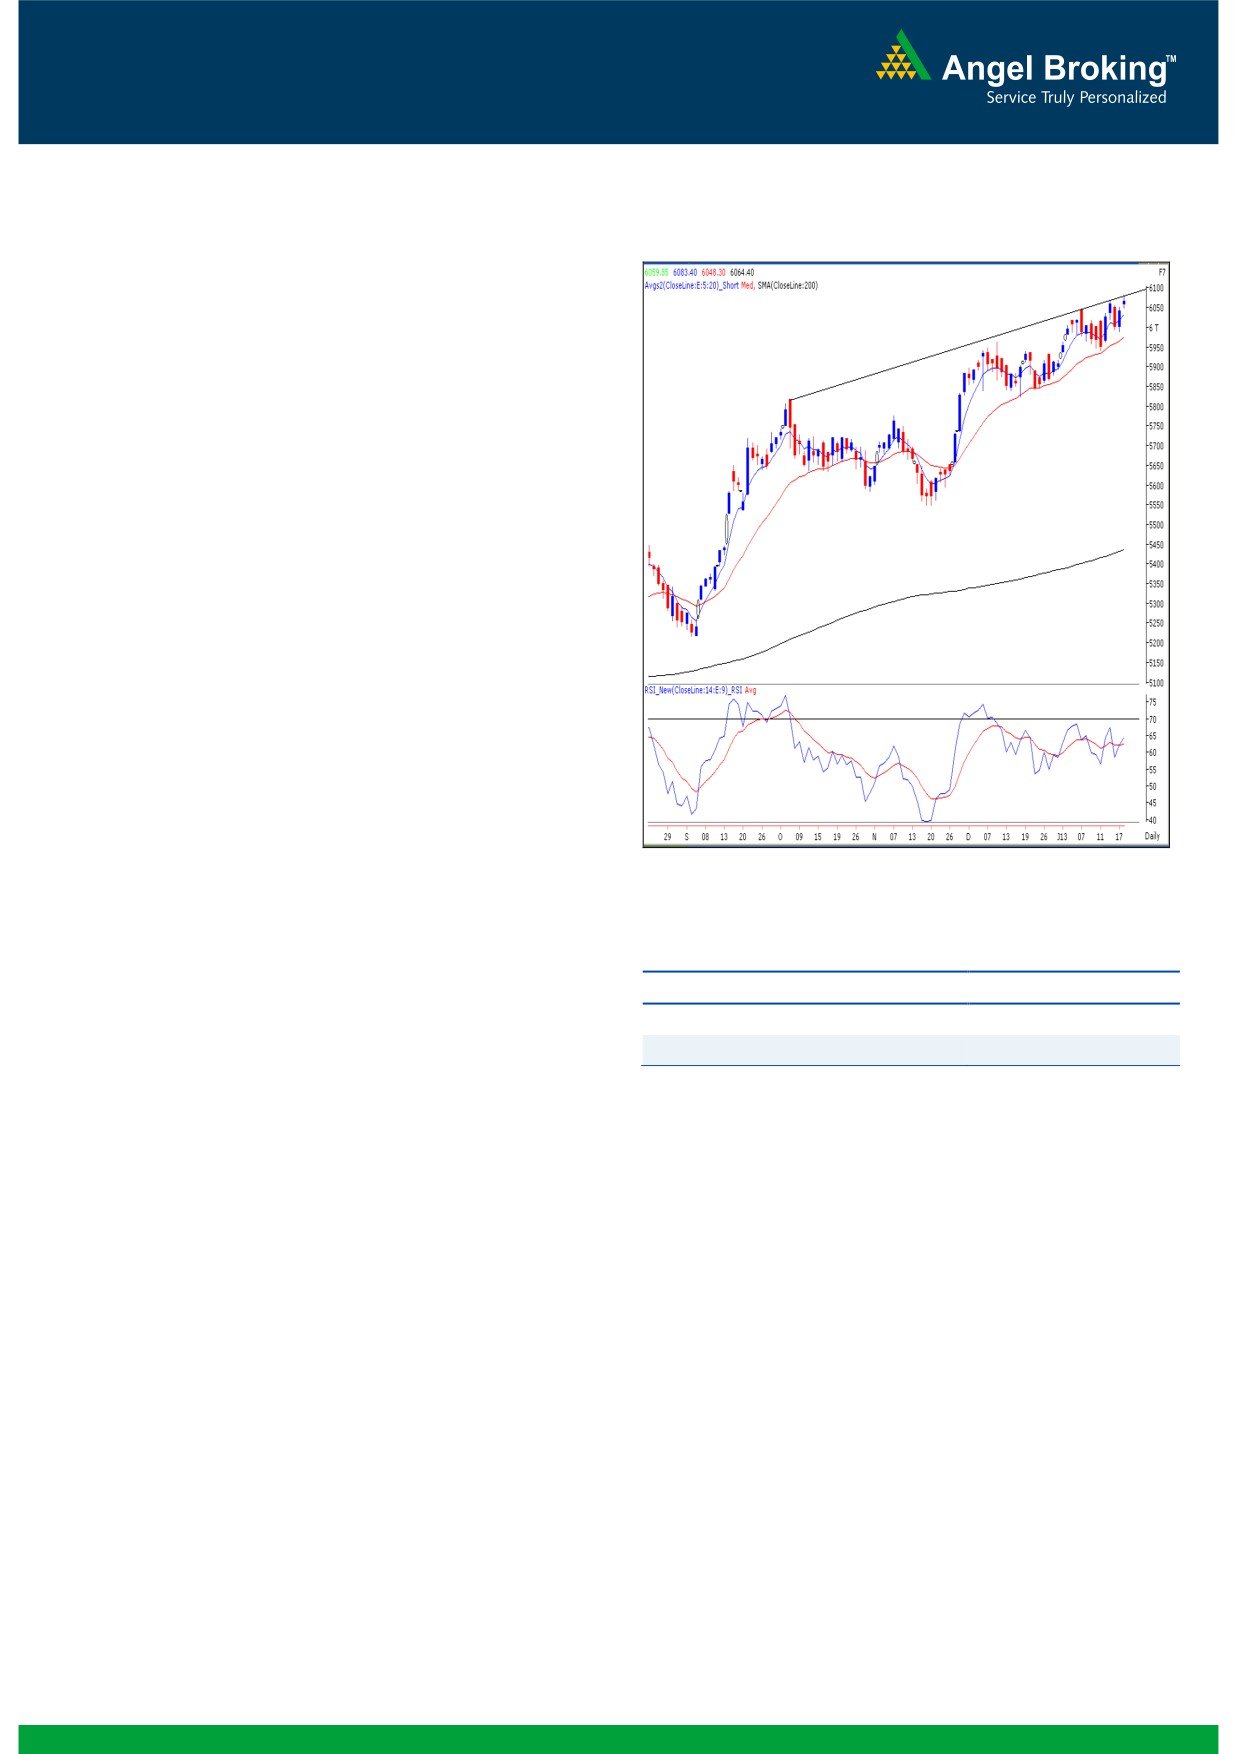
Exhibit 1: Nifty Daily Chart
On Friday, once again Oil & Gas counters climbed almost
7-10% and helped our benchmark indices to close above the
psychological level of 20000. However, the overall market
breadth was weak since the advance to decline ration was
strongly in favor of declining counters (A=971 D=1331).
Other than the Oil & Gas sector, PSU and Power counters
were the highest gainers. The IT, Teck and Auto counters
Formation
The ’20-day EMA’ and the ’20-week EMA’ are placed at
19692 / 5975 and 18949 / 5753 levels, respectively.
On the daily chart, the benchmark indices are facing
resistance near the ‘Upward Sloping Trend Line’ drawn
by joining the highs of October 5, 2012 and December
11, 2012.
We are also observing a ‘Negative Divergence’ in the
daily ‘RSI’ momentum oscillator.
Source: Falcon:
The advance decline ratio was in the favor of declining
Actionable points:
counters for 4 out of the 5 sessions of the week.
View
Neutral
Trading strategy:
Resistance Levels
6083 - 6125
Support Levels
6026 - 5988
Positive steps taken by the Government during the week led
to a decent intraweek rally in our benchmark indices. Partial
This is specifically different from what is seen in a bull
deregulation of diesel prices was seen as a landmark
market. We thus continue to remain cautious and advise
development on the reforms front and as a result, the market
traders to reduce their long positions and book partial profits
managed to eventually close above the psychological level of
in individual large cap counters near to the 19950 - 20100
20000 / 6000 for the first time after December 31, 2010.
/ 6070 - 6125 mark. Last week’s low of 19596 / 5940
However strong ‘Negative Divergence’ in the daily ‘RSI’
remains to be a key support in the coming trading sessions.
momentum oscillator indicates that buying at these levels is
A breach of this level may trigger pessimism in the market
not justified. In addition, although our domestic markets
and in such a scenario, we expect a corrective move towards
have closed almost at the highest point of the week, the rally
the next support levels of 19406 - 19221 / 5897 - 5842.
is not a broad based one (Negative advance decline ratio)
and has been led by individual stocks.
1
Daily Technical Report
January 21, 2013
Bank Nifty Outlook - (12680)
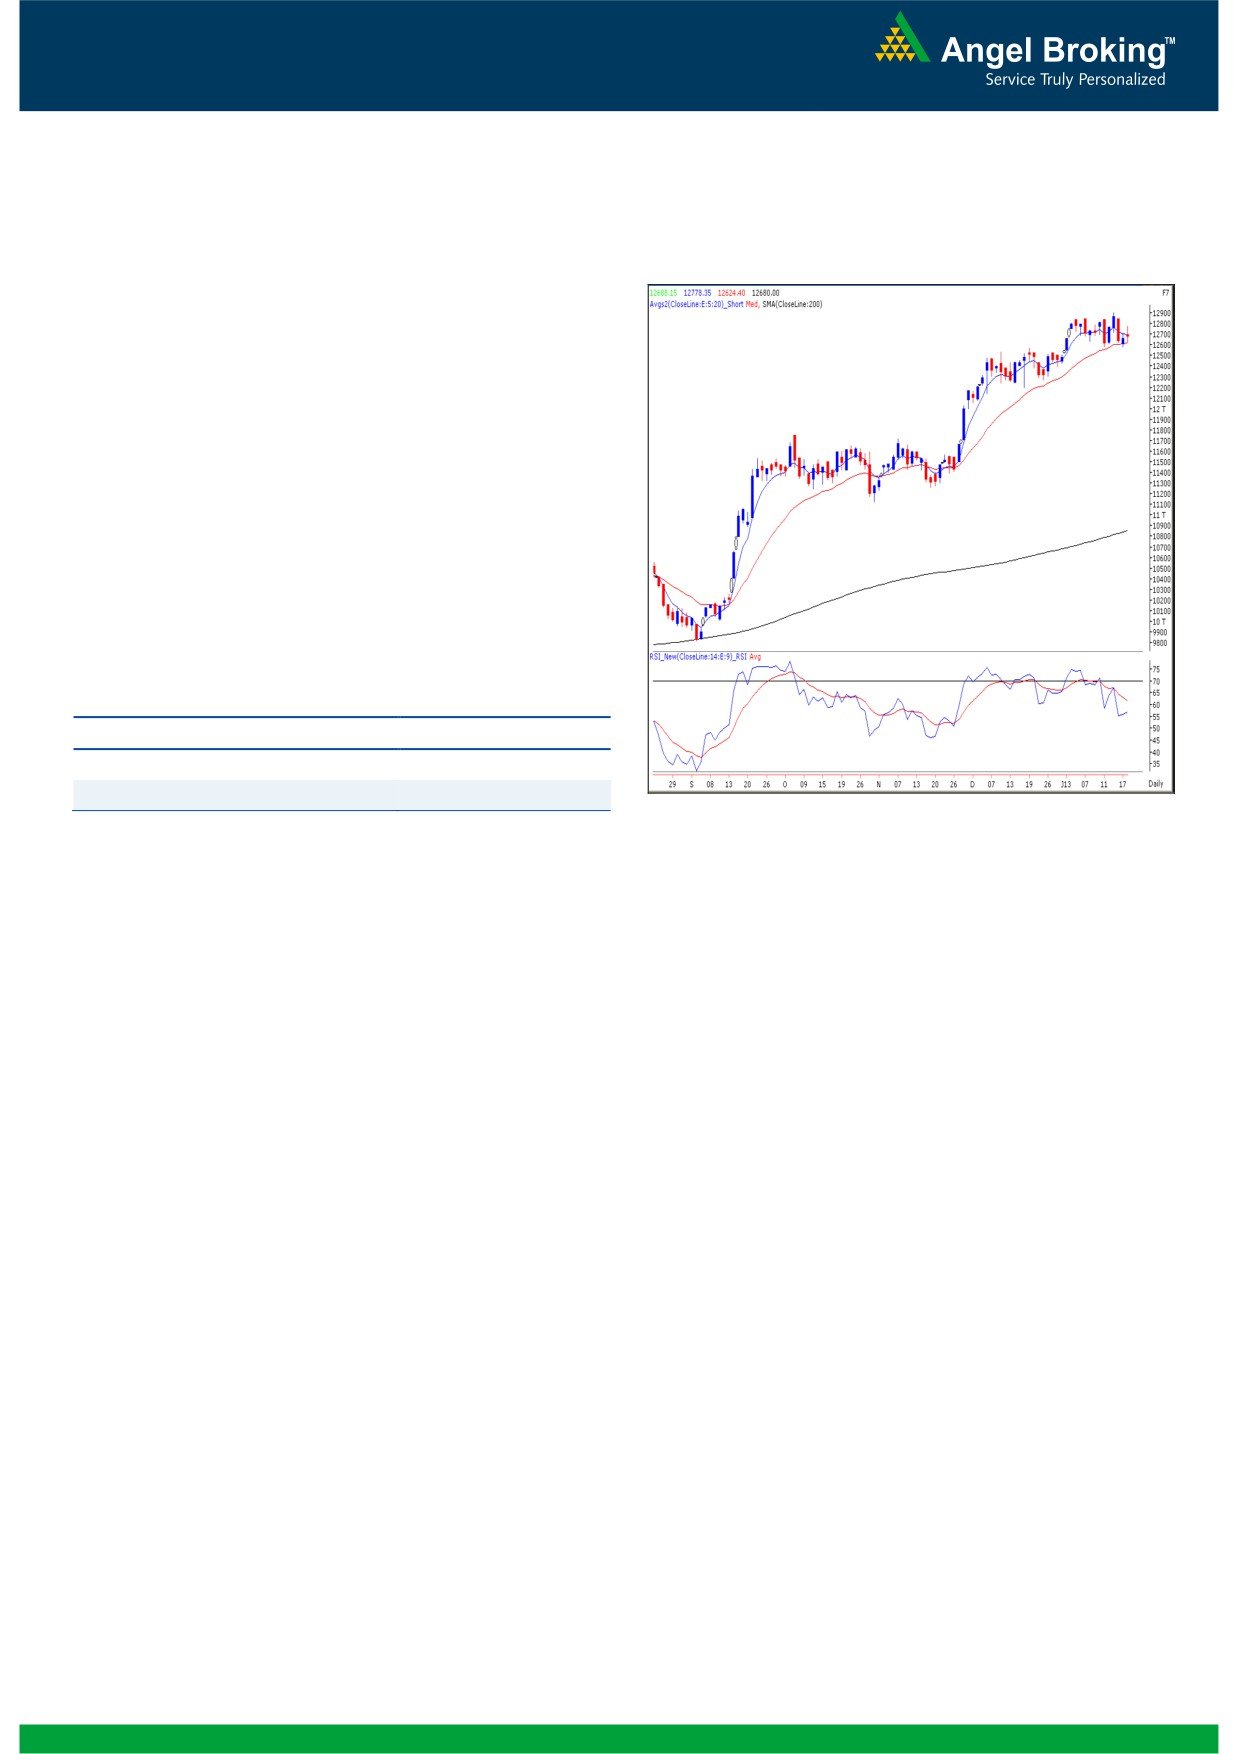
Exhibit 2: Bank Nifty Daily Chart
On Friday, we witnessed yet another range bound trading
session for the Bank Nifty. The index remained subdued
since the overall market focus was on few select large cap
counters in oil and gas space. At this juncture, we continue to
witness Negative divergence on the daily charts and thus
reiterate our view that a breach of the 12582 level, which
coincides with the 20 day moving average, would trigger
short term pessimism in the index. In this scenario, we may
witness a fall towards the 12477 / 12394 levels. On the
upside 12780 - 12908 levels are likely to act as resistance
for the day.
Actionable points:
View
Bearish Below 12582
Expected Targets
12477 - 12394
Resistance Levels
12780 - 12908
Source: Falcon:
2
Daily Technical Report
January 21, 2013
Daily Pivot Levels for Nifty 50 Stocks
SCRIPS
S2
S1
PIVOT
R1
R2
SENSEX
19,916
19,978
20,052
20,114
20,188
NIFTY
6,030
6,047
6,065
6,082
6,100
BANKNIFTY
12,540
12,610
12,694
12,764
12,848
ACC
1,318
1,332
1,349
1,363
1,380
AMBUJACEM
195
197
199
201
202
ASIANPAINT
4,232
4,271
4,315
4,354
4,398
AXISBANK
1,359
1,374
1,395
1,409
1,430
BAJAJ-AUTO
2,025
2,042
2,064
2,081
2,103
BANKBARODA
855
870
883
898
911
BHARTIARTL
341
345
349
353
357
BHEL
222
224
227
229
231
BPCL
393
414
426
447
459
CAIRN
329
333
340
343
350
CIPLA
405
408
410
413
415
COALINDIA
350
352
356
358
361
DLF
251
257
260
266
270
DRREDDY
1,850
1,871
1,903
1,923
1,956
GAIL
367
375
386
394
404
GRASIM
2,996
3,024
3,068
3,096
3,140
HCLTECH
691
699
708
715
724
HDFC
802
812
819
829
836
HDFCBANK
645
654
664
673
683
HEROMOTOCO
1,693
1,729
1,755
1,791
1,818
HINDALCO
121
122
123
124
126
HINDUNILVR
479
485
494
499
509
ICICIBANK
1,155
1,166
1,176
1,186
1,197
IDFC
172
174
175
177
179
INFY
2,759
2,774
2,792
2,806
2,824
ITC
282
285
287
290
293
JINDALSTEL
411
417
426
432
441
JPASSOCIAT
87
89
91
92
95
KOTAKBANK
615
622
626
634
638
LT
1,515
1,526
1,541
1,552
1,567
LUPIN
578
583
588
594
599
M&M
848
867
886
905
924
MARUTI
1,476
1,512
1,538
1,574
1,600
NTPC
154
159
162
167
170
ONGC
301
319
337
355
373
PNB
880
887
896
903
912
POWERGRID
111
113
114
116
118
RANBAXY
474
478
485
489
496
RELIANCE
879
890
896
907
914
RELINFRA
519
523
529
534
540
SBIN
2,456
2,474
2,496
2,514
2,535
SESAGOA
182
185
188
191
195
SIEMENS
647
652
656
661
665
SUNPHARMA
696
704
714
722
732
TATAMOTORS
323
326
329
332
335
TATAPOWER
104
106
107
109
111
TATASTEEL
408
411
417
421
427
TCS
1,324
1,337
1,352
1,365
1,380
ULTRACEMCO
1,861
1,885
1,905
1,929
1,949
WIPRO
366
382
411
426
455
3
Daily Technical Report
January 21, 2013
Research Team Tel: 022 - 39357800
DISCLAIMER
This document is solely for the personal information of the recipient, and must not be singularly used as the basis of any investment
decision. Nothing in this document should be construed as investment or financial advice. Each recipient of this document should make
such investigations as they deem necessary to arrive at an independent evaluation of an investment in the securities of the companies
referred to in this document (including the merits and risks involved), and should consult their own advisors to determine the merits and
risks of such an investment.
Angel Broking Limited, its affiliates, directors, its proprietary trading and investment businesses may, from time to time, make
investment decisions that are inconsistent with or contradictory to the recommendations expressed herein. The views contained in this
document are those of the analyst, and the company may or may not subscribe to all the views expressed within.
Reports based on technical and derivative analysis center on studying charts of a stock's price movement, outstanding positions and
trading volume, as opposed to focusing on a company's fundamentals and, as such, may not match with a report on a company's
fundamentals.
The information in this document has been printed on the basis of publicly available information, internal data and other reliable
sources believed to be true, but we do not represent that it is accurate or complete and it should not be relied on as such, as this
document is for general guidance only. Angel Broking Limited or any of its affiliates/ group companies shall not be in any way
responsible for any loss or damage that may arise to any person from any inadvertent error in the information contained in this report.
Angel Broking Limited has not independently verified all the information contained within this document. Accordingly, we cannot testify,
nor make any representation or warranty, express or implied, to the accuracy, contents or data contained within this document. While
Angel Broking Limited endeavours to update on a reasonable basis the information discussed in this material, there may be regulatory,
compliance, or other reasons that prevent us from doing so.
This document is being supplied to you solely for your information, and its contents, information or data may not be reproduced,
redistributed or passed on, directly or indirectly.
Angel Broking Limited and its affiliates may seek to provide or have engaged in providing corporate finance, investment banking or
other advisory services in a merger or specific transaction to the companies referred to in this report, as on the date of this report or in
the past.
Neither Angel Broking Limited, nor its directors, employees or affiliates shall be liable for any loss or damage that may arise from or in
connection with the use of this information.
Note: Please refer to the important `Stock Holding Disclosure' report on the Angel website (Research Section). Also, please refer to the
latest update on respective stocks for the disclosure status in respect of those stocks. Angel Broking Limited and its affiliates may have
investment positions in the stocks recommended in this report.
Research Team
Shardul Kulkarni
-
Head - Technicals
Sameet Chavan
-
Technical Analyst
Sacchitanand Uttekar
-
Technical Analyst
Mehul Kothari
-
Technical Analyst
Ankur Lakhotia
-
Technical Analyst
Angel Broking Pvt. Ltd.
Registered Office: G-1, Ackruti Trade Centre, Rd. No. 7, MIDC, Andheri (E), Mumbai - 400 093.
Corporate Office: 6th Floor, Ackruti Star, MIDC, Andheri (E), Mumbai - 400 093. Tel: (022) 3952 6600
Sebi Registration No: INB 010996539
4