Daily Technical Report
September 20, 2012
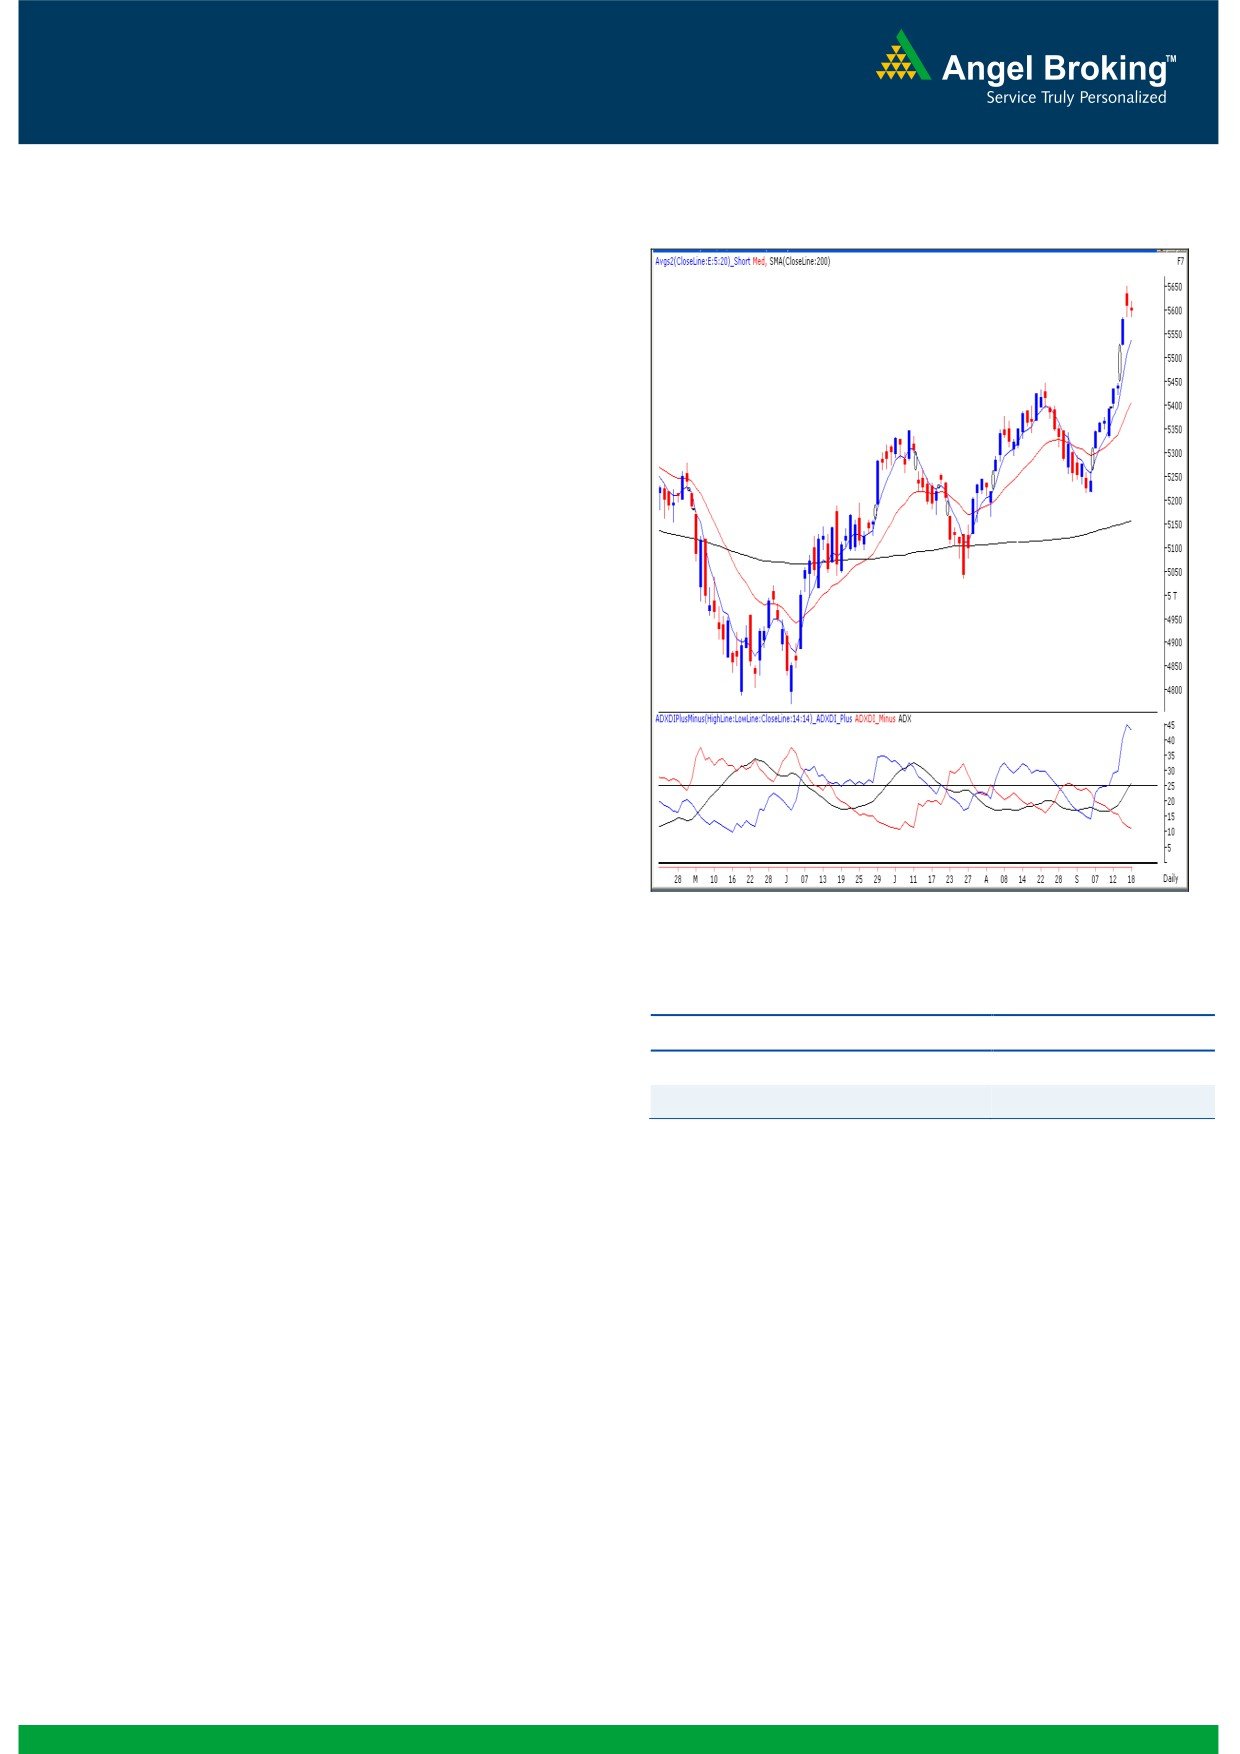
Exhibit 1: Nifty Daily Chart
Sensex (18496) / NIFTY (5600)
On Tuesday our markets opened quietly in-line with other
Asian bourses and traded in a narrow range throughout the
session to close exactly at the 5600 mark. On sectoral front
we witnessed a sharp rally in Banking counters (especially
the beaten down mid-cap PSU banks), Consumer Goods
and Power counters; whereas Oil & Gas, IT and Healthcare
sectors corrected on Tuesday’s session. The advance to
decline ratio was strongly in favor of advancing counters
Formation
The ’20-day EMA’ and the ’20-week EMA’ are placed at
17763 / 5361 and 17380 / 5261 levels, respectively.
Indices have now confirmed a weekly ‘Higher Top -
Higher Bottom’ formation.
The daily ‘RSI’ momentum oscillator on weekly chart is
still showing strength.
The weekly chart depicts an “Upward Sloping Trend
Line” breakout above 17973 / 5449 level.
The ADX (14) indicator on the Daily chart shows
Source: Falcon:
possibility of further strength in the coming sessions. The
+ DI (positive directional index) is moving upwards
Actionable points:
supported by the ADX line, which has now moved up to
26.14 level. The ADX rise from 15 to 25 indicates that
View
Neutral
the uptrend is strengthening and positive momentum is
Resistance Levels
5653 - 5702
likely to accelerate further in the coming trading
sessions.
Support Levels
5585 - 5550
Trading strategy:
After a strong rally, it is normal for the markets to show some
signs of consolidation. In line with expectations, the daily
chart now depicts a "Narrow Range" body formation, which
indicates that the bulls are taking a breather. Going forward
if our indices sustain below Tuesday's low of 18469 / 5586,
then we may witness a further correction towards the next
support level of 18380 / 5550. However, the continuous rise
in the daily ADX (14) indicator (moved up from 23.60 to
26.14) signifies that the current up trend will strengthen
further as time passes. Hence, we continue to maintain our
positive stance on the market and expect indices to move
towards their higher targets of 18945 - 19132 / 5702 -
5741 levels over the next few sessions.
Traders are advised to adopt a buy on dips strategy and
have a stock specific approach with strict stop losses on
trading positions.
1
Daily Technical Report
September 20, 2012
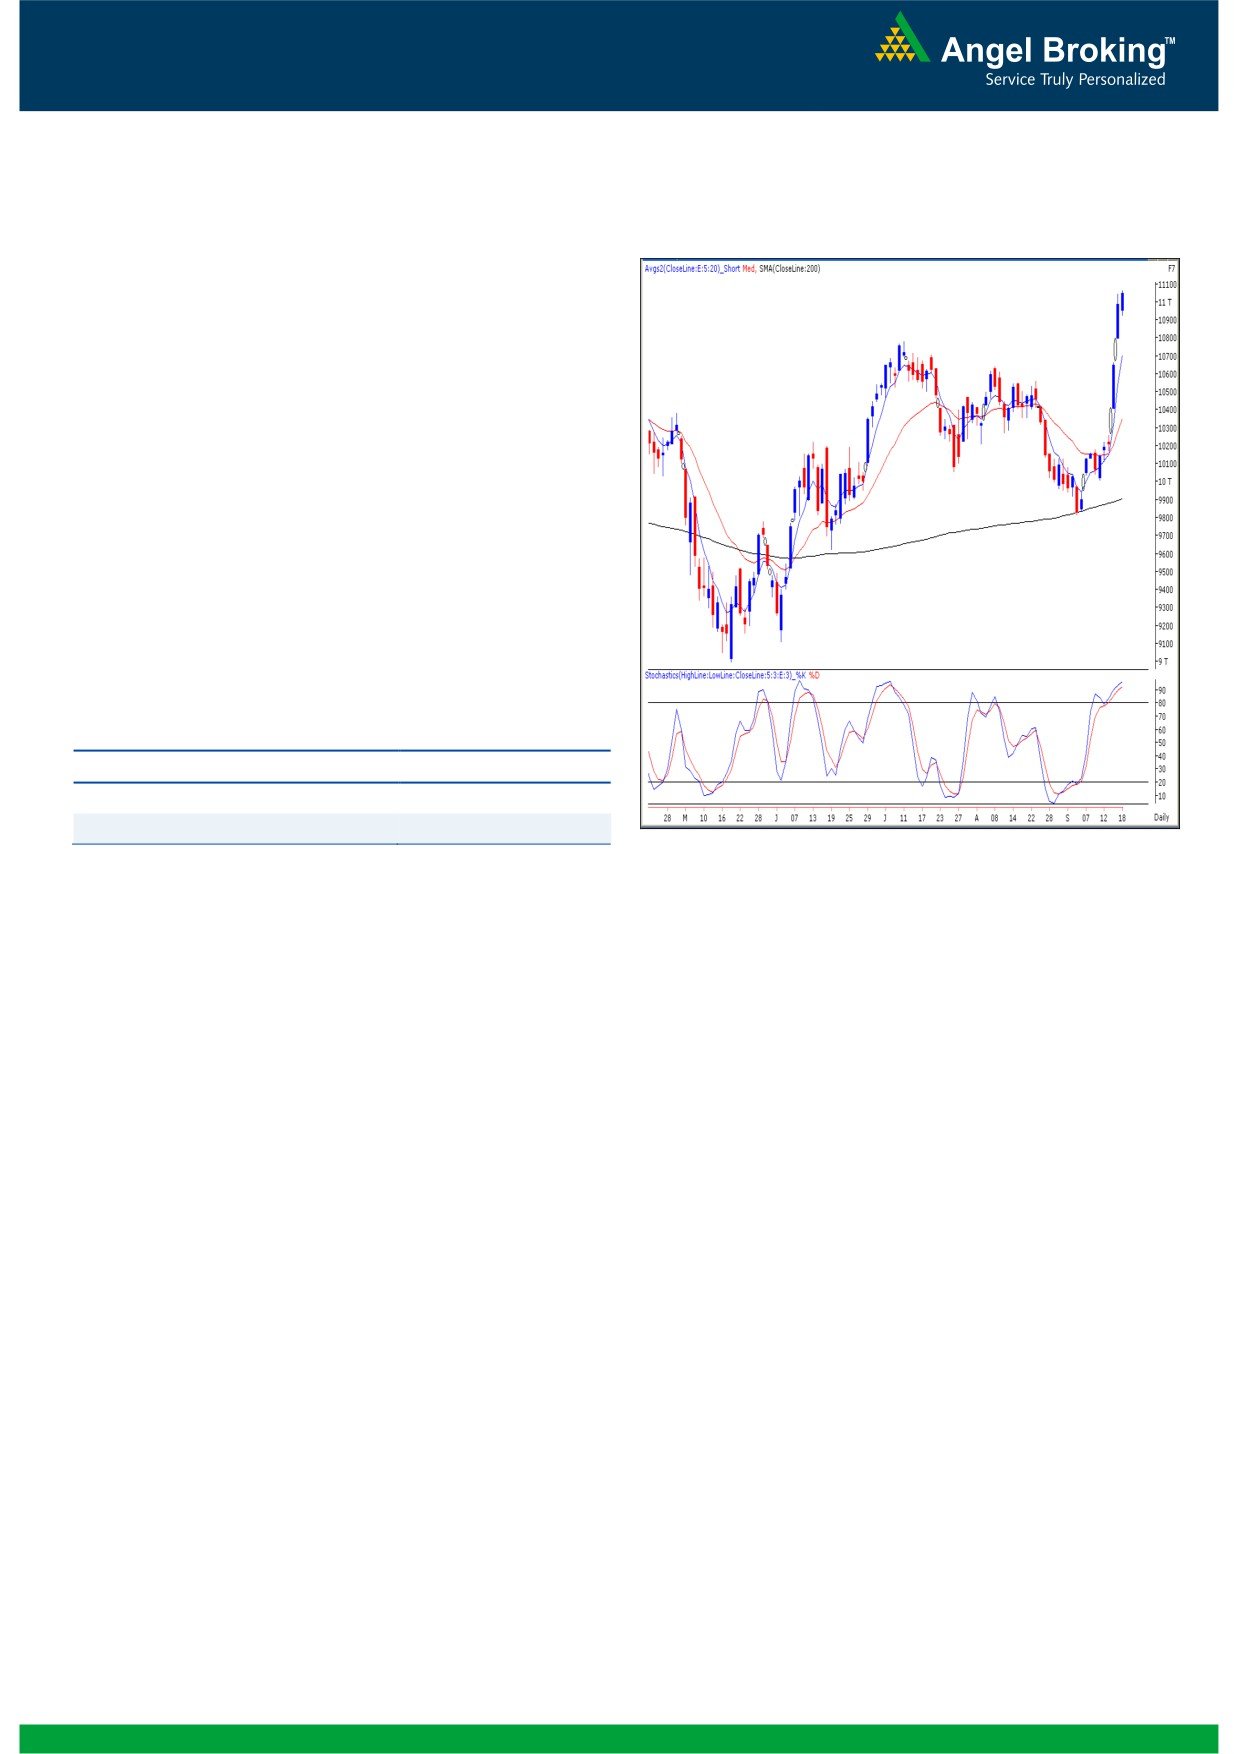
Bank Nifty Outlook - (11044)
Exhibit 2: Bank Nifty Daily Chart
On Tuesday, Bank Nifty opened on a flat note and traded in
a narrow range throughout the session to close with a
nominal gain of 0.56%. While the overall index remained
flat for the day, individual stocks in the PSU midcap banking
space rallied significantly. The “Negative Divergence” in
“RSI” momentum oscillator on the hourly chart mentioned in
our previous report is still intact. In addition the “Stochastic”
momentum oscillator on the daily chart continues to be in
overbought condition. As there is no major change in the
chart structure we reiterate our view that a minor pull back or
consolidation in the index cannot be ruled out. Thus on the
downside 10962 - 10867 are likely to act as support and
11065 - 11141 are likely to act as resistance in coming
trading session.
Actionable points:
View
Neutral
Resistance Levels
11065 - 11141
Support Levels
10816 - 10711
Source: Falcon:
2
Daily Technical Report
September 20, 2012
Daily Pivot Levels for Nifty 50 Stocks
SCRIPS
S2
S1
PIVOT
R1
R2
SENSEX
18,404
18,450
18,515
18,561
18,626
NIFTY
5,568
5,584
5,602
5,618
5,636
BANKNIFTY
10,868
10,956
11,010
11,098
11,153
ACC
1,350
1,359
1,370
1,380
1,391
AMBUJACEM
188
190
192
194
196
ASIANPAINT
3,846
3,873
3,899
3,926
3,952
AXISBANK
1,030
1,052
1,069
1,090
1,107
BAJAJ-AUTO
1,725
1,737
1,746
1,758
1,767
BANKBARODA
716
731
740
755
764
BHARTIARTL
263
266
268
271
274
BHEL
209
217
222
229
234
BPCL
330
334
339
342
347
CAIRN
340
345
354
359
368
CIPLA
357
361
368
371
378
COALINDIA
366
371
375
380
384
DLF
222
224
228
230
234
DRREDDY
1,646
1,661
1,675
1,690
1,704
GAIL
372
380
385
392
397
GRASIM
3,051
3,080
3,110
3,140
3,169
HCLTECH
557
566
571
579
584
HDFC
747
761
770
784
792
HDFCBANK
599
602
607
610
615
HEROMOTOCO
1,878
1,904
1,924
1,950
1,970
HINDALCO
112
113
115
116
117
HINDUNILVR
523
528
533
537
543
ICICIBANK
1,034
1,042
1,049
1,056
1,063
IDFC
144
146
149
151
154
INFY
2,558
2,580
2,599
2,621
2,640
ITC
248
251
255
258
261
JINDALSTEL
382
394
401
413
420
JPASSOCIAT
74
77
79
82
84
KOTAKBANK
580
590
600
610
621
LT
1,522
1,538
1,550
1,566
1,578
M&M
781
790
798
807
816
MARUTI
1,254
1,265
1,279
1,290
1,303
NTPC
162
164
167
170
173
ONGC
277
279
281
283
285
PNB
726
765
786
824
846
POWERGRID
115
117
118
119
121
RANBAXY
515
521
527
533
540
RELIANCE
838
847
860
869
883
RELINFRA
503
508
513
518
523
SAIL
85
87
88
90
91
SBIN
2,026
2,088
2,122
2,184
2,219
SESAGOA
172
174
176
178
181
SIEMENS
670
677
682
689
694
STER
100
101
102
104
105
SUNPHARMA
657
665
675
683
692
TATAMOTORS
269
271
275
277
281
TATAPOWER
96
97
99
100
101
TATASTEEL
401
403
406
409
412
TCS
1,260
1,280
1,312
1,332
1,365
WIPRO
358
364
374
380
391
3
Daily Technical Report
September 20, 2012
Research Team Tel: 022 - 39357800
DISCLAIMER
This document is solely for the personal information of the recipient, and must not be singularly used as the basis of any investment
decision. Nothing in this document should be construed as investment or financial advice. Each recipient of this document should make
such investigations as they deem necessary to arrive at an independent evaluation of an investment in the securities of the companies
referred to in this document (including the merits and risks involved), and should consult their own advisors to determine the merits and
risks of such an investment.
Angel Broking Limited, its affiliates, directors, its proprietary trading and investment businesses may, from time to time, make
investment decisions that are inconsistent with or contradictory to the recommendations expressed herein. The views contained in this
document are those of the analyst, and the company may or may not subscribe to all the views expressed within.
Reports based on technical and derivative analysis center on studying charts of a stock's price movement, outstanding positions and
trading volume, as opposed to focusing on a company's fundamentals and, as such, may not match with a report on a company's
fundamentals.
The information in this document has been printed on the basis of publicly available information, internal data and other reliable
sources believed to be true, but we do not represent that it is accurate or complete and it should not be relied on as such, as this
document is for general guidance only. Angel Broking Limited or any of its affiliates/ group companies shall not be in any way
responsible for any loss or damage that may arise to any person from any inadvertent error in the information contained in this report.
Angel Broking Limited has not independently verified all the information contained within this document. Accordingly, we cannot testify,
nor make any representation or warranty, express or implied, to the accuracy, contents or data contained within this document. While
Angel Broking Limited endeavours to update on a reasonable basis the information discussed in this material, there may be regulatory,
compliance, or other reasons that prevent us from doing so.
This document is being supplied to you solely for your information, and its contents, information or data may not be reproduced,
redistributed or passed on, directly or indirectly.
Angel Broking Limited and its affiliates may seek to provide or have engaged in providing corporate finance, investment banking or
other advisory services in a merger or specific transaction to the companies referred to in this report, as on the date of this report or in
the past.
Neither Angel Broking Limited, nor its directors, employees or affiliates shall be liable for any loss or damage that may arise from or in
connection with the use of this information.
Note: Please refer to the important `Stock Holding Disclosure' report on the Angel website (Research Section). Also, please refer to the
latest update on respective stocks for the disclosure status in respect of those stocks. Angel Broking Limited and its affiliates may have
investment positions in the stocks recommended in this report.
Research Team
Shardul Kulkarni
-
Head - Technicals
Sameet Chavan
-
Technical Analyst
Sacchitanand Uttekar
-
Technical Analyst
Mehul Kothari
-
Technical Analyst
Ankur Lakhotia
-
Technical Analyst
Angel Broking Pvt. Ltd.
Registered Office: G-1, Ackruti Trade Centre, Rd. No. 7, MIDC, Andheri (E), Mumbai - 400 093.
Corporate Office: 6th Floor, Ackruti Star, MIDC, Andheri (E), Mumbai - 400 093. Tel: (022) 3952 6600
Sebi Registration No: INB 010996539
4