Daily Technical Report
November 19, 2012
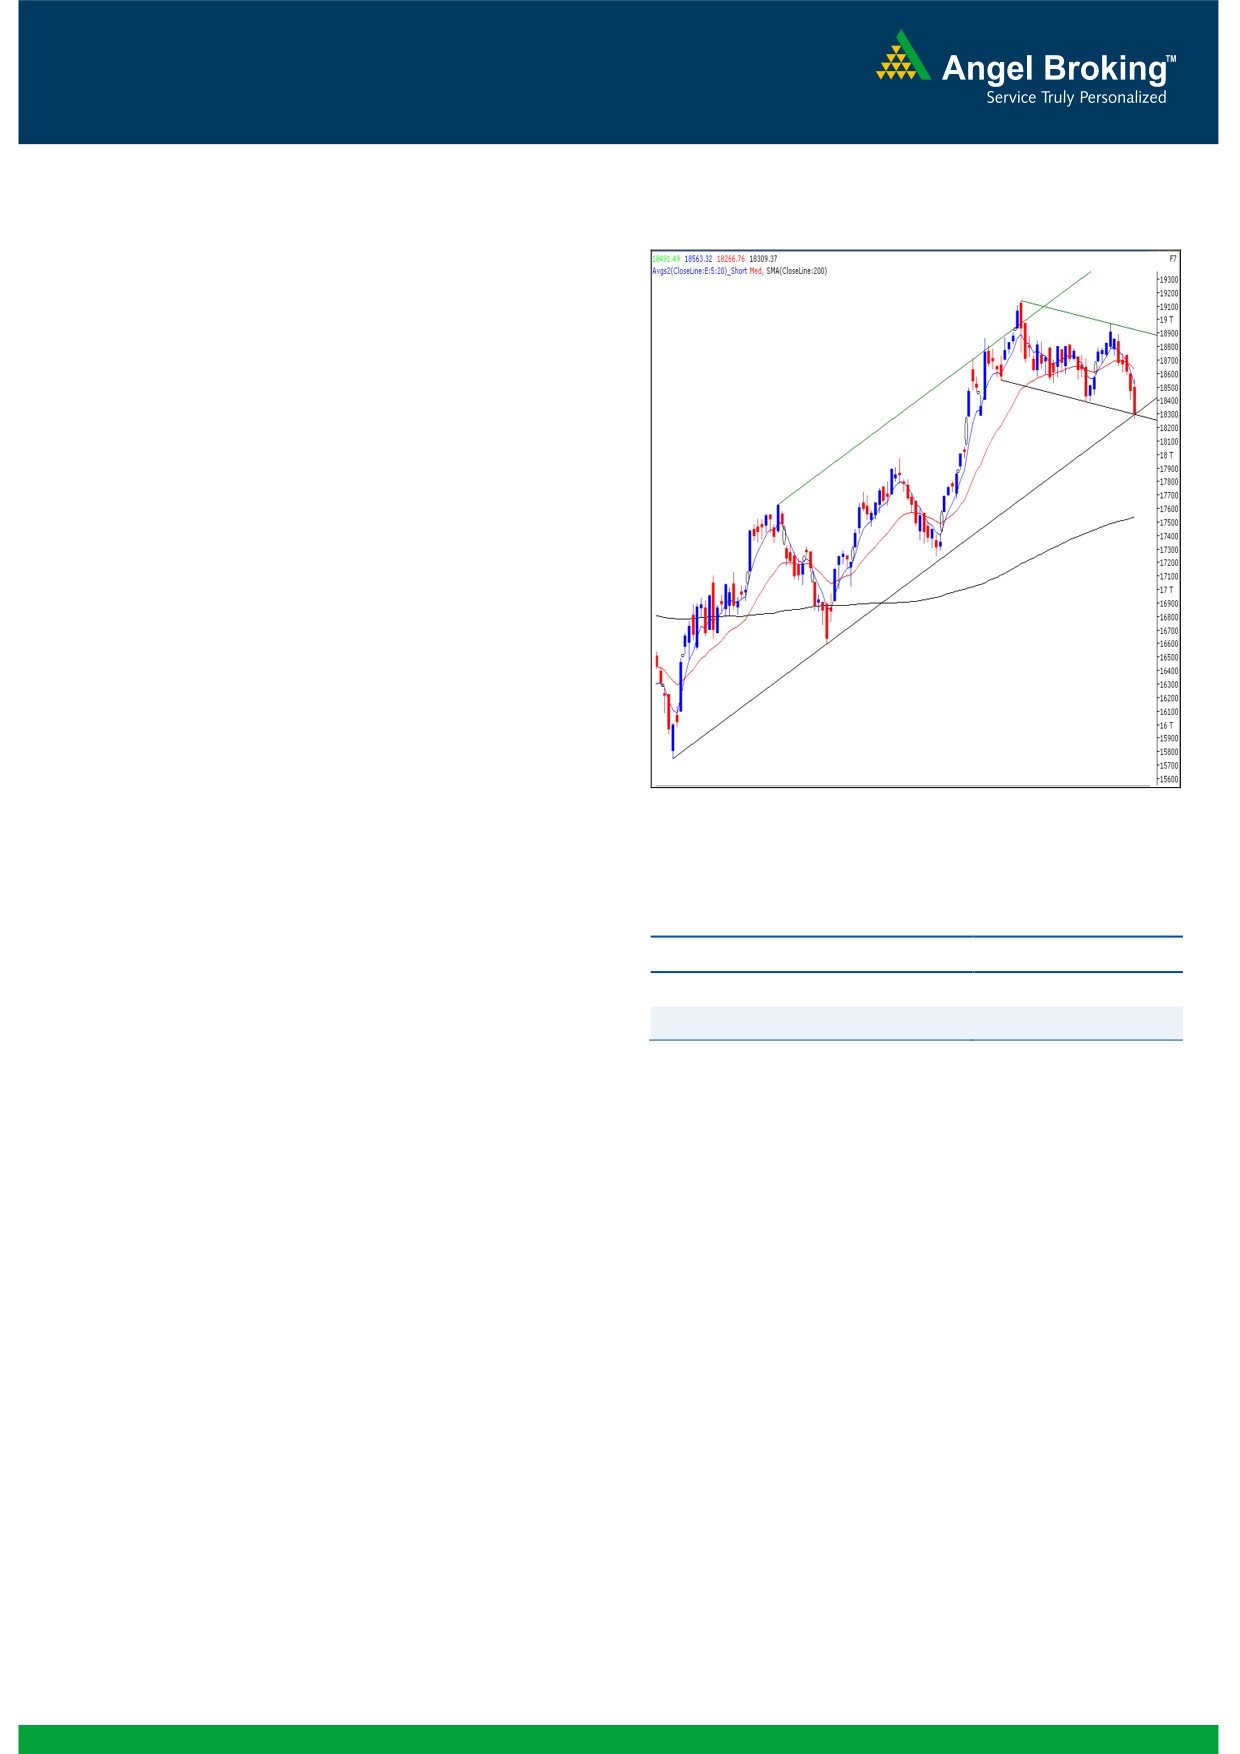
Exhibit 1: Sensex Daily Chart
Sensex (18309) / NIFTY (5574)
On Friday, our benchmark indices closed at two-month low
below the 5600 mark. Selling pressure in the final hour of
trade dragged indices to break the trading range of 5625 -
5750. Rate sensitive sectors like Realty, Banking and Auto
counters were among the major draggers which led the fall
whereas Teck and IT counters provided some support to the
markets. The advance to decline ratio was strongly in favor
of declining counters (A=1112 D=1738) (Source
-
Formation
The ’20-day EMA’ and the ’20-week EMA’ are placed at
18630 / 5668 and 18138 / 5505 levels, respectively.
The weekly ‘RSI - Smoothened’ is now signaling a
negative crossover.
Trading strategy:
Despite being a truncated week, our markets have shown a
Source: Falcon:
bigger trading range as compared to previous few weeks.
The week was dominated by the bears and our benchmark
indices breached almost all the intra-week support levels. At
Actionable points:
this juncture, our benchmark indices have precisely closed at
the convergence point of two channels. Hence, Friday's low
View for the day
Neutral
of 18266 / 5559 can be considered as a decent support for
Resistance Levels
5650 - 5700
our market. However, the weekly ‘RSI-Smoothened’ oscillator
Support Levels
5559 - 5515
has now signaled a negative crossover. Hence, we are of the
opinion that a sustainable move below 18266 / 5559 level
would trigger short term pessimism in the market. As a
result, our benchmark indices may slide towards 18194 /
5515 (50% Fibonacci Retracement level of the rise from
17250 to 19138 / 5216 to 5815). This level also coincides
with the
‘20-week EMA’ and is likely to act as an
intermediate support for the market. However, a breach of
this level may drag indices further down to fill the upside gap
level of 18062 / 5448. On the flipside, in case of a rally
during the coming week, indices may face resistance around
18564 - 18751 / 5650 - 5702 levels.
1
Daily Technical Report
November 19, 2012
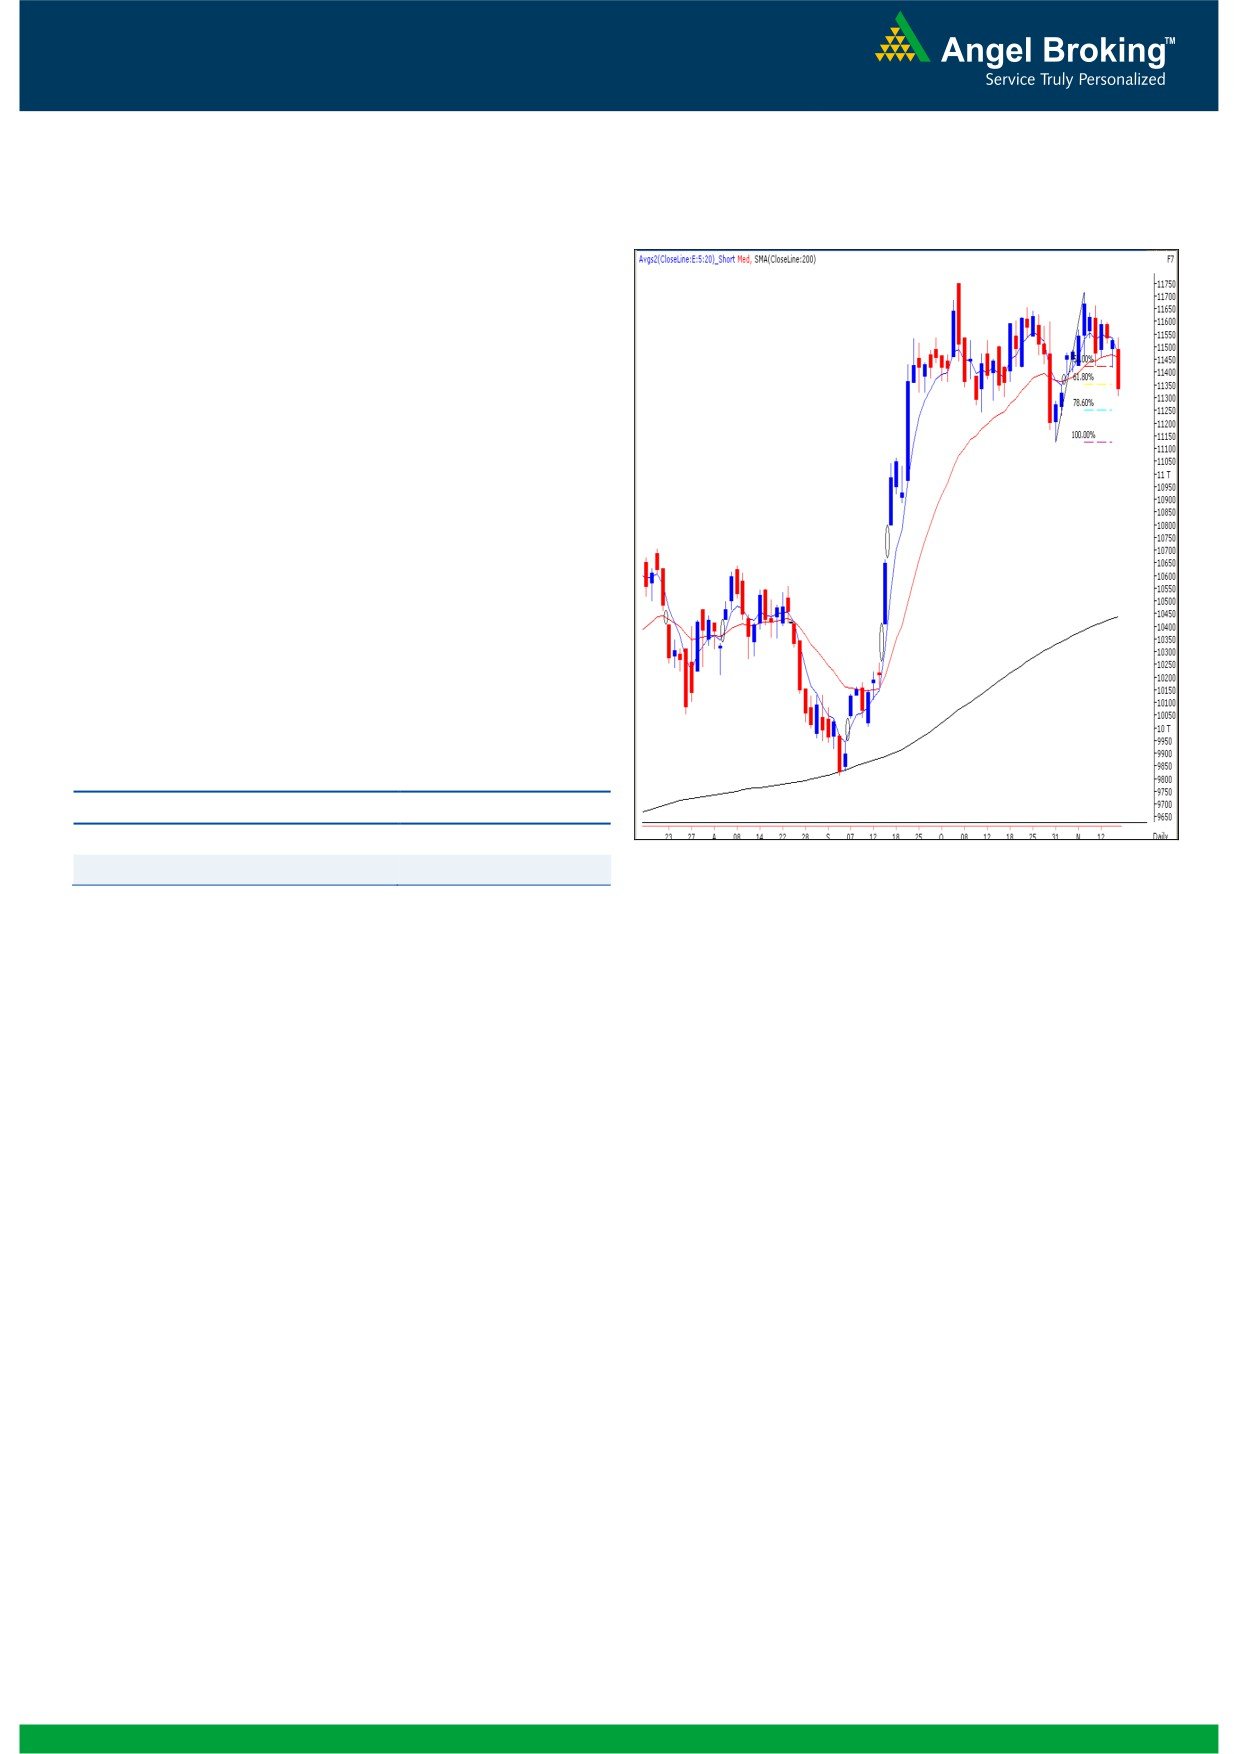
Exhibit 2: Bank Nifty Hourly Chart
Bank Nifty Outlook - (11336)
On Friday, Bank Nifty opened flat in line with our
benchmark indices. However, selling pressure in the last
hour of trade led the index to close near day's low. As
expected and mentioned in our previous reports, selling
pressure intensified below the 11420 mark. At present the
index closed below the 61.8% Fibonacci retracement level
of the rise from
11125 to
11719 levels. However,
considering the oversold condition of momentum
oscillators on the hourly chart it is likely that a minor
pullback or sideways consolidation may take place in
today’s session. Going forward, 11413 - 11506 levels are
likely to act as resistance and 11306 - 11252 are likely to
act as support for the day.
Actionable points:
View for the day
Neutral
Expected Targets
11413 - 11506
Source: Falcon:
Resistance Levels
11306 - 11252
2
Daily Technical Report
November 19, 2012
Research Team Tel: 022 - 39357800
DISCLAIMER
This document is solely for the personal information of the recipient, and must not be singularly used as the basis of any investment
decision. Nothing in this document should be construed as investment or financial advice. Each recipient of this document should make
such investigations as they deem necessary to arrive at an independent evaluation of an investment in the securities of the companies
referred to in this document (including the merits and risks involved), and should consult their own advisors to determine the merits and
risks of such an investment.
Angel Broking Limited, its affiliates, directors, its proprietary trading and investment businesses may, from time to time, make
investment decisions that are inconsistent with or contradictory to the recommendations expressed herein. The views contained in this
document are those of the analyst, and the company may or may not subscribe to all the views expressed within.
Reports based on technical and derivative analysis center on studying charts of a stock's price movement, outstanding positions and
trading volume, as opposed to focusing on a company's fundamentals and, as such, may not match with a report on a company's
fundamentals.
The information in this document has been printed on the basis of publicly available information, internal data and other reliable
sources believed to be true, but we do not represent that it is accurate or complete and it should not be relied on as such, as this
document is for general guidance only. Angel Broking Limited or any of its affiliates/ group companies shall not be in any way
responsible for any loss or damage that may arise to any person from any inadvertent error in the information contained in this report.
Angel Broking Limited has not independently verified all the information contained within this document. Accordingly, we cannot testify,
nor make any representation or warranty, express or implied, to the accuracy, contents or data contained within this document. While
Angel Broking Limited endeavours to update on a reasonable basis the information discussed in this material, there may be regulatory,
compliance, or other reasons that prevent us from doing so.
This document is being supplied to you solely for your information, and its contents, information or data may not be reproduced,
redistributed or passed on, directly or indirectly.
Angel Broking Limited and its affiliates may seek to provide or have engaged in providing corporate finance, investment banking or
other advisory services in a merger or specific transaction to the companies referred to in this report, as on the date of this report or in
the past.
Neither Angel Broking Limited, nor its directors, employees or affiliates shall be liable for any loss or damage that may arise from or in
connection with the use of this information.
Note: Please refer to the important `Stock Holding Disclosure' report on the Angel website (Research Section). Also, please refer to the
latest update on respective stocks for the disclosure status in respect of those stocks. Angel Broking Limited and its affiliates may have
investment positions in the stocks recommended in this report.
Research Team
Shardul Kulkarni
-
Head - Technicals
Sameet Chavan
-
Technical Analyst
Sacchitanand Uttekar
-
Technical Analyst
Mehul Kothari
-
Technical Analyst
Ankur Lakhotia
-
Technical Analyst
Angel Broking Pvt. Ltd.
Registered Office: G-1, Ackruti Trade Centre, Rd. No. 7, MIDC, Andheri (E), Mumbai - 400 093.
Corporate Office: 6th Floor, Ackruti Star, MIDC, Andheri (E), Mumbai - 400 093. Tel: (022) 3952 6600
Sebi Registration No: INB 010996539
4