Daily Technical Report
October 19, 2012
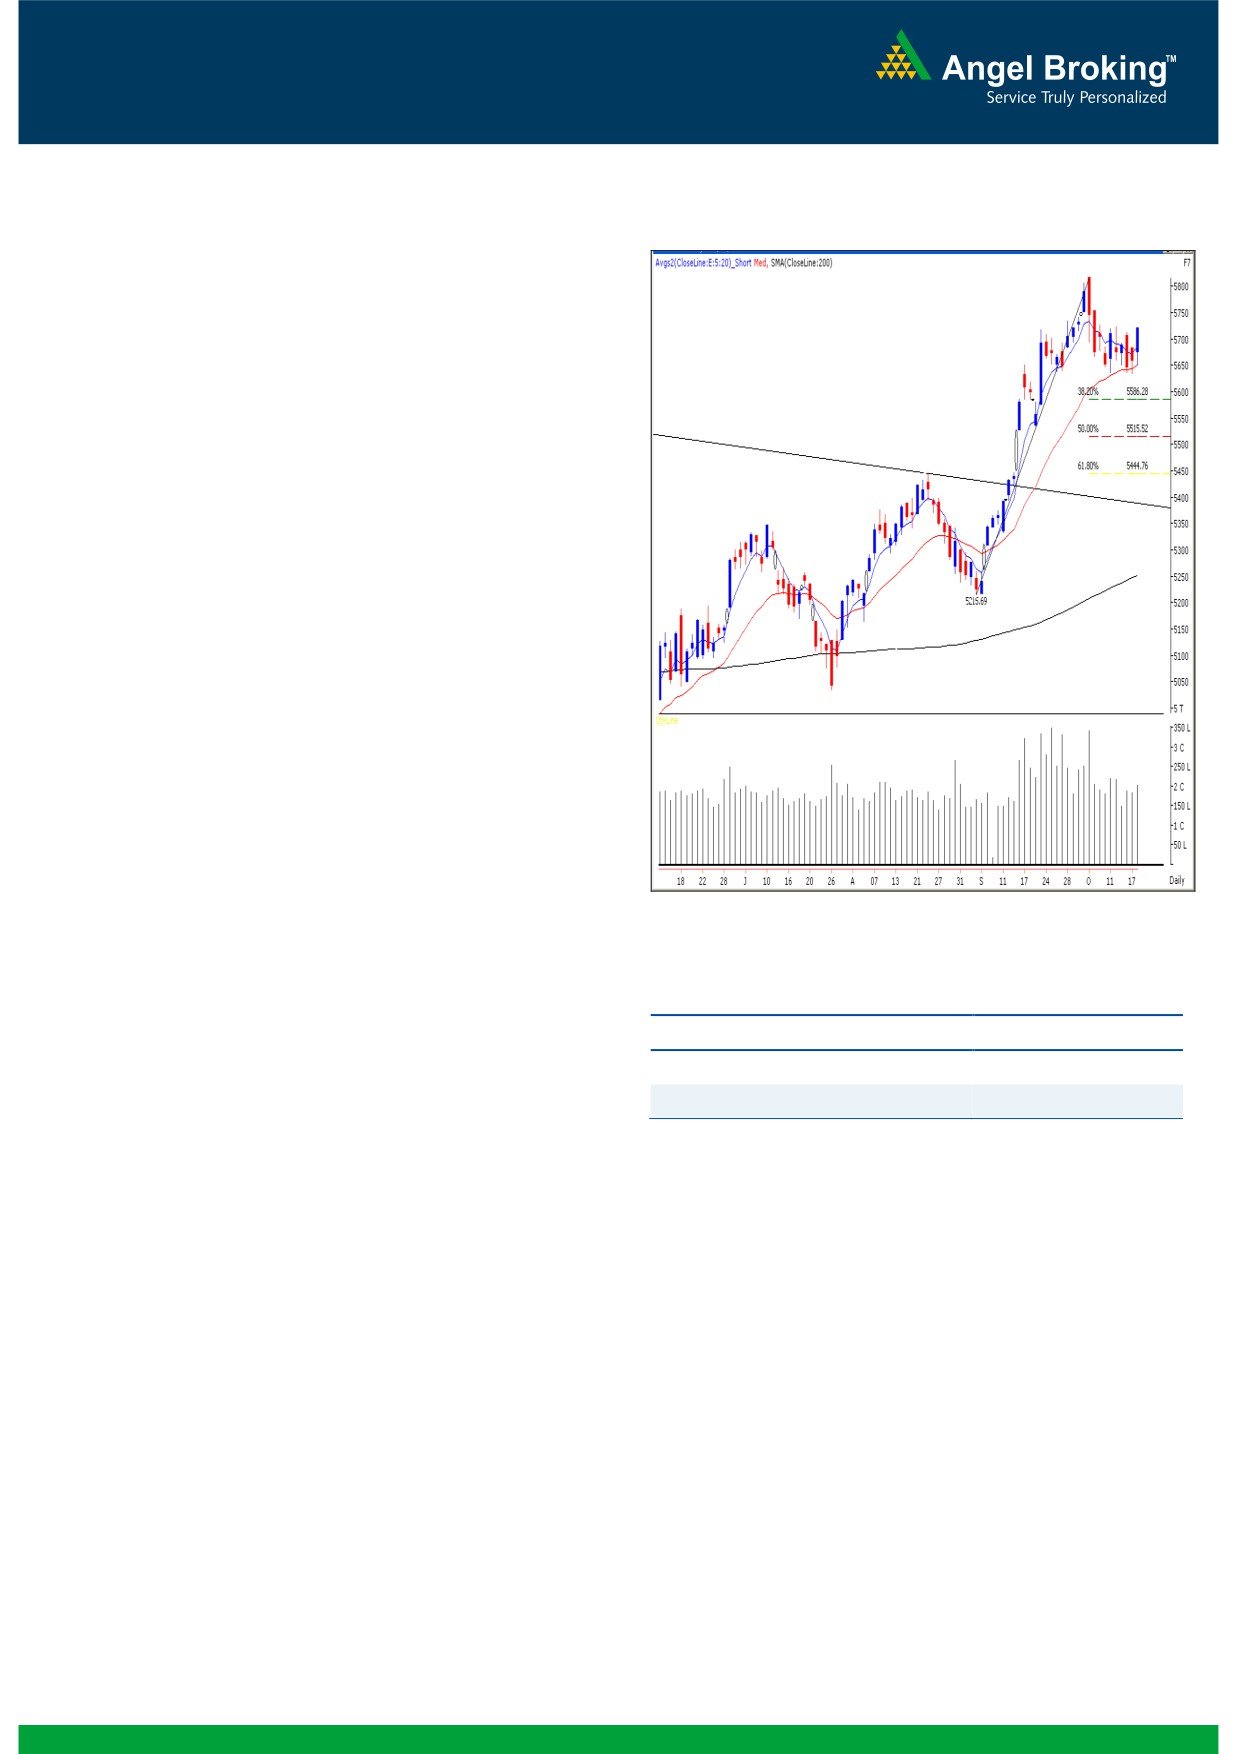
Exhibit 1: Nifty Daily Chart
Sensex (18792) / NIFTY (5719)
Yesterday we witnessed a gap up opening on the back of
strong cues from global markets and strong buying during
the second half pushed our indices higher to close on a
strong footing. The rally was mainly dominated by the
interest sensitive sectors like, Realty and Banking along with
Consumer Durables and Autos. Only the Health Care sector
ended with nominal losses. The advance to decline ratio was
strongly in favor of advancing counters (A=1727 D=1125)
Formation
The ’20-day EMA’ and the ’20-week EMA’ are placed at
18582/ 5635 and 17840/ 5400 levels, respectively.
The monthly ‘RSI’ oscillator is moving higher from the 50
mark and the positive in ADX (9) indicator is intact.
The weekly ‘Stochastic’ oscillator is now signaling a
negative crossover.
The weekly chart depicts a ‘Bearish Engulfing’
candlestick pattern.
The 38.2% and 50% Fibonacci Retracement levels of the
Source: Falcon:
rise from 17250 to 19138 / 5216 to 5815 are placed at
18416 / 5586 and 18194 / 5515, respectively.
Actionable points:
Trading strategy:
View for the day
Bullish above 5729
Finally, bulls had something to cheer about as we witnessed
Expected Targets
5757 - 5807
a sharp intraday rally during yesterday’s session. We had
Support Levels
5633
mentioned that the ’20-day EMA’ is proving out to be a
major hurdle for the bears and yesterday’s unexpected up
move further strengthens this point. However, the bulls are
yet to conquer the stiff resistance level of 18886 / 5729.
Only a move above this level would bring clarity of the trend
and higher levels of 18973 - 19107 / 5757 - 5807 can be
expected. Conversely, 18535 / 5633 level would act as
strong and crucial support in coming trading sessions. A
close below this level would certainly trigger short term
pessimism in the market. In that scenario, the markets may
slide lower to test next support levels of 18416 / 5586 and
18194
/
5515, which are
38.2% and
50% Fibonacci
Retracement levels of the rise from 17250 to 19138 / 5216
to 5815, respectively.
1
Daily Technical Report
October 19, 2012
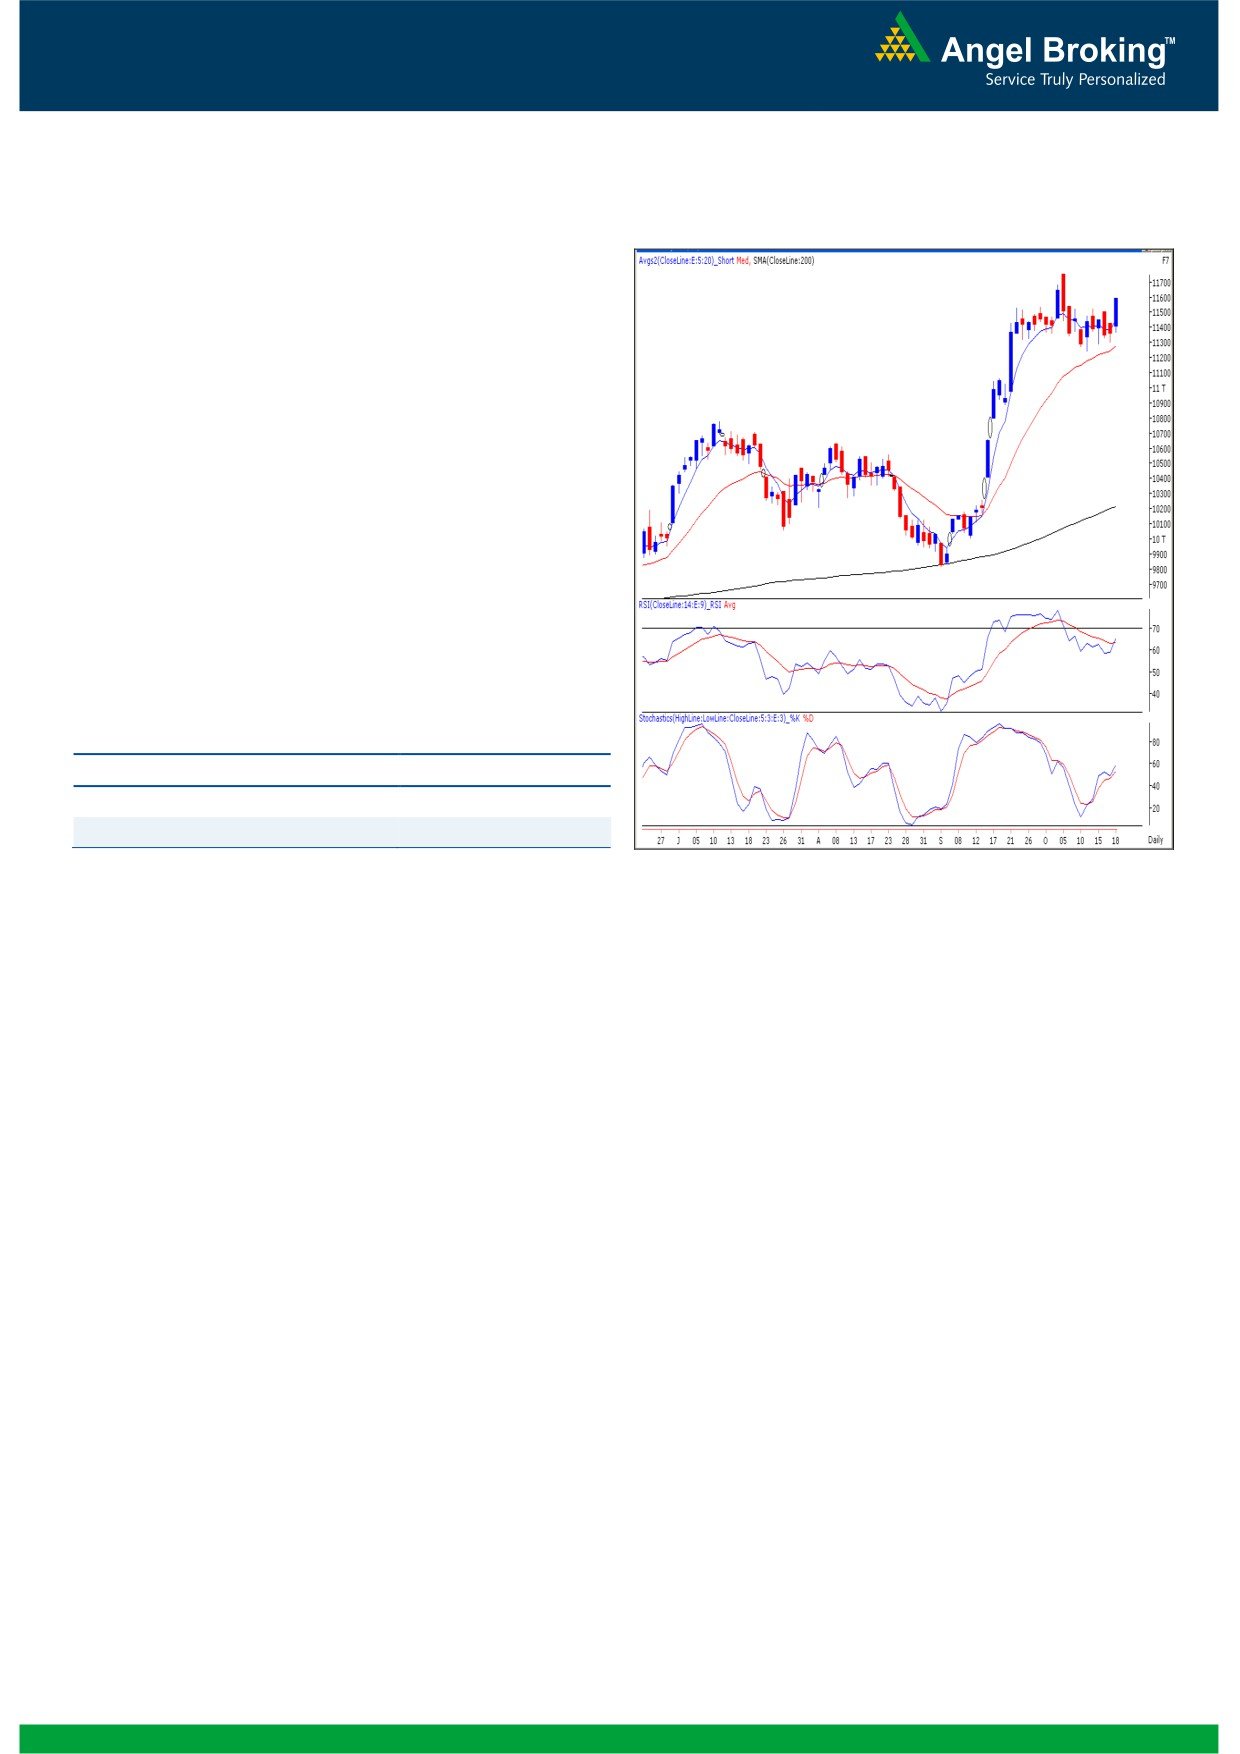
Exhibit 2: Bank Nifty Daily Chart
Bank Nifty Outlook - (11586)
Yesterday, Bank Nifty opened on an optimistic note and
gained momentum as the day progressed to close near
day’s high. The rally was mainly driven by banking heavy
weights SBI, Axis and PSU banks due to which the bulls
finally managed to give a convincing close above 11537
level. The momentum oscillator “RSI” and “Stochastic” on
the daily chart are positively poised indicating probability
of further upside in coming trading sessions. Thus if the
index sustains above yesterday’s high of 11595 then it is
likely to rally towards 11686 - 11745 level. On the
downside 11508 - 11447 levels are likely to act as
support for the day.
Actionable points:
View for the day
Bullish Above 11595
Expected Targets
11686 - 11745
Support Levels
11508 - 11447
Source: Falcon:
2
Daily Technical Report
October 19, 2012
Research Team Tel: 022 - 39357800
DISCLAIMER
This document is solely for the personal information of the recipient, and must not be singularly used as the basis of any investment
decision. Nothing in this document should be construed as investment or financial advice. Each recipient of this document should make
such investigations as they deem necessary to arrive at an independent evaluation of an investment in the securities of the companies
referred to in this document (including the merits and risks involved), and should consult their own advisors to determine the merits and
risks of such an investment.
Angel Broking Limited, its affiliates, directors, its proprietary trading and investment businesses may, from time to time, make
investment decisions that are inconsistent with or contradictory to the recommendations expressed herein. The views contained in this
document are those of the analyst, and the company may or may not subscribe to all the views expressed within.
Reports based on technical and derivative analysis center on studying charts of a stock's price movement, outstanding positions and
trading volume, as opposed to focusing on a company's fundamentals and, as such, may not match with a report on a company's
fundamentals.
The information in this document has been printed on the basis of publicly available information, internal data and other reliable
sources believed to be true, but we do not represent that it is accurate or complete and it should not be relied on as such, as this
document is for general guidance only. Angel Broking Limited or any of its affiliates/ group companies shall not be in any way
responsible for any loss or damage that may arise to any person from any inadvertent error in the information contained in this report.
Angel Broking Limited has not independently verified all the information contained within this document. Accordingly, we cannot testify,
nor make any representation or warranty, express or implied, to the accuracy, contents or data contained within this document. While
Angel Broking Limited endeavours to update on a reasonable basis the information discussed in this material, there may be regulatory,
compliance, or other reasons that prevent us from doing so.
This document is being supplied to you solely for your information, and its contents, information or data may not be reproduced,
redistributed or passed on, directly or indirectly.
Angel Broking Limited and its affiliates may seek to provide or have engaged in providing corporate finance, investment banking or
other advisory services in a merger or specific transaction to the companies referred to in this report, as on the date of this report or in
the past.
Neither Angel Broking Limited, nor its directors, employees or affiliates shall be liable for any loss or damage that may arise from or in
connection with the use of this information.
Note: Please refer to the important `Stock Holding Disclosure' report on the Angel website (Research Section). Also, please refer to the
latest update on respective stocks for the disclosure status in respect of those stocks. Angel Broking Limited and its affiliates may have
investment positions in the stocks recommended in this report.
Research Team
Shardul Kulkarni
-
Head - Technicals
Sameet Chavan
-
Technical Analyst
Sacchitanand Uttekar
-
Technical Analyst
Mehul Kothari
-
Technical Analyst
Ankur Lakhotia
-
Technical Analyst
Angel Broking Pvt. Ltd.
Registered Office: G-1, Ackruti Trade Centre, Rd. No. 7, MIDC, Andheri (E), Mumbai - 400 093.
Corporate Office: 6th Floor, Ackruti Star, MIDC, Andheri (E), Mumbai - 400 093. Tel: (022) 3952 6600
Sebi Registration No: INB 010996539
4